
Summary
Two recent defaults in the US (Tricolor Holdings and First Brands) have produced notable but, so far, contained market reactions. The immediate effects are concentrated in the subprime auto and downstream segments, with selective markdowns at exposed banks and non-bank lenders, and wider spreads in distressed and high yield credit.
Market plumbing signals (including short-term funding markets, dealer inventories) indicate localised funding friction rather than a broad systemic failure. Liquidity indicators and bank provisioning remain broadly stable.
Our review looked at the potential impact across three layers – idiosyncratic, clustered/sectoral and systemic – which suggest this episode appears manageable and will earn a pass for now.
That said, it is a useful wake-up call. The growing size and opacity of private flows, and their tightening links with banks and other intermediaries, raise structural risks that require ongoing monitoring.
The risk premium on affected segments will likely creep higher, pushing up funding costs and putting added pressure on leveraged and private players, while leading to increased investor and manager selectivity.
Background on the defaults
Tricolor Holdings is a subprime auto-lender and used-car retailer, focused on borrowers with weak credit histories. It filed for Chapter 7 liquidation in September. The episode could involve up to $10 bn of claims and more than 25,000 creditors. Regional and national banks face aggregate markdowns in the order of $0.5bn, while other trade creditors may see $0.6–$0.8bn of losses. Allegations of fraud and collateral mismanagement – notably the double pledging of vehicles – are central to the filing. The case is a direct red flag for the auto finance subsector and highlights vulnerabilities in funding mechanics.
First Brands, an auto parts supplier that expanded aggressively via acquisitions and shadow/private credit financing, filed for Chapter 11 in September. Reported liabilities run to approximately $50bn. Bondholders – particularly private credit funds and CLOs – appear likely to face low recoveries (potentially 10–20%). Thousands of trade creditors face unpaid invoices, and some banks may face markdowns in the $2–$3bn range. The causes appear to be a mix of excessive leverage, opaque off-balance-sheet financing and alleged missing funds.
While these defaults appear idiosyncratic, they underscore some of the risks embedded in private credit and shadow banking channels.
The recent defaults in the auto sector appear idiosyncratic, accompanied by orderly credit market moves and no panic selling.
Market reaction in the segments closest to the defaults
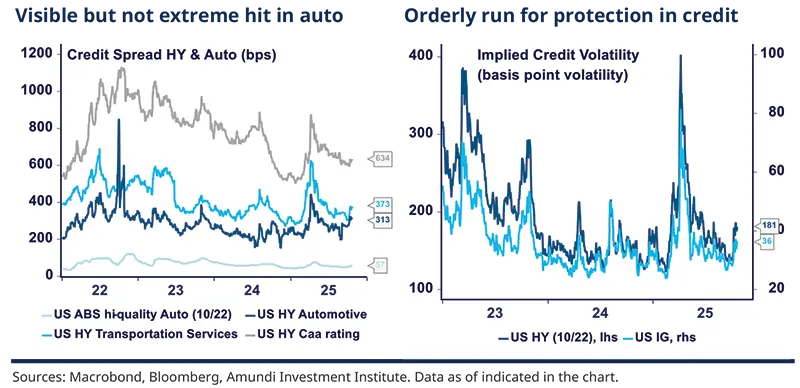
In the auto sector, high yield spreads have widened more than in other segments but remain within long-term averages. Stress in ABS and auto loan plumbing (including dealer and prime broker financing of auto ABS pools) so far appears manageable.
Distressed and broader high-yield credit experienced meaningful but also manageable spread widening. Implied credit volatility shows investors are seeking protection in an orderly way rather than panicking.
Non-bank financial institutions have exhibited selective signs of stress. Business Development Companies (BDCs) – publicly listed firms that invest in private small and medium-sized enterprises through both loans and equity stakes – not only play a significant economic role but also serve as a valuable barometer for the health of private markets. The credit spreads on BDC-issued debt have widened by approximately 30bps, reflecting increased risk perceptions in this segment. Tracking banks’ and private vehicles’ exposures is fragmentary and disclosed with a lag, meaning some unwanted exposures could surface later.
Leveraged loans, which offer insight into the direct lending environment, have also softened, though weakness is primarily concentrated in the lowest-rated tranches. Meanwhile, valuations for CLOs and private credit assets have been marked down in a targeted manner, rather than across the board, indicating that repricing remains selective rather than systemic.
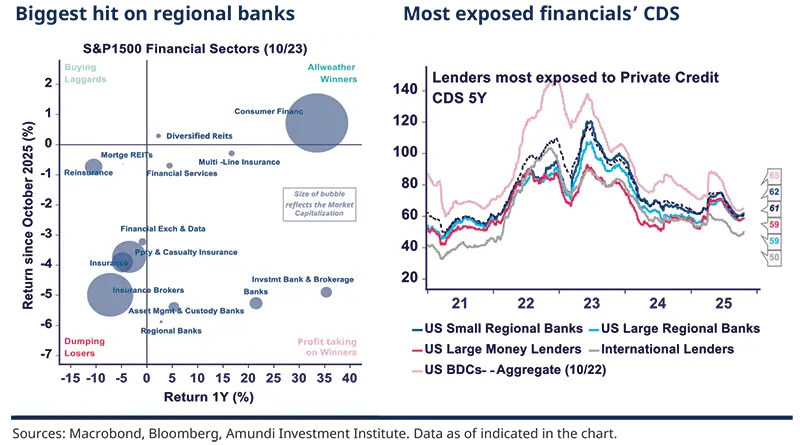
Several regional banks saw sharp share price declines and credit spread widening. These institutions were more vulnerable because of pre-existing structural weaknesses, including concentrated commercial real estate exposures and some liquidity mismatches. The moves were notable but not massive, and these banks comprise only a small portion of the US banking system.
Larger banks, by contrast, took only moderate marks. Aggregated implied CDS for single financial players most involved in these defaults rose, but do not point to a major near-term threat.
Market reaction at a broader level
Money markets and short-term funding did show brief episodes of stress. There were small anomalies in repo dynamics.
Tri-party repo is also a central funding source for dealers and large cash investors, using securities like Treasuries or ABS as collateral. Falling volumes, rising rates or sudden changes in collateral preferences can indicate cash hoarding, margin calls or a loss of confidence. A sustained fall in the TGCR (Tri-Party General Collateral Rate) volume or a rise in the TGCR vs SOFR rate would be an early warning sign, but that has not occurred in a way that signals systemic trouble.
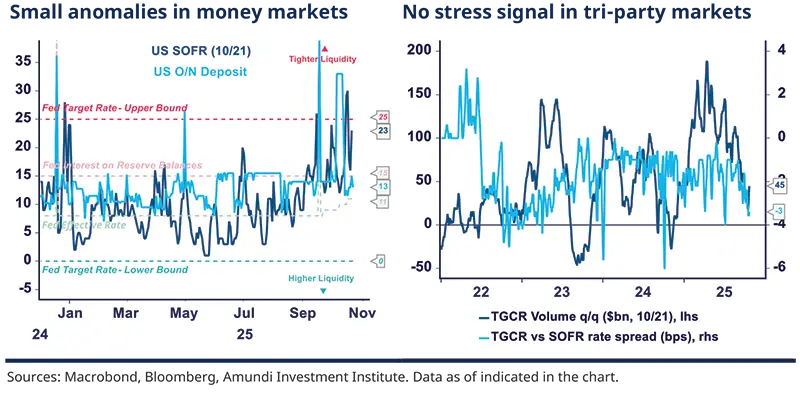
Broker financing rates and margin lending conditions have remained broadly stable and do not indicate a wholesale run.
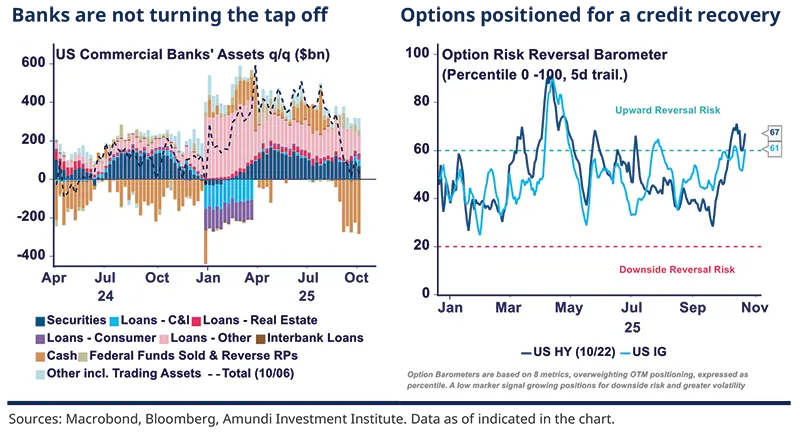
Commercial banks have reduced cash buffers, are not cutting loans and do not hold substantially higher repo reserves, which sends a reassuring message. Note, lower securities tend to highlight concern about valuations.
Option markets focusing on credit positioning show optimism and anticipation of a rally.
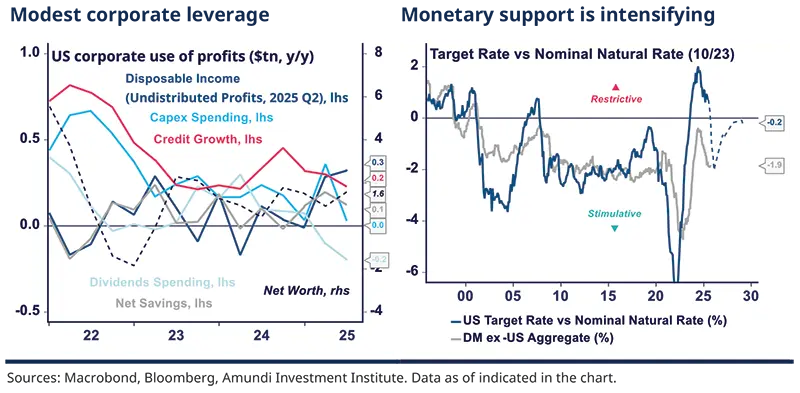
Corporate fundamentals appear resilient and leverage seems manageable, limiting the risk of a broad contagion, while policy support and easing regulation provide an added buffer.
Impact on macroeconomic and credit fundamentals
At the corporate level, earnings remain healthy and cash holdings are adequate. Outside technology, capital expenditures are moderate; many firms have trimmed shareholder distributions and kept leverage at manageable levels. These factors limit the prospects for a broad contagion.
Monetary and fiscal support are increasing, and the Federal Reserve retains tools to address liquidity stress that have not been needed so far. Deregulation in the US is also set to accelerate in the coming months, providing an additional buffer.
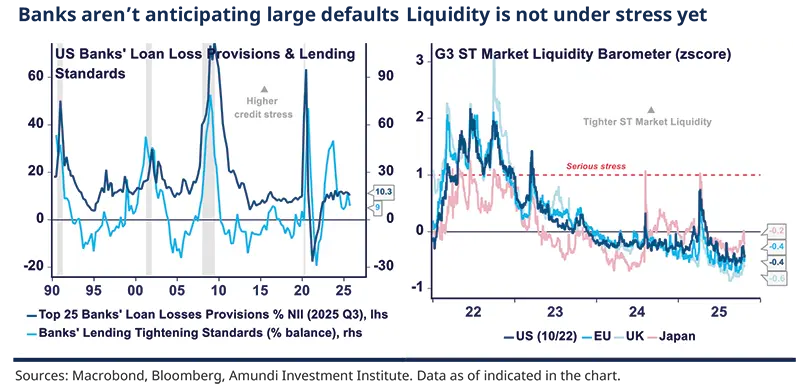
Bank provisioning and lending standards have not shown a broad deterioration through Q3 2025.
Assessing signs of contagion
Short-term liquidity metrics focused on the US show a minor deterioration but remain benign, as illustrated in the upper right chart. Because liquidity typically sets the tone for markets, this suggests the fallout from the recent defaults is likely to be short-lived.
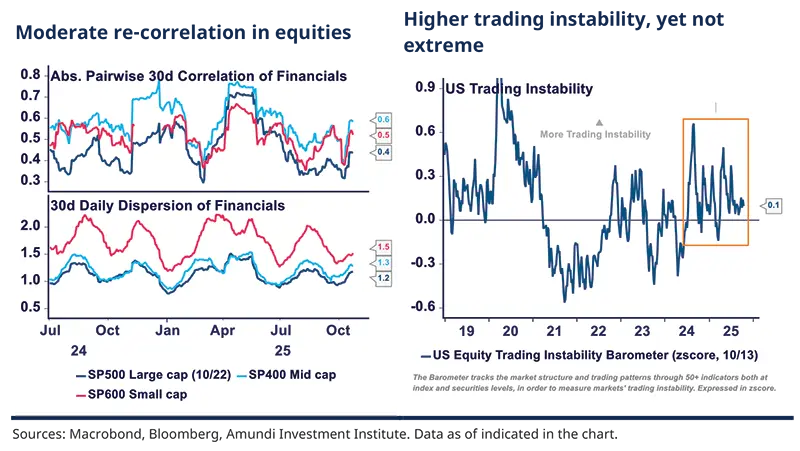
There is a mild re-correlation across financial stocks and HY credit segments, but not at the level that signals systemic panic. Our Trading Instability Barometer, which aggregates more than 50 signals to estimate the likelihood of outsized market moves, has deteriorated and appears to be settling at a structurally higher level than before – yet it remains far from extreme.
Anecdotal evidence indicates hedge funds operating in equity and credit markets have not broadly discarded their financials or consumer discretionary (including autos) holdings. Their current positions imply that they see buy-on-dip opportunities.
Recent events are a reminder of heightened medium-term vulnerability, where careful selection becomes increasingly relevant.
Conclusions and outlook
The two defaults affected thousands of creditors—banks, bondholders, CLOs and private‑credit funds—and amounted to several billion, shared across various market participants. We believe these events highlight creditor complacency around weak protections, complex documentation, accelerated underwriting and inadequate disclosure, driven by a decade‑long search for yield amid excess liquidity and unusually low default rates.
At a micro level, clustered and sectoral levels, and at a systemic level, readings are homogeneous: the episode appears manageable for now. Nonetheless, the events come as a reminder that the growth and opacity of private flows and shadow-bank plumbing increase medium-term vulnerability.
This is a wake-up call that will likely translate into a higher risk premium, lifting funding costs and pressuring leveraged players, while leading to increased investor and manager selectivity.
Investors currently face a paradox: limited near-term fundamental risks contrast with multiple medium-term risks (including geopolitics, deficits, technological ruptures etc.), which makes markets more vulnerable to wide swings. Private credit markets appear to face a similar paradox: in the short-term risks seem limited; over the medium-term, however, private credit could experience a wider cyclical shock that warrants active surveillance and a strong focus on selection.
IORB (Interest on Reserve Balances): the rate that the Fed pays banks on reserves held at the Fed, i.e. banks will not lend reserves for less than they can earn risk-free at the Fed.
SOFR (Secured Overnight Financing Rate): the market rate for O/N repo agreements collateralised by secured US Treasuries. It’s transaction-based and used as a broad risk-free reference rate.
O/N deposit rate (unsecured overnight deposit): the rate paid/received on unsecured overnight deposits or interbank overnight loans. It reflects unsecured funding costs among banks.
Banks can earn IORB risk-free by keeping reserves at the Fed. Therefore, in normal conditions, the O/N deposit rate should be at or below the IORB. If SOFR and/or O/N exceed IORB, it means banks and market participants prefer (or need) to lend in the market at higher rates than the Fed is paying or, conversely, that borrowers are paying more because of demand for liquidity, limited supply of available collateral, B/S constraints, or counterparty/credit considerations.
The upper bound is designed to be the ceiling; when market rates exceed it, the Fed’s control over short-term rates is weakened. Markets are transacting at rates above what the Fed deems appropriate for policy.
This is a sign of stress or liquidity shortages: heavy demand for cash, collateral scarcity, or counterparty risk can push O/N rates above the policy range.


Authors