
Summary
2026 would be a year of resilient global growth amid uncertain policies and a continued global shift towards multilateralism. This underscores the importance of a global approach across equities and credit in regions such as emerging markets and Europe.
2025 was an exceptional year for markets, with international equities and gold leading.
2026 is likely to be a year of resilient growth, but risks in the form of high valuations and high government debt remain.
Investors should avoid expensive segments and maintain a diversified* approach in equity markets.
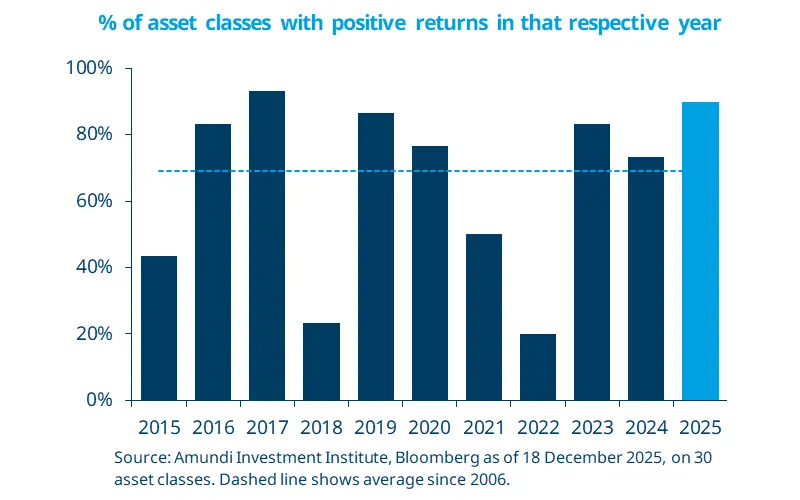
2025 was an outstanding year for market performance, with 90% of the 30 main asset classes we track posting positive returns — exceeding historical averages for the third consecutive year.
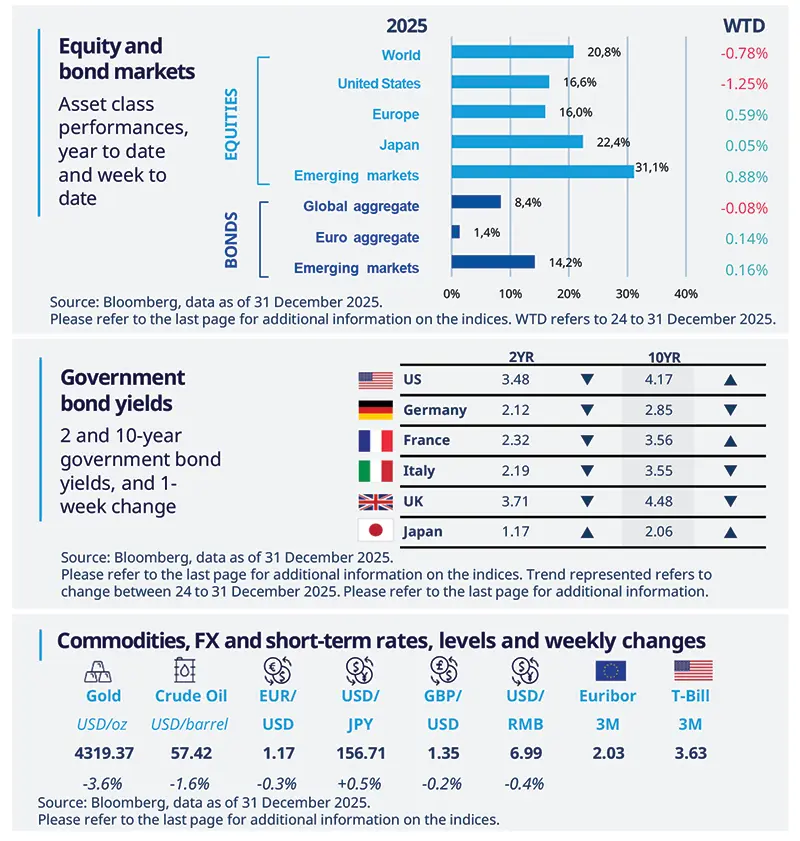
Gold, Chinese equities, and broader emerging markets led with returns above 30%, while oil prices fell nearly 20%. US stocks underperformed international equities, with the S&P 500 up 17.9% versus +32.7% for the global equity index excluding the US. The equity rally occurred despite the unconventional policies of the US administration, particularly on the tariff front, which impacted the safe-haven appeal of the US dollar. Geopolitical tensions and central-bank buying also supported gold.
Looking ahead, 2026 is likely to be a year of resilient growth, though risks from a slowing US labour market, geopolitical issues, AI-driven market euphoria, and fiscal deficits remain.
*Diversification does not guarantee a profit or protect against a loss. ** MSCI World ex US Index.
This week at a glance
US equity markets closed the year slightly below their highest levels recorded just before Christmas, while European equity markets ended at their peaks for 2025. Spain, Austria and Ireland were the best performers in Europe last year. Gold and silver fell at year-end but still posted their strongest annual performance since 1979. Meanwhile, the US dollar finished its worst year since 2017.
Equity and bond markets (chart)
Source: Bloomberg. Markets are represented by the following indices: World Equities = MSCI AC World Index (USD) United States = S&P 500 (USD), Europe = Europe Stoxx 600 (EUR), Japan = TOPIX (YEN), Emerging Markets = MSCI Emerging (USD), Global Aggregate = Bloomberg Global Aggregate USD Euro Aggregate = Bloomberg Euro Aggregate (EUR), Emerging = JPM EMBI Global Diversified (USD).
All indices are calculated on spot prices and are gross of fees and taxation.
Government bond yields (table), Commodities, FX and short-term rates.
Source: Bloomberg, data as of 2 January 2026. The chart shows the share of asset classes with positive returns in each year since 2015. Asset classes monitored are: Euro Cash 3m; US Cash 3m; Japan Govies; US Govies; EMU Govies; UK Govies; EM Govies HC; EM Govies LC; US INFL LNK; Japan INFL LNK; UK INFL LNK; Euro INFL LNK; Euro IG; US IG; Euro HY; US HY; EUR Equity; North Am Equity; Japan Equity; Pac. ex Jp Equity; GEM; China Equity; Oil WTI; Gold; Commodities; Euro Spot; USD Trade Wgt; Jap. Yen Spot; GBP Spot; EM Cur in USD. Past performance is no guarantee of future results.
1Diversification does not guarantee a profit or protect against a loss.
GLOSSARY
AI: Artificial Intelligence, ECB: European Central Bank,
EU: European Union, Fed: Federal Reserve, FOMC: Federal Open Market Committee, Purchasing Managers' Indices (PMIs): PMIs are economic indicators derived from monthly surveys of private sector companies. A reading above 50 indicates an improvement of the economic outlook, while a reading below 50 indicates a deterioration, YTD: Year-to-date, WTD: Week-to-date.
Amundi Investment Institute Macro Focus
Americas
Fed likely to pause in early 2026
The FOMC December minutes showed broad support for a 25 bp rate cut, with some participants favouring a pause to assess inflation and labour‑market data. Most saw further cuts as likely as inflation slows, but some preferred holding rates steady for a while. Labour‑market risks were viewed as tilted to the downside, while inflation risks remained elevated but somewhat diminished. A pause in early‑2026 rate cuts is expected, with further easing later in the year.
Europe
Eurozone inflation eases
European inflation data releases are starting: Belgium’s flash inflation slowed to 2.2% year‑on‑year, while in Spain inflation dipped slightly to 3.0%, driven by cheaper fuel and leisure costs. These trends suggest that Eurozone inflation is gradually cooling but remains above the European Central Bank (ECB)’s target. The ECB is likely to keep a close eye on the data before deciding on any further policy changes.
Asia
China’s business surveys show signs of expansion
China’s PMIs surprisingly ticked into expansion in December, but much of the gain reflects a quarter‑end jump — especially in production — which seasonal adjustments won’t fully remove. New orders improved on pre‑holiday stocking, yet the employment PMI worsened. The apparent demand pickup looks fragile and not clearly sustainable without stronger hiring.
Key dates
US ISM manufacturing PMI, Indonesia inflation rate |
Euro Area Inflation Flash estimate, US ISM Services PMI, US Job openings |
China Inflation, US Non Farm Payrolls, US Unemployment Rate |


Authors