
Summary
Key takeaways
|
Introduction
Securitisation is making a strategic comeback in Europe.
On 29 October 2025, the European Commission published a Delegated Regulation amending Solvency II1, significantly lowering the standard formula Spread SCR for securitisation investments.
This change is part of a broader reform package unveiled on 17 June 2025 under the Commission’s Saving and Investment Union initiative, designed to “facilitate securitisation activity in the EU while continuing to safeguard financial stability”2.
The ambition is clear: remove long-standing regulatory barriers that currently constrain issuance and investment, supporting additional lending to households and businesses.
To achieve this, the Commission has proposed targeted amendments to several key regulations3:
Securitisation Regulation (Sec Reg, EU 2017/2402), to streamline operational constraints for issuers and investors.
Capital Requirements Regulation (CRR, EU 575/2013) and Liquidity Coverage Ratio regulation (LCR, EU 2015/61) to improve the attractiveness of securitised assets for banks.
Solvency II (S2, EU 2015/35 and amendments) to recalibrate capital charges and unlock greater insurance investment capacity by reducing Spread SCR.
With over €6 trillion in assets under management (excluding unit-linked), the insurance sector is poised to play a pivotal role in the resurgence of the European securitisation market.
In this article, we highlight how the proposed regulatory changes are set to unlock capital efficient investment opportunities, optimise portfolio allocation and enhance risk adjusted returns, providing insurers with actionable insights for both current and post reform environments.
I. Current European securitisation market
1. Key features
Securitisation allows a lender or a creditor to transform portfolios of loans, receivables or other financial assets into tradable securities. Beyond simple funding, securitisation uniquely allows originators to transfer assets off-balance-sheet and release regulatory capital, thereby significantly increasing their capacity to support new credit, an effect that neither unsecured nor covered bonds can achieve.
In Europe, securitisation is governed by a dedicated regulatory framework4.
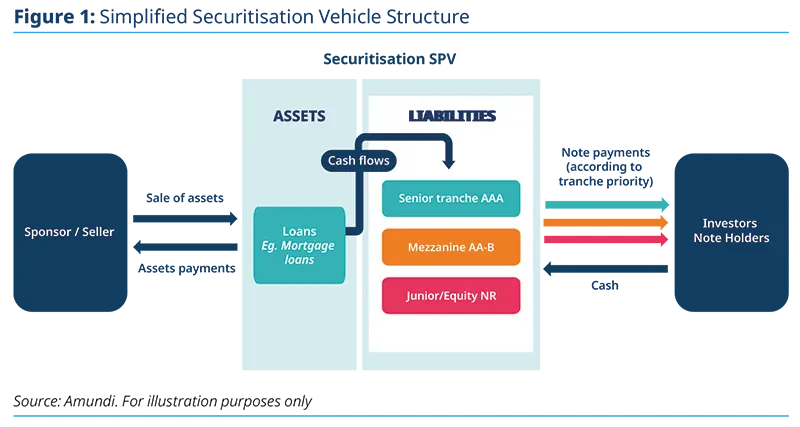
As illustrated in Figure 1, European securitisations typically rely on two key features:
Cash flow dependence: Investor payments are sourced from the cashflows generated by the underlying asset pool. These assets are sold to a bankruptcy remote Special Purpose Vehicle (SPV), legally isolated from the originator.
“Tranching” and risk allocation: Cash flows are distributed to investors according to a predefined contractual priority-of-payments waterfall, creating differentiated risk/return profiles across different classes of securities (“tranches”):
Senior (“first pay”): first in the payment priority, usually rated AAA or AA;
Mezzanine: subordinated to senior tranches, typically rated AA to B;
“Junior” or “equity” or “first loss”: absorb initial losses and is generally unrated.
Securitisation uniquely allows originators to transfer assets off-balance-sheet and release regulatory capital
2. European market overview
Securitisation pools are typically composed of homogeneous assets, differentiated primarily by their underlying asset types5.
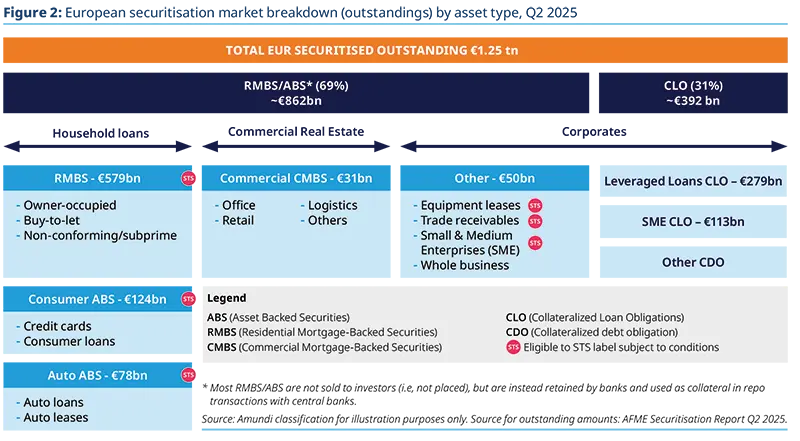
As of Q2 2025, the European securitisation market stands at €1.25 trillion outstanding. Residential Mortgage-Backed Securities (RMBS) and Asset-Backed Securities (ABS) represent approximately 69% of the market, while Collateralised Loans Obligations (CLOs) account for the remaining 31%. Across these categories, the market offers exposure to a broad array of collateral types, spanning household loans, commercial real estate and corporate assets.
The European securitisation market stands at €1.25 trillion outstanding
The STS label: Recognising safety and enhancing capital efficiency Since 2019, European securitisations that meet the Simple, Transparent, Standardised (STS) criteria benefit from regulatory recognition designed to increase investor confidence and capital efficiency. Eligible assets: Most ABS and RMBS, subject to granular pools, clear legal structures and strong performance criteria. Non-eligible assets: CLOs, CMBS and non-performing loans ABS and RMBS. |
2. Key portfolio benefits of securitisation for insurers
Building on its structural characteristics, the European securitisation market provides several attributes that are relevant to insurers’ portfolio construction and balance-sheet management:
Attractive spreads: European securitisations offer significant spread pick-ups relative to similarly rated corporate bonds, including AAA-rated tranches which provide spreads versus swaps ranging from 40bps (prime RMBS) up to 130bps (CLO primary)6.
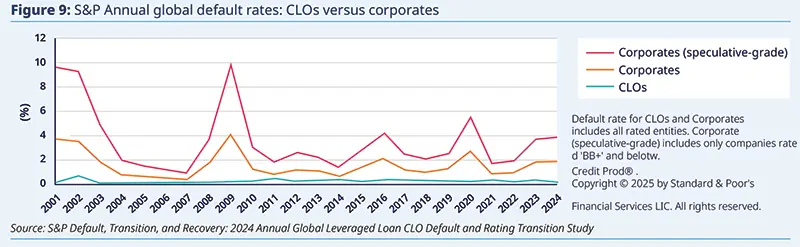
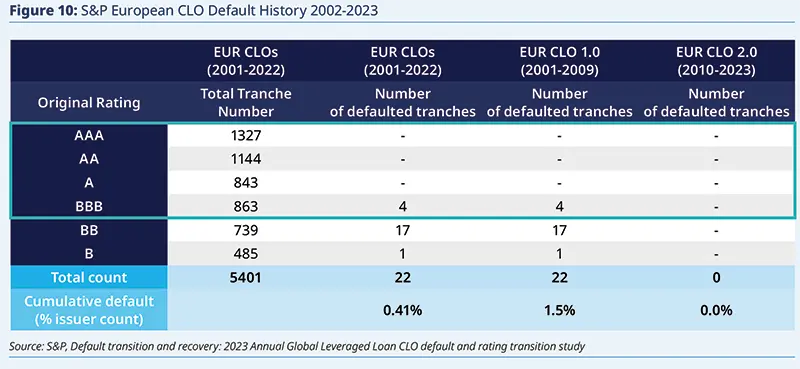
Low default rates: European securitisation, particularly senior tranches, have demonstrated low default rates over the past four decades. According to the European Commission’s latest market data and three regulatory proposals from June 2025, cumulative defaults remain below 0.1% for AAA-rated RMBS and are near zero across ABS and CLO senior tranches7.
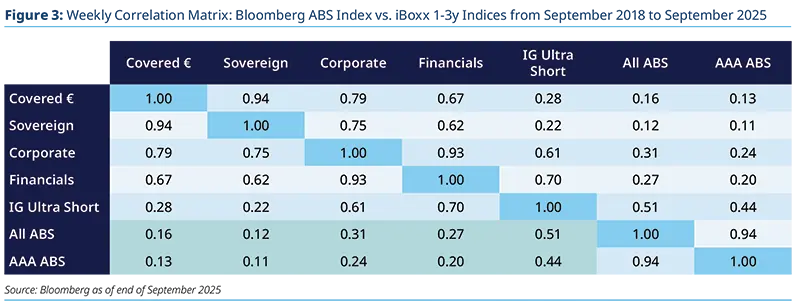
Lower interest rate sensitivity: most securitisation tranches are floating rate instruments, with coupons typically linked to short-term Euribor, which naturally limits interest rate sensitivity and helps support portfolio stability during volatile rate environment. This characteristic contributes to the historically low correlation of ABS with short-duration fixed income indices over the 2018-2025 period (see figure 3).
Liquidity: some securitisation investors typically have long term management mandates and can tolerate price volatility. During periods of market stress, they are less likely to engage in forced sales and instead, often act opportunistically, buying securitisations at discounted prices, which supports overall market liquidity.
Diversification beyond traditional bonds: securitisations provide exposure to assets with distinct risk drivers, which helps reduce correlation across credit segment and offers diversification beyond corporate or sovereign bond portfolios.
As an illustration, according to historical data from 2018 to 2025 (see figure 3), correlations between ABS (both all ABS and AAA ABS) and other short duration fixed income instruments remain relatively low. For example, all ABS range from approximately 0.16 to 0.51 while AAA ABS range from ~0.11 to 0.44.
The European securitisation market provides several attributes that are relevant to insurers’ portfolio construction and balance-sheet management
II. Solvency II regulation changes: targeted capital relief for European securitisations
The European Commission’s amendment to Delegated Regulation (EU) 2015/35 introduces targeted reductions to the Spread Solvency Capital Requirement (Spread SCR) for securitisation exposures held by insurance and reinsurance undertakings under the standard formula. These adjustments aim to better reflect the risk profile of securitisation.
The European Commission’s amendment to Delegated Regulation (EU)2015/35 introduces targeted reductions to the Spread Solvency Capital Requirement (Spread SCR)
1. Current Spread SCR framework under standard formula
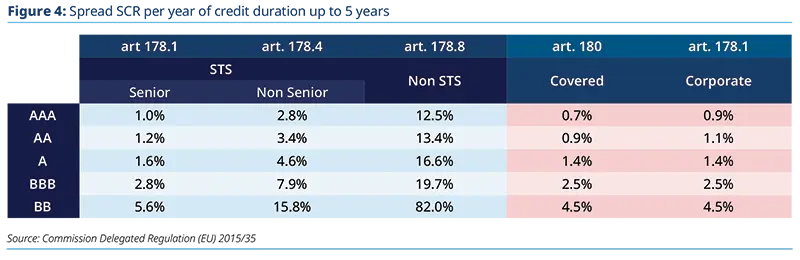
For securitisation, the Spread SCR builds on traditional factors such as credit quality step and modified duration, with additional adjustments for tranche seniority (mezzanine tranches face higher SCR) and compliance with STS label (STS-certified transactions benefit from lower SCR). It is always higher than for corporate or covered bonds of equivalent rating.
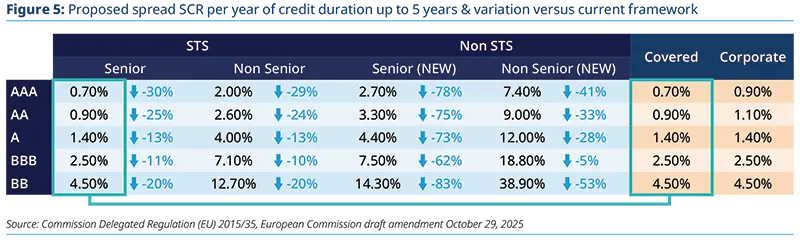
2. Proposed changes
The proposed amendment aims to significantly reduce the inconsistency between high credit SCR and low historical default rates of European securitisations by:
Aligning Senior STS tranches with covered bonds, reflecting their quality and very low historical default rates;
Significantly reducing the SCR for Non-STS transactions, which will however remain much higher than for corporate exposures;
Introducing finer distinctions between Non-STS Senior vs non-senior, allowing for more granular risk assessment and capital calibration, recognising the lower risk of senior tranches compared to subordinated ones.
EU Securitisation Regulation and CRR changes: the bigger picture8 Simultaneously, the proposed changes to the EU Securitisation Regulation, which applies to all institutional investors in EU securitisations, introduces a more principle-based verification process to reduce operational costs. Furthermore, amendments to the Capital Requirement Regulation (CRR), the prudential framework applicable to EU credit institutions, establish lower risk weights especially for “resilient” securitisations, often STS transactions benefiting from a sufficient credit enhancement. The liquidity coverage ratio (LCR) framework is also adjusted providing greater flexibility for securitisation notes eligibility, including those rated A- or above and applying lower haircuts. |
III. A new deal for the European securitisation market
1. Expected impact of regulatory changes
We expect that the combined effect of the Solvency II, CRR and securitisation Regulation amendments will reshape the European securitisation landscape.
A broader investor base
Lower capital charges, spread SCR for insurers and Risk Weights for banks, will encourage them to increase their securitisation allocations, especially by aligning the capital treatment of senior STS tranches with that of covered bonds.
Compression of spread
As demand increases, we expect spreads to tighten.
Issuance volumes set to surge
Tighter spreads will drive issuers to turn to securitisations as an efficient funding tool. Compared with covered bonds or other secured instruments, securitisations offer an efficient way to raise capital and free up balance sheet capacity. Particularly in the ABS and RMBS segments, we expect this dynamic to unlock significant issuance volumes, creating new opportunities for capital deployment.
Diverging growth dynamics across securitisation segments
|
Market depth and liquidity enhancement
Overall, higher issuance volumes and broader investor participation should enhance market depth and liquidity, providing investors with a wider choice of issuers and issuances.
2. Expected timeline for implementation
The upcoming amendments to the CRR and Securitisation Regulation, as EU-Level 1 acts, will require a European trilogue and will therefore take time to finalise. We currently expect the revised regulations to enter into force in early 2027, alongside the implementation of the Solvency II measures expected to be implemented at the end of January 2027.
Regardless of the exact timetable (see our expectations in figure 6 below) market participants are likely to enter the market or increase their exposure promptly to capture the anticipated spread compression. In this context, we consider European securitisations present an immediate opportunity to seize.

IV. How to seize the opportunity: illustrative investment scenarios for insurers
The following scenarios illustrate how insurers can explore potential ways to enhance portfolio resilience, improve capital efficiency and access higher yields through securitisation, both under the current Solvency II framework and the proposed 2027 SCR recalibration. These examples are illustrative and based on representative market data, designed to help insurers understand how securitisations could complement traditional fixed income portfolios. Figures are indicative only and not a recommendation for investment.
1. Scenario 1 - Enhancing capital efficiency with STS ABS (current Solvency II framework)
Context Initial Portfolio set-up
Strategy applied
Key outcomes
Illustrative Real-life implementation We have implemented a portfolio composed of high-grade STS tranches, predominantly senior (86%) with a Weighted Average life (WAL) of 2.1 years for a Solvency II-regulated insurer using the standard formula, delivering:
This real-life portfolio illustrates that even under current SCR rules, insurers can unlock substantial capital-adjusted returns with a disciplined allocation to high-quality STS ABS. 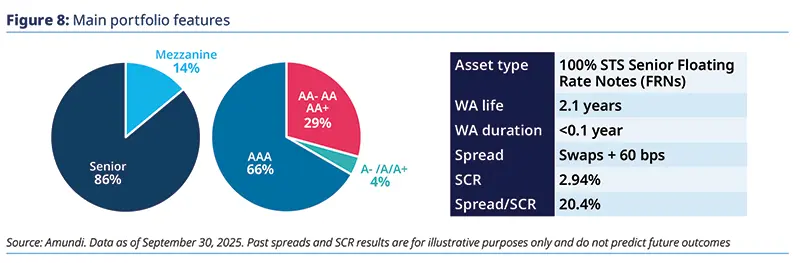
|
2. Scenario 2: Evaluating CLO opportunities despite elevated SCR charges
Context For non-Solvency-II-regulated investors, CLOs are highly attractive for thanks to:
Strategy applied
Key outcomes
Implications
|
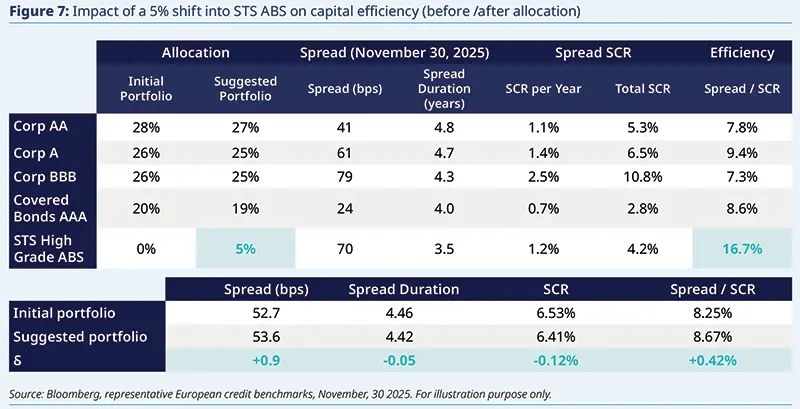
3. Scenario 3: optimising portfolio allocation under the proposed Solvency II SCR recalibration
Context The 2027 reform is expected to materially reduce spread SCR for senior STS tranches and introduce a more risk-sensitive treatment for non-STS assets, expanding the investable universe. This hypothetical scenario illustrates how an insurer could optimise its credit portfolio under the proposed SCR recalibration, balancing capital efficiency and risk-adjusted returns.
Strategy applied
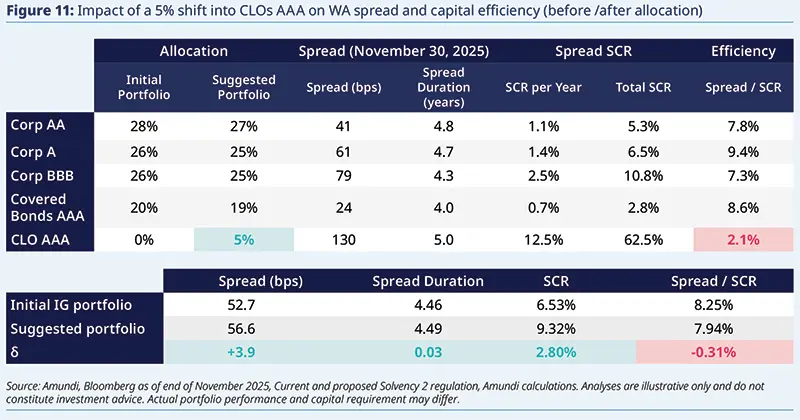
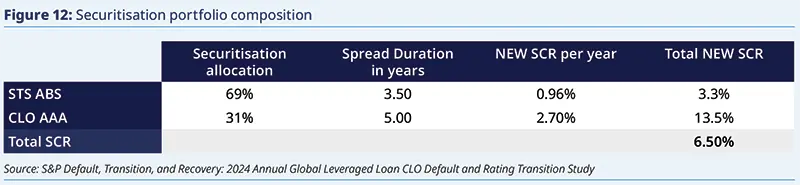
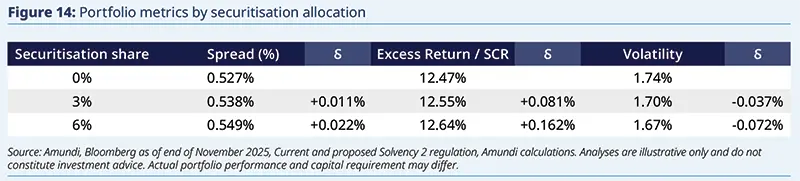
We suggest a securitisation portfolio allocation of 69% STS ABS and 31% Non-STS assets (limited to AAA CLO 2.0 tranches11) in order to maintain a 6.50% portfolio spread SCR, in line with the 6.53% SCR of the reference IG portfolio. As a result, the use of securitisations improves the weighted-average rating of the initial IG portfolio.
Key outcomes Base case (efficient frontier optimisation):
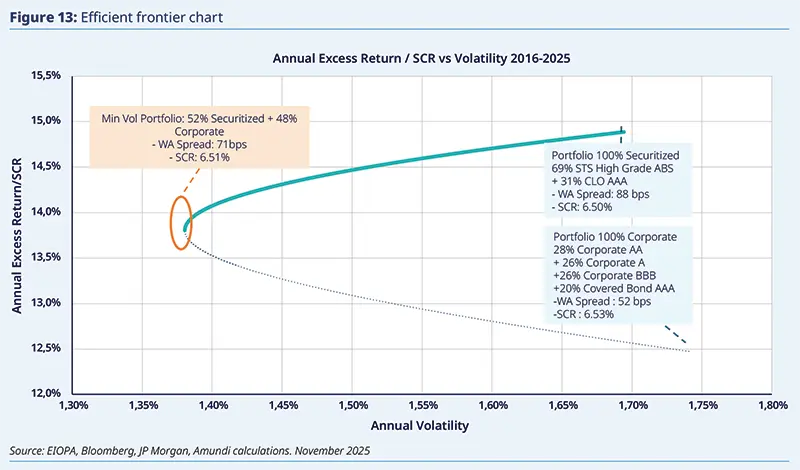
20% securitisations spread compression scenario
The examples below illustrate the benefits of increasing securitisation exposure within these limits.
|
4. Strategic summary
Before the 2027 reform: STS ABS have the potential to improve capital efficiency and portfolio diversification, while CLO use remains constrained by high SCR charges under the current Solvency II framework;
After the 2027 reform: lower SCRs and a more risk-sensitive treatment of non-STS assets are expected to broaden capital-efficient investment opportunities;
Overall: applying a disciplined and optimised allocation framework to securitisation could enhance risk-adjusted performance and diversification, reinforcing its relevance within insurers’ credit portfolios;
Looking ahead: As the European securitisation market evolves with the upcoming reforms, insurers should assess how structured credit may complement traditional credit strategies in a capital-efficient and diversified way.
- European Commission, Commission Delegated Regulation (EU) of October, 29 2025 amending delegated regulation (EU) 2015/35 on Solvency II, available at https://finance.ec.europa.eu/regulation-and-supervision/financial-services-legislation/implementing-and-delegated-acts/solvency-2_en
- https://finance.ec.europa.eu/publications/commission-proposes-measures-revive-eu-securitisation-framework_en
- Although not included in the current package, potential refinements to UCITS control ratios are also being discussed in the market.
- EU 2017/2402 Article 2. https://eur-lex.europa.eu/legal-content/EN/TXT/PDF/?uri=CELEX:32017R2402
- Due to jurisdiction-specific regulations of loans to households, pools of ABS and RMBS almost always rely on a specific country. On the contrary, leveraged loans are often comparable and CLOs are always diversified across Europe to benefit from diversification.
- AFME Q2 2025 Securitisation Report
- EUR-Lex - 52025PC0826 - EN - EUR-Lex
- Source: European Commission, Proposal for amending regulation (EU) 2017/2402 on securitisation, COM (2025) 325 final, June 2025, URL
- Source: EIOPA Financial Stability Report June 2025, Credit quality of bond portfolios. For simplicity, non-investment grade (1.6%) and not rated bonds (5.5%) have not been taken in consideration; AAA are supposed to consist in Covered Bonds, other ratings in corporate bonds.
- Source Bloomberg, ICE BofA Euro Corporate Index as of 30/11/2025.
- Among non-STS securitisations, AAA CLO tranches were selected as the sole non-STS exposure due to their strong historical performance in Europe (no default over
15 years), highly diversified collateral and the most attractive risk adjusted return. Other non STS options (non-STS ABS and CMBS) were less suitable due to higher SCR, limited liquidity and concentrated default risk. - ICE BofA Euro Corporate, Bloomberg Euro ABS, JP Morgan CLO spreads


Authors

CONTRIBUTORS
- Sylvie Nonnon, Insurance Senior Advisor, at Amundi
- Geoffrey Sauwala, Senior Portfolio Manager ABS/CLO, at Amundi
- Amadou Loum, Senior Portfolio Manager ABS/CLO, at Amundi