
Summary
“Responsible investment is moving from aspiration to execution. Expectations for stewardship, especially in Europe, continue to intensify, and there is a growing emphasis on directing capital toward climate solutions that deliver measurable, real world impact.
In 2026, the focus will extend beyond transition plans to core issues of resilience and natural capital preservation. As physical risks rise and energy systems transform at unprecedented speed, what will set leaders apart is not ambition, but the ability to act decisively and at scale to secure strategic autonomy and lasting financial resilience.”
Elodie LAUGEL
Chief Responsible Investment Officer, Amundi
Key takeaways
Responsible investment dynamics in 2025
Positive inflows led by fixed income in a context of continued normalisation of responsible investment flows and pronounced asset and style rotation
The responsible investment market continued its normalisation in 2025, with €108bn net inflows in Europe in 2025’s first three quarters, accounting for >95% of total global RI inflows1. Fixed income has led net inflows, with the share of responsible investment in fixed income in Europe accounting for 63% of total AuM as of Q3 20252. On responsible investment equities, demand has shifted from restrictive passive screens towards broader exposure, with stronger appetite for low tracking error strategies.Responsible Asset Owners stayed the course as climate coalitions recalibrated
Recalibration of climate coalitions (NZAM, NZBA) did not translate into a retreat from sustainability. Instead, it reinforced a more demanding phase of stewardship from asset owners, reallocating misaligned mandates in extreme cases.ESG index performance remained aligned with benchmark, with regional divergence
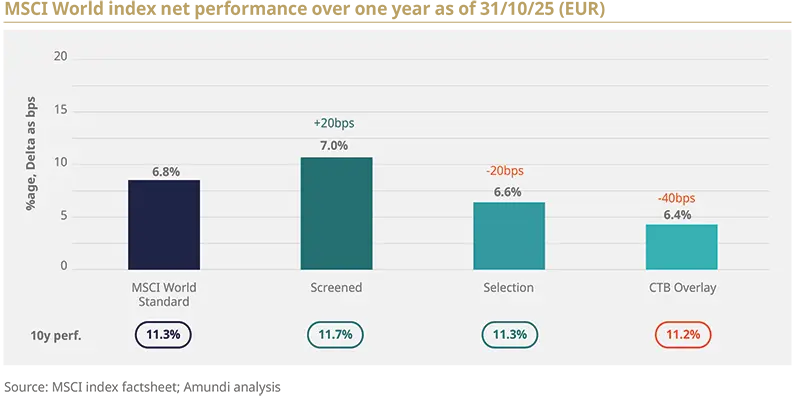
ESG variants of MSCI World index remained close to their parent benchmarks, with a slight edge over 10 years3. At regional level, Europe observed slight underperformance explained by sector tilts as exposure to defence has been a material performance driver.Adaptation and resilience are becoming core to corporate strategy
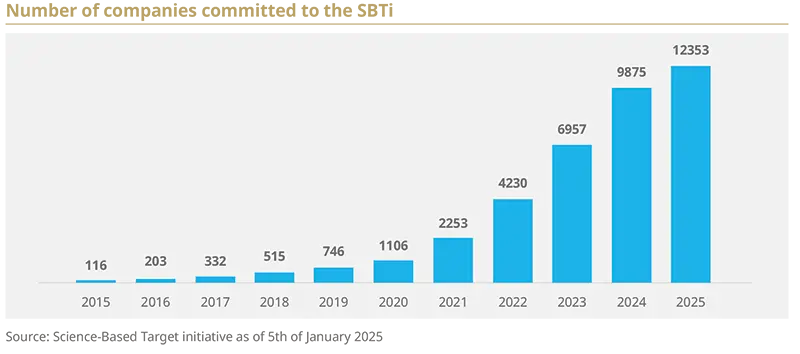
Physical risk is now observable in operating metrics: 57% of companies report that climate events have affected operations in the past year4. On corporate climate engagement, commitments to SBTi rose +25% YoY5, while adaptation spending surged.Regulatory simplification is improving implementation and use
The policy agenda shifted from expanding disclosure to simplifying it, clarifying what is decision-useful vs. compliance-heavy, but the real test is end-investor impact. Meanwhile, ESG data providers consolidated offerings, focusing on aggregated, decision-useful metrics.
2026 shift: Responsible investing in the age of strategic autonomy and resilience
The clean energy bottleneck has shifted from capacity additions to system integration
Global electricity demand is accelerating, IEA expects 4% growth through 2027, adding 3,500 TWh, with >90% of this growth coming from renewables6. The carbon intensity of listed companies fell by roughly 8% year-on-year globally7, leaving the inflection point for peak energy related emissions uncertain.
As renewables are increasingly cost-competitive, the binding constraint is now grids, flexibility, storage and faster connection that need to be facilitated by policies (permitting, connection queues, market rules). For investors, end user affordability is an increasingly material factor to monitor, since integration failures or regulatory delays can raise bills and slow adoption.Strategic-autonomy efforts are fragmenting the energy landscape into diverging “electrostate vs petrostate” dynamics
Governments are reshoring critical supply chains, from clean-tech and critical minerals to parts of the fossil value chain, to boost resilience. Europe prioritizes speed: rapidly expand grids, flexibility and domestic clean-tech or face higher costs and lower autonomy. The US uses incentives and localisation but sends mixed signals: load growth from AI and electrification drives capacity needs, while volatile gas/LNG markets and export-driven infrastructure risk price pressure and lock in. Asia, led by China, already dominates clean-tech manufacturing; for many Asian countries the case for a sustainable energy transition is clear and offers climate resilience, energy independence and economic opportunity.Climate adaptation is now a tangible imperative for investors, on an equal footing with transition
Investors are prioritising adaptation as climate impacts mount, and 60% of corporates expect significant financial impacts from physical risks in the next five years8. To better manage risks while pursuing decarbonization goals, investors must embed climate-risk analysis, including supply chain exposures, into due diligence and asset allocation, and prioritise development of localized, asset level, tail risk adaptation metrics, which are still underdeveloped.Natural capital is moving mainstream in responsible investment markets, for good reasons
Global nature finance totals $200bn annually but must triple by 2030. Private capital, currently just 18% of flows, is critical to scaling investment9. The most direct path for investors lies in real assets like forests, farmland, and water rights, which deliver returns through sustainable use (carbon credits, timber, agriculture) and are increasingly integrated into advanced portfolios. To accelerate growth, financial instruments like green bonds, debt-for-nature swaps, and impact bonds can channel additional capital into these assets. Both channels can offer compelling risk-adjusted returns with impact.AI is redefining responsible investing, from data to labour markets
AI is improving sustainability analysis, speeding data ingestion and adding new qualitative insights, but also risks widening social gaps and workforce disruption, especially in ageing exposed sectors. Opportunities are likely to be found in integrated health/care platforms, robotics/automation for labour scarce services, and age inclusive digital infrastructure. 2026 will also crystallize AI regulatory fault lines, such as ethics and regional divergence, forcing investors to shift capital toward socially and economically useful use cases.2026: A window to align responsible investment products with investor demand and preferences
Strong stated retail demand, particularly from younger investors, is being held back by advisory frictions, unclear product labels and complex disclosure. In Europe, 2026 could be a turning point: SFDR 2.0 combined with technical alignment of MiFID II and IDD can simplify labels and lower advisory complexity to unlock retail participation, provided product categorisations deliver a genuine product–market fit.
Responsible investment dynamics in 2025
1. A year in review: flows, investor trends and performance
Responsible investment open ended funds flows: a continued normalisation in 2025
Responsible investment (RI) flows continued to normalise in 2025 after years of rapid integration, Europe remained the dominant driver, accounting for over 95% of global RI inflows. In Europe, RI open ended funds captured roughly one-fourth of net flows over the first three quarters of 2025. The strategy mix was marked with passive inflows led by non RI products, while active inflows leaned towards RI products, accounting for about two thirds of active flows.
While more selective RI strategies have experienced outflows in Europe, the overall responsible investment fund market continued to grow, with €108bn inflows in the first three quarters of 202510. Amongst all asset classes, fixed income has led net inflows through the period, with share of responsible investment in fixed income in Europe accounting for 63% of total AuM as of Q3 2025, displaying strong penetration11.
In contrast, equities observed outflows in Europe over the same period, notably on passive, while non-RI passive equity flows performed well over the three quarters of 2025. There is a shift from restrictive passive screens towards broader exposure, with stronger appetite for low tracking error strategies in responsible investment equities.
Regionally, institutional demand for responsible investment has remained strong in Europe and Asia. Asia also observed an increased interest for transition finance: the number of investors committed to increasing investments in climate solutions of transition finance assets has grown from 12% in 2023 to 34% in 202412, and according to the AIGCC this trend is expected to continue.
Stewardship in focus as coalitions reset
The political landscape has shifted sharply since US State attorneys general targeted climate-related initiatives, triggering the collapse of the Net Zero Insurance Alliance in 2024, the Net Zero Banking Alliance (NZBA) in 2025, and the pause of the Net Zero Asset Managers (NZAM) expected until January 2026.
Meanwhile, asset owners have maintained their stance on sustainability, not only across Europe but also in the US. 18 UK asset owners, representing roughly £675bn, have sharpened expectations and imposed consequences where manager voting diverges from policy13. In a similar vein, a UK pension fund reallocated approximately £28bn from one manager to firms better aligned with its stewardship principles. Similarly, a Dutch pension fund terminated a €14bn mandate due to sustained voting misalignment. There has also been movement in the US where New York City’s pension funds, representing roughly $300bn, warned managers they could be dropped for failing climate stewardship standards14.
By contrast with other alliances, the Net Zero Asset Owner Alliance (NZAOA) has remained largely unaffected by defection or restructuring. Its members have decreased their financed emissions by a further 6% since last year, in line with 1.5°C pathways. The alliance plans to expand its membership further to target emerging markets, creating an observer category which "might make it easier for asset owners in emerging markets to join", declared Udo Riese, co-lead of NZAOA monitoring.
This shift matters for flows and for how RI is implemented: asset owners are increasingly recognizing the value of structured engagement with clear objectives, improved transparency and approaches that link stewardship efforts to the investment case.
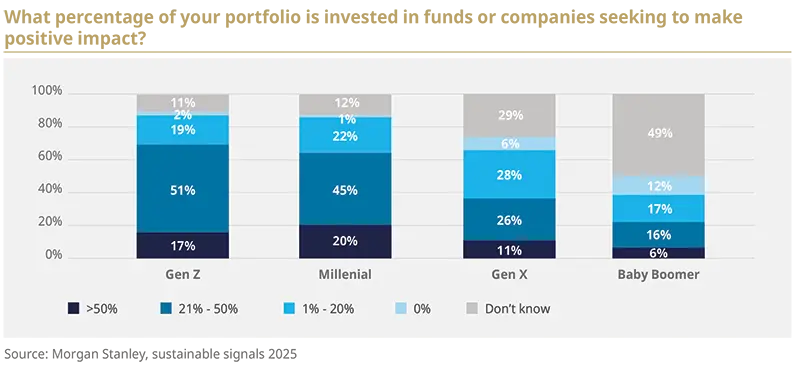
Responsible investment gaining momentum among younger investors
Retail demand for RI is resilient, driven by younger cohorts. A 2025 survey from Morgan Stanley shows that Gen Z and Millennials are more interested in sustainable investing and allocate a larger share of portfolios to positive impact strategies15.
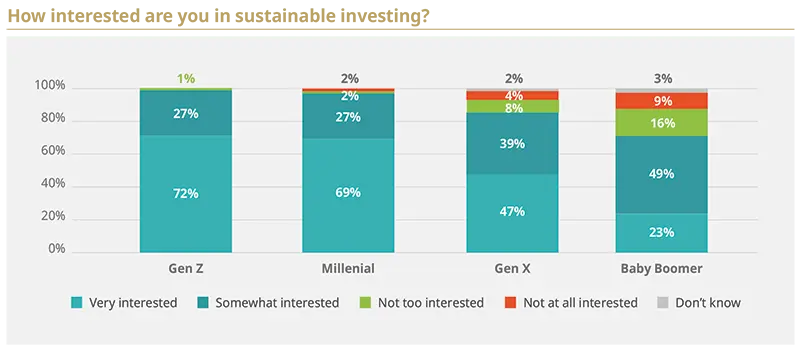
The same research highlights three barriers that can be directly addressed by financial institutions: unclear definitions of sustainable investing (60%), limited knowledge on how to get started (56%) and lack of financial advice (51%). Gen Z and Millennials increasingly reported on these barriers compared to older populations.
With wealth progressively transferring to younger generations, investor education becomes a strategic growth lever. In the US alone, a Cerulli report16 estimates that $124tn in assets is projected to change hands by 2048, with $46tn for Millennials and $15tn for Gen Z.
Climate strategies aligned with parent index, with outperformance in clean energy and clean tech
Over the last year to 31 December 2025, broad ESG equity indices have moved largely in line with the market and, over a ten-year horizon, have tended to edge the MSCI World parent. MSCI World was up 6.8% over the period, with mainstream ESG variants close to or slightly ahead to parent index.
The stronger story in 2025 was the outperformance of clean energy and cleantech indices, where returns were driven across industries and not just by a single name. These index performed at 20-40% range vs. last year as of October as illustrated with the 3 examples below.
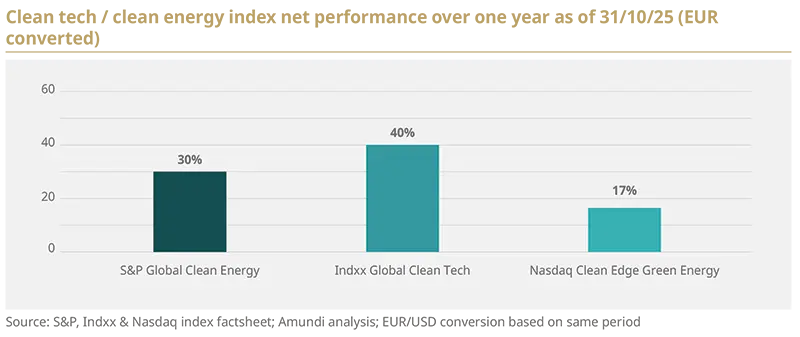
Utility scale solar remained resilient, investment in grids and storage increased, and parts of the electric vehicles (EVs) and battery chain stabilised. At stock level, in euro, Bloom Energy (around 3.5x)17, First Solar (about +26%)18, and Iberdrola (about +36%)19 stood out, highlighting strength across modules, distributed fuel cells, and renewables and networks. However, this annual performance is to be tempered with the weaker ones from previous years, with annualised 5 years performance of -5% and -4% for S&P and Nasdaq indexes respectively.
2. Impact & development finance: positive signals towards acceleration
Macro-economic context is impacting financial flows origins and destinations
2025 is a year of compounding crises as economics, politics and geopolitics amplify the ongoing climate crisis. Domestic prioritisation in advanced economies threatens multilateral collaboration, with global platforms proceeding with tighter budget envelopes. This “my country first” approach is becoming a broader phenomenon, as the persistence of poverty worldwide, the relative increase in inequality, and social stagnation have pushed voters in many advanced economies to shift away from international cooperation.
Furthermore, LMIC20’s debt burden is a direct challenge to a sustainable economic development. The fiscal strain, augmented by tighter aid budgets, also hinders climate adaptation and the implementation of the SDGs. Overall, capital is either insufficient or does not reach the country’s most in need, and when it does, hard currency debt and high hedging costs often make financing unaffordable.
Impact finance is accelerating, moving from niche to scale
Impact finance is gaining traction among investors, who are increasingly participating in transactions focused on underserved markets and a commitment to achieving the SDGs21. In 2024, the GIIN22 estimated impact investment market at $1.6tn in assets under management, a 21% p.a. increase since 2019. Impact investors bring experience with underserved and marginalized population, and innovative approaches to financing such as revenue sharing and pay-for-results models23. Impact investors typically deploy more flexible, often patient capital into underserved segments such as financial inclusion, healthcare, agriculture and community-level resilience, areas where the intentionality, additionality and measurability of social and environmental outcomes are central to the investment thesis.
With this trend, investors can expect more emphasis on additionality of outcomes in new deals, and a shift towards climate adaptation and transition within impact mandates. Strengthening measurement and target-setting, should improve comparability and credibility, while GIIN signals resilient institutional interest and tighter impact performance practices.
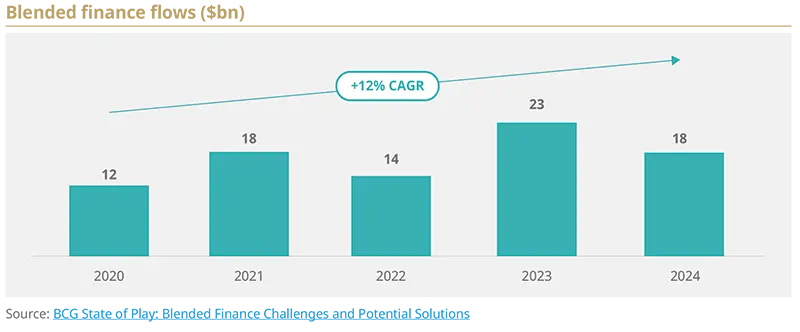
Blended finance is maturing but needs further mobilisation and scaling
Within impact, blended finance also continued to grow with flows reaching $18bn in 2024, 8% CAGR increased compared to 2020, but the key evolution has been an increase in the size of deals from $38m average in ‘20-‘22 to $65m in ’24. Amundi already sees and participate24 in work done towards increasing transparency and standardisation25, as well as more sophisticated risk-mitigation and structuring of funds, such as first-loss capital, guarantees and foreign exchange risk instruments.
We anticipate the growth of country platforms26, whose objective is to align investments with national priorities, streamlining pipeline development and enhancing local ownership of projects. This work on project preparation will rise deals’ scale and size thanks to better mobilisation ratio of private finance from public sources.
Greater standardisation of blended finance structures will be essential for achieving scale, moving the market beyond bespoke transactions towards more replicable and investable frameworks. The Compromiso de Sevilla27 reinforces this shift, emphasising the importance of credit-enhancement tools, particularly guarantees, which accounted for nearly half of concessional instruments in 202428.
3. Corporate trends and dynamics
Beyond pledges, delivery tightened in 2025
Corporate delivery on climate targets stayed on track in 2025, with plans and outcomes increasingly measurable. According to EY’s 2025 Global Climate Action Barometer29, 91% of companies have set emissions reduction targets and 98% have adopted decarbonization levers in at least one scope, 78% across all three scopes.
Market level indicators also moved up: companies committing to the Science Based Targets initiative (SBTi) have risen by about 25% since 2024, covering around 60% of MSCI World’s listed market capitalisation, while the carbon intensity listed companies fell by roughly 3% year-on-year globally30, driven by increasing corporate actions and investment towards resilience.
Adaptation and resilience are now core to corporate strategy
Sustainability risks moved from disclosure pressure to planning and budgets. In a survey carried out by Morgan Stanley, more than half of the companies reported operational impacts from climate events in the past 12 months, up to 73% in Asia-Pacific. This materialisation of physical risks is driving a shift of focus for companies, in the same survey 88% of them said sustainability was a value creation opportunity for their business31.
Adaptation spendings split between new projects and risk reduction, reflecting a year when many firms faced climate related operational disruptions and expect more ahead.
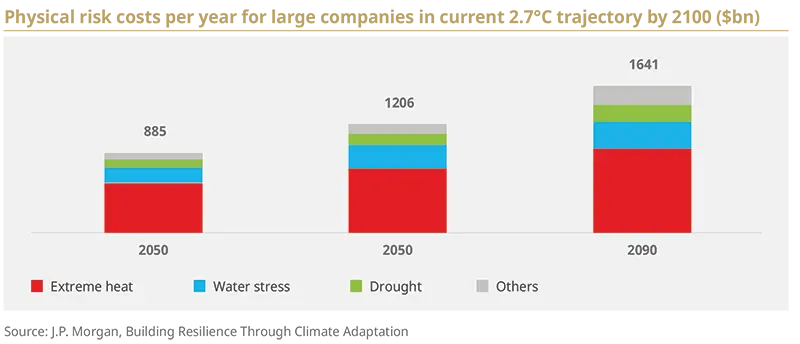
The finance lens is also shifting towards adaptation. Studies summarised by JP Morgan32 indicate climate adaptation and resilience spending can return between $2 and $43 per $1 invested, depending on sector and measure. Without action, potential annual physical risk costs for large listed companies could reach $1.2tn by 205033.
A tangible signal that action mattered came in March 2025, when Moody’s upgraded PG&E34 and its utility subsidiary, citing improved wildfire risk mitigation among the factors. Quantifying adaptation and resilience-related risks and opportunities will be a key driver of corporate decision-making.
AI shifted from pilots to productivity and resource efficiency
The year also marked a pivot from experimentation to deployment in the use of AI. Companies reported gains where AI reduced analysis time, automated core processes and improved energy efficiency.
In utilities, AI and machine learning use in energy systems can enhance energy efficiency, unlocking up to 175 GW of additional transmission capacity in existing lines35. By helping detect faults, load forecasting, and predictive maintenance AI can potentially reduce outage durations by 30-50%36. In healthcare, early drug discovery and trial design applications progressed from proofs of concept to workflows, with first AI-designed drugs reaching human clinical trials37.
However, AI advancements have increased pressure on electricity demand. The exponential growth in AI and associated data centres buildout is pressuring global electricity demand. Electricity demand linked to data centres is set to triple globally to 1,300TWh in the next 10 year, which means up to 300Mt CO2 emission by 2035. It also directly impacts consumers, residential bills in the U.S. witnessed a 3.6% YoY growth in Q3 202538. But there is a silver lining, according to Bank of America, effectively scaling AI applications could save up to 1,500MtCO2 globally (e.g., energy savings in HVAC systems or reductions in global commercial shipping), more than offsetting the expected emissions from data centres39.
AI is lifting productivity across the economy, opening opportunities in core and adjacent sectors and creating new pockets where capital can earn resilient, measurable returns.
Case study: Impact of corporate trends on equity play Reshoring, adaptation, electrification and AI are shifting where capital earns the best risk adjusted returns with measurable impact. We lean into three areas: Industrials: We back enablers of electrification and efficiency, and the shift from owning to renting heavy equipment, improving utilisation, supporting circularity and lowering lifecycle emissions Utilities: As power demand rises with data centres and electrification, prefer regulated networks with clear return-on-equity and capex visibility. Rising prices and load growth make grid modernization and storage investment unavoidable Financials: We look at banks with strong balance sheets that are financing strategic-autonomy projects and insurers that are rewarding physical-risk mitigation with better pricing, de-risking the transition
“We invest where adaptation and electrification translate into regulated cash flows and measurable impact, and where AI improves operations. The goal is simple: resilient earnings, lower emissions, and clear pathways to value” Peter O’Donoghue, Global Sustainable Equity Portfolio Manager |
4. Key trends of the 2025 proxy voting season
Board governance structures is taking AI into account
In 2025, AI transitioned from an emerging boardroom discussion to a core governance priority. Companies increasingly list AI experience among director qualifications, and some boards have delegated AI oversight to committees. The proxy season saw more AI-related shareholder proposals, with emphasis moving from transparency to governance. That scrutiny drove more detailed board disclosures, more nominations of directors with AI or cyber expertise, and greater use of external advisors to assess technical and ethical AI risks.
US rules and litigation are reconfiguring sustainabilityrelated activism and stewardship practices
Overall, the backlash towards environmental and social considerations accelerated in 2025 in the US. The Securities and Exchange Commission (SEC) 13G guidance broadened the definition of what is considered shareholder activism. Many large institutional investors adopted a more cautious, structured engagement stance because of uncertainty about reporting obligations tied to ESG. Companies filed more SEC no-action requests to exclude shareholder proposals, approved at higher rates than before. This reshaped proponents’ tactics and reduced support on some ESG items.
Recent Delaware judicial decisions increased perceived litigation risk and unpredictability for corporations. States such as Texas and Nevada prompted some corporations to reconsider Delaware incorporation, contributing to an uptick in reincorporation proposals and several high- profile votes passed in 2025. These shifts matter for investor rights and litigation forums, and they are increasingly reflected in proxy agendas.
A Texas law targeted proxy advisers, declaring recommendations that consider ESG goals not provided solely in shareholders’ financial interests. ISS removed diversity from its benchmark criteria, and Glass Lewis retained ESG factors with contextual notes and announced a move to client specific advice by 2027. ESG filings and voter support fell, especially for environmental and social proposals, and several US institutions de-emphasized DEI/ESG, widening regional divergence with Europe and Asia.
Remuneration discipline is back on the agenda across major European markets
In the UK, many FTSE firms with significant US activity adopted hybrid long-term incentive plans (adding time-based or restricted-share elements) to remain competitive. After the bankers’ bonus cap was lifted, four major UK banks cut fixed pay and increased variable compensation, lifting overall pay significantly. The delisting trend continued, with 70 companies leaving the main market in 2025.
Across continental Europe, shareholder pushback centred on outsized remuneration increases, discretionary vesting and large termination packages. About two-thirds of companies raised fixed pay over the last two proxy seasons, and many banks reviewed CEO fixed pay. Director elections generally passed, though opposition was concentrated in a small subset of firms with Belgium and France as hotspots, and Italy’s season was shaped by banking consolidation.
5. Overview of the latest global regulatory developments
Sustainability regulation is recalibrating: divergence, refinement and interoperability risks
In today’s rapidly evolving sustainability-related regulatory landscape, the global asset management industry stands at a pivotal crossroads. This year there was a complex mosaic of drawbacks, hesitation, and acceleration across the different pillars of sustainable finance, such as Corporate Reporting, Taxonomy, Green Bond Frameworks, and Fund Labelling.
Overall, regulators are moving carefully, in an effort to balance ambition and feasibility.
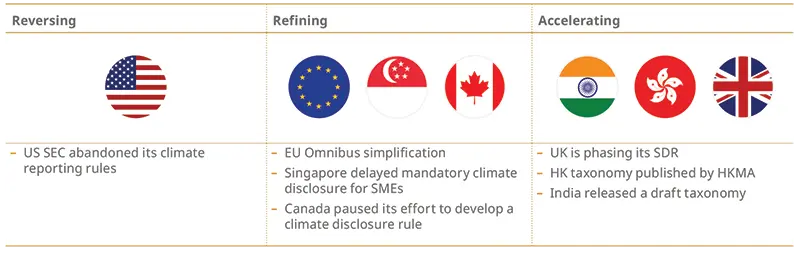
While the US is experiencing setbacks by abandoning rules and anti-greenwashing fund disclosures at the federal level, the local reality is more nuanced. In August, California has refused to halt progress made on climate disclosures laws, with other States (New York, Illinois, New Jersey, Washington) considering similar moves40.
Canada41 and Singapore42 have refined or delayed elements of mandatory corporate disclosures to give companies time to adapt, reflecting local capacity constraints.
The EU has pursued simplification through the EU Omnibus directive simplifying taxonomy and corporate disclosures.
The UK sits in a dual position: while it advances regarding sustainability fund labelling with the development of the Sustainable Disclosure Regulation (SDR), the country has experienced setbacks on taxonomy, while confirmed it will not proceed with a green taxonomy proposal43.
In this fragmented context, the main challenge will be achieving interoperability.
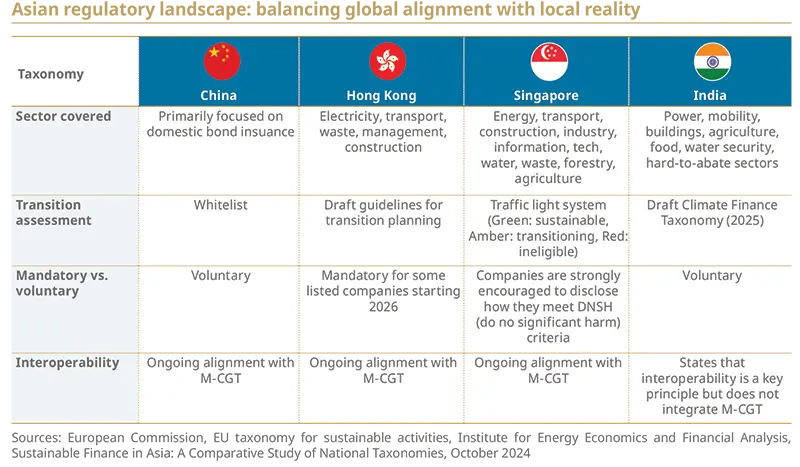
Asia’s pragmatic ESG regulation progress driving interoperability in the region
Asian taxonomies are evolving from simple classification towards tools that guide investment and financial flows, with diverse approaches designed to balance international standards with national development priorities. They emphasize credible transition pathways and accommodate different levels of readiness: Singapore “traffic light-taxonomy” is an example that accommodates transition categories while seeking to curb greenwashing.
Moreover, interoperability is materialising in parts of Asia, in an effort to harmonize legislation, reducing operational costs through higher comparability. As examples, the Multi-Jurisdiction Common Ground Taxonomy (M-CGT) under the International Platform on Sustainable Finance (IPSF) and the Singapore-Asia taxonomy aim at walking towards a standardizations between jurisdictions, though progress remains to be made with respects.
On corporate reporting, the approach is ambitious but flexible. Many jurisdictions are moving from voluntary to mandatory disclosures with phased rollouts that prioritise larger issuers and reflect local specificities. India’s Business Responsibility and Sustainability Report (BRSR) became mandatory for listed companies in 2023, following Hong Kong (2023), Singapore (2022) and China (2022).
6. Rationalizing ESG data
Towards aggregated indicators for better integration in investment management
After years of multiplying ESG data points, the responsible investment sector is entering a phase of rationalisation. In 2024, the ESG data landscape reached a first stage of maturity. Major data providers have consolidated their offerings around regulatory and climate metrics, while only marginally expanding into new topics. This consolidation responds to the growing demand for aggregated indicators, capable of synthesising the complexity of ESG data and facilitating their integration into investment processes (for example, MSCI Energy Transition Assessment).
In 2025, Amundi illustrated this evolution with the development of proprietary aggregated transition assessment tools, which identify companies delivering on their ambitious carbon reduction objectives or investing significantly in green activities. By integrating both ESG and financial dimensions, this provides a clearer and more actionable view of extra-financial risks and opportunities.
Furthermore, the rise of climate stress tests and scenario analyses, with increased scrutiny on this topic from external stakeholders this year, demonstrates the drive to produce unified and usable signals. This rationalisation is essential to address the growing complexity of regulatory requirements, while making responsible investment more accessible and understandable for end investors.
Social indicators move from disclosure to decision-making tools
With environmental indicators historically taking the front seat in sustainable finance, social considerations are increasingly recognised as financially material through workforce stability, safety, product responsibility and community license to operate. EU regulation has accelerated this shift: the Sustainable Finance Disclosure Regulation (SFDR) embeds social Principal Adverse Impacts, the Corporate Sustainability Reporting Directive (CSRD) with ESRS S1–S4 requires granular reporting on own workforce, value chain workers, affected communities and consumers, and the Corporate Sustainability Due Diligence Directive (CSDDD) sets expectations for human rights due diligence across supply chains.
To make social factors useful for decision making, investors and companies are converging on tangible metrics. Examples include:
Workforce: lost time injury frequency rate, median gender pay gap, share of employees on a living wage, training hours and completion, retention in critical roles;
Value chain and rights: supplier audits and corrective actions closed, active grievance cases and remedy times, zero tolerance breaches;
Communities and customers: affordable access metrics, complaint resolution time, disconnections prevented, tenant or customer satisfaction.
Private markets help translate these indicators into operating practice:
In private equity, board-level dialogue and co constructed social plans with annual oversight are increasingly systematic, with measurable commitments on value sharing, workforce development and inclusive governance.
In private debt, sustainability-linked loans increasingly embed social KPIs with step-up and step-down mechanics and independent verification.
In real estate, site-level stakeholder programmes, including supported employment pathways, can deliver local inclusion outcomes; thematic strategies in health, ageing and care provide indirect but meaningful social benefits. Credibility depends on robust data governance, clear baselines and targets, and independent assurance where appropriate.
Case study: Amundi Alternative & Real Assets (ARA) social impact Private assets give Amundi Alternative & Real Assets (ARA) a direct access to portfolio companies and physical assets, enabling deeper engagement on social issues. This proximity allows for a shift beyond disclosure towards concrete, operational changes: monitoring working conditions and labour relations, promoting fair value sharing, strengthening health & safety, protecting human rights, fostering community engagement, and ensuring responsible products and client practices. Dedicated social KPIs, such as gender pay equity or workplace health & safety, are integrated to sharpen focus and increase accountability across financings. ARA’s impact investing strategy illustrates this approach: in the last decade, ARA’s investments have supported the creation or preservation of 85,000 jobs, housing for nearly 24,000 people, training or support for some 330,000 beneficiaries, and microcredit access for more than 636,000 individuals. By combining proximity, tailored engagement, and measurable targets, this model advances private markets where social impact becomes a core driver of sustainable value creation, alongside environmental considerations. Sandrine Lafon-Ceyral, Head of Responsible Investment, Amundi Alternative and Reals Assets |
The 2026 shift: Responsible investing in the age of strategic autonomy and resilience
1. Resilient energy systems and clean technologies development in the race to strategic autonomy
Demand shock and system integration for energy security
Electric vehicles (EVs) and renewables increasingly shape the demand curves for fuels and electricity. In the past, the pace of cost decline for renewables, especially for solar PV and batteries, has repeatedly exceeded forecast44, accelerating deployment and altering oil and gas demand trajectories.45 Combined with stronger EV uptake across several emerging markets46 and the flexibility unlocked from aggregating EVs into Virtual Power Plants with bi-directional Vehicle-to-Grid (V2G) charging, these factors can materially accelerate the integration of renewables. Nevertheless, hard to electrify sectors, such as aviation and petrochemicals will continue to sustain demand for liquid fuels, making a complete oil phase-down unlikely in the near to medium term.
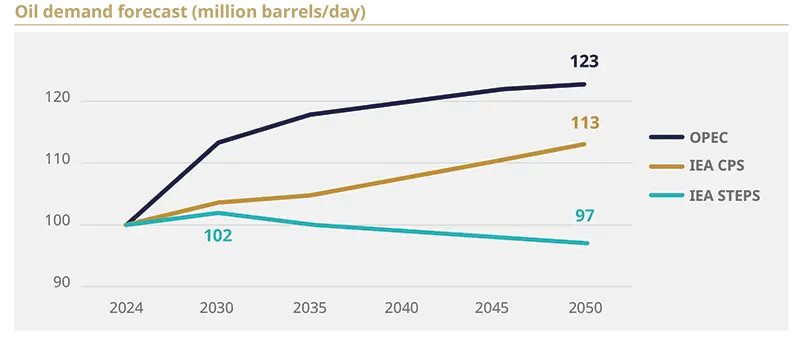
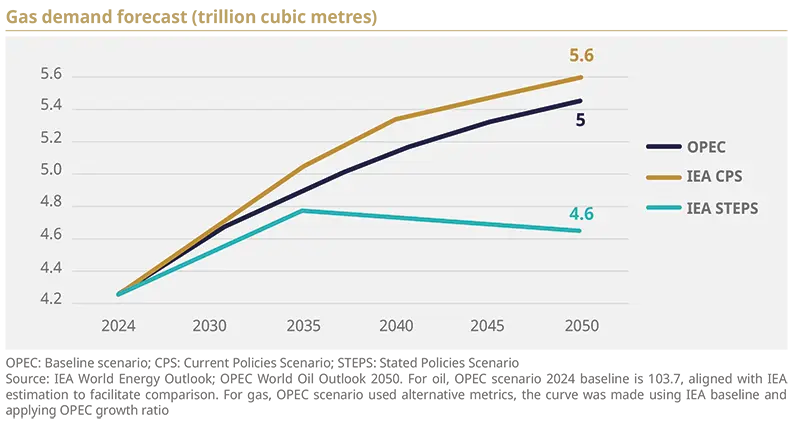
For oil demand, the slope of decline depends on the speed of EVs adoption and the drivetrain mix in road transport, while petrochemicals and aviation set the floor. The evolution of gas demand is dependent on renewables’ uptake, but the slope of the curve hinges less on renewables generation cost and more on integration capacity, meaning how quickly grids, flexibility and storage are deployed to absorb renewables, alongside electrification in buildings and industry, and the configuration of Liquefied Natural Gas (LNG) supply and trade flows.
While the IEA Stated Policies Scenario (STEPS), which relies on policies already announced in Nationally Determined Contributions (NDCs), points to declining demand, the charts below show that the two alternative scenarios, IEA Current Policies Scenario (CPS) and OPEC baselines scenario are more pessimistic, projecting an increase in oil and gas demand.
EVs and AI lift electricity demand, grid systems remain the bottleneck
As the centre of gravity is moving decisively to electricity, AI data centres and EVs charging materially increase short-term demand, accounting respectively for 10%47 and 7%48 of additional electricity incremental demand of 3.5kTWh49 needed by 2027 vs. 2024. To keep costs and emissions in check, most of that incremental demand must be met by renewables, with IEA estimating that more than 90% of global electricity demand growth will come from renewables50. The binding constraint is not the levelised cost of energy, which has fallen sharply for solar PV and onshore wind (-38% and -30% respectively over 2019-2024)51, but integration. Building grid-integrated charging hubs and digitalised grids, utility scale and long duration storage, and demand side flexibility (smart charging, variable tariffs, vehicle to grid), will be required to absorb variable generation at scale.
Renewables’ share of electricity is on track to approach around half by the mid-2030s, and investment continues, with clean energy at around $2tn in 2024, grids near $400bn, and storage set to exceed $50bn. Bottlenecks persist, including multiyear transmission permitting, distribution networks lagging rooftop solar and heat pumps, and under compensated flexibility markets.
EVs development: batteries shift from “if” to “how fast”
Over the past year, the battery narrative has shifted from “if” to “how fast”. Sodium-ion has moved decisively out of lab benches and pilot plants into the industrial conversation: major manufacturers, notably CATL and BYD, have announced product lines and plans to begin mass production52. Although the cost advantage of sodium-ion over lithium-ion seen in previous years has narrowed due to rapidly falling lithium-ion raw material costs, some manufacturers expect sodium-ion cell costs to further drop to about $40/kWh53 if scale and conversion of existing lines proceed as planned.
Lithium-ion pack prices have also continued to fall, with BloombergNEF’s recent series showing pack cost averages declining in 2025 after a roughly 20% fall in 202454. This narrows short-term arbitrage and has cooled some expectations for sodium-ion. Despite that, the nascent chemistry still offers structural upsides, not least greater thermal stability, which is a key safety consideration for short-duration grid storage and on-site back-up.
Global passenger EVs reached roughly one-fourth of total EVs sales in 2025, with buses and two- and three-wheelers above 40%55. Battery pack prices fell about 20% from 2023 to 2024 to $115/kWh globally and under $100/kWh in China56. Momentum is strongest in China, the next step is to mainstream global adoption and integration with adequate charging networks and grid infrastructure.
Storage demand and deployment: curtailment, enterprise loads and the policy constraint
Two demand forces make storage a live investment theme. First, rapid additions of wind and solar are already increasing curtailment in a number of systems. The IEA and system operators flag that there is rising “spilled” renewable energy, which creates a measurable opportunity for batteries that shift energy and provide fast reserves. Second, enterprise loads are growing fast. Data-centre and AI compute demand is accelerating on-site resilience requirements and interest in battery back-up and co-located storage services57. Where batteries are paired with renewables or used to avoid peaker- plant dispatch, levelised system costs often match gas peakers.
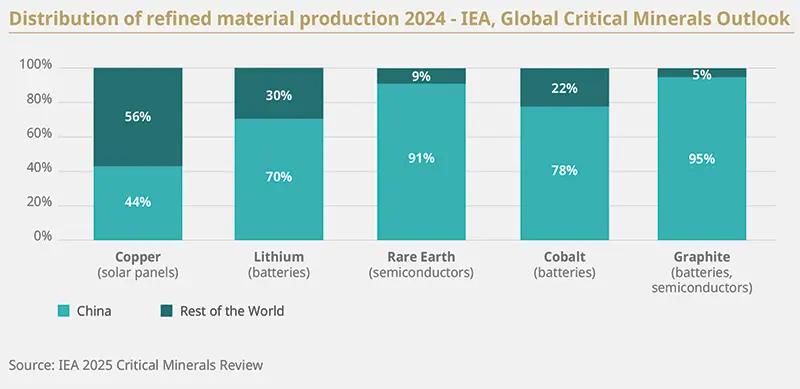
The main constraints increasingly look less technological and more institutional58. Lengthy grid- connection queues, protracted permitting processes and wholesale market rules that undervalue fast and flexible capacity all slow deployment. Political trade-offs between visible infrastructure build- out and short-term price sensitivities mean policy support differs materially by jurisdiction. Supply chain risk also matters: the IEA’s Critical Minerals Outlook59 shows that processing and refining remain highly concentrated even for ostensibly abundant materials, so investors should not assume alternatives like sodium-ion are free of geopolitical and concentration risks.
In the near term, the opportunity is a blend of a technology and policy arbitrage. Practical focus areas for investors are:
stress test assumptions against both faster lithium-ion pack price declines and a successful sodium-ion scale up
evaluate portfolio companies on credible supply-chain mapping, diversification and time-bound scaling milestones and
monitor selective pilots and offtake structures that accelerate commercial learning without taking broad technology risk.
If sodium-ion hits its cost promise at scale, short-duration storage economics could be reshaped. Until then, the opportunity is real but conditional. Technology progress needs to be matched by permitting reform, market designs that reward flexibility, and strengthened supply-chain resilience.
LNG and pipelines shape regional challenges
Liquefied Natural Gas (LNG) adds an additional variable to the quest for strategic autonomy. A wave of new liquefaction capacities, front loaded in the United States and Qatar through the mid- 2030s, can boost short-term supply security and export earnings, but it also heightens exposure to volatile global gas markets and price swings. New pipelines, for example Russia–China routes, can reshape supply dynamics for Europe and increase regional reliance.
Where renewables integration and electrification progress quickly, gas demand can plateau or decline post 2035, leaving late cycle LNG assets at risk of underutilisation. Where integration lags or power demand surges without flexibility, LNG can anchor gas use and raise bill volatility. Strategic autonomy, therefore, means not only building domestic clean capacity but also actively managing LNG exposure as electricity demand grows with AI and electrification.
Case study: Investing in transition through core-satellite approach In a context of increased adverse climate impacts, favouring companies that are already committed to a decarbonisation path is not sufficient. It can even be misleading in a downturn, when policy support becomes less certain or when carbon intensity rises, because sales fall. In parallel, capital needs to support the systems change required for a sustainable transition. At Amundi Multi-Asset department, we have developed a core–satellite design to balance performance, liquidity and delivery. The core of the portfolio holds liquid assets aligned with credible decarbonisation pathways. Around this core, we built satellites targeting direct outcomes through instruments such as green and social bonds, clean infrastructure financing and projects linked to SDGs60. This allow us to channel capital where change is taking place, support the decarbonisation of our economy and keep portfolios resilient for our investors. Amélie Derambure & Nicolas Pelletier, Multi-Asset Responsible Balanced Strategies |
2. Building autonomy: how industrial policy is reshaping global energy power
Strategic autonomy is being operationalised through industrial policy and trade instruments that align decarbonisation, competitiveness and security, while managing electrostate versus petrostate dynamics. In a global reshaping of energy power, ‘Electrostates’61 build autonomy through electrified end uses, domestic clean generation, robust grids and flexibility. In contrast, ‘Petrostates’62 rely on hydrocarbons revenues, LNG exports and downstream petrochemicals. Trade policies, local content rules, and tariffs will define costs and dependencies for importers and exporters alike.
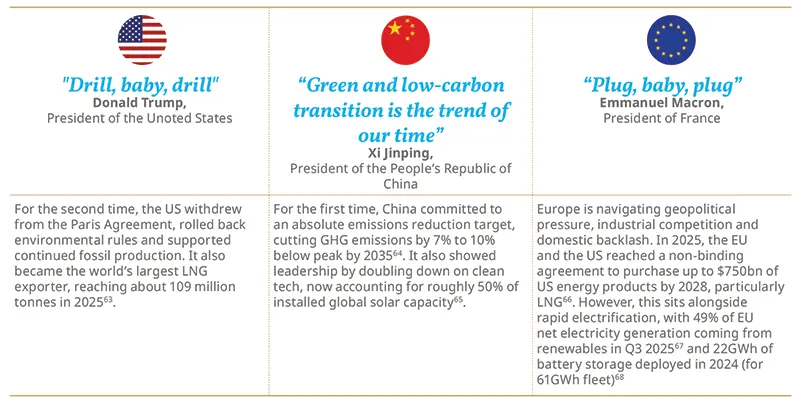
One year into the current US administration, policy signals have introduced friction for global coordination. The White House has indicated a preference for deregulation and greater state level governance, adding to fragmentation risks for sustainable finance. While such roadblocks can slow coordination, they have also reinforced energy security and clean tech innovation tailwinds in Europe and parts of Asia and Latin America.
Europe’s dual energy dependency
Under the Carbon Border Adjustment Mechanism (CBAM), the European Union is adjusting carbon cost equalisation for selected imports, including cement, iron and steel, aluminium, fertilisers, electricity and hydrogen69. The Net Zero Industry Act (NZIA) sets a benchmark for at least 40% of annual EU deployment needs in strategic net zero technologies to be manufactured domestically by 2030, together with Union-wide CO2 storage capacity of 50 MtCO2 per year by 203070. The Critical Raw Materials Act (CRMA) sets 2030 targets of 10% extraction, 40% processing and 15% recycling of strategic raw materials in the EU, and caps dependency at 65% from any single third country at each stage71.
Despite these clean energy policy developments, the EU imported about €15bn of green energy products in 202472, largely from China, and remains reliant on imported hydrocarbons, with the United States now a key supplier of crude oil and LNG. Europe is neither an electrostate nor a petrostate yet, and must manage exposure on both fronts until domestic capacity scales up.
To convert ambition into operational capacity, faster connections, treating storage as a system resource, and optimised interconnector flows are needed. Europe’s regulatory focus in 2025 has been simplification and competitiveness, keeping ultimate objectives while improving execution. CBAM, NZIA, and CRMA must move in lockstep with grid expansion and flexibility solutions rollout (e.g. managed-EVs charging) so localisation can boost resilience without raising costs or delaying deployment.
In this context, the European Commission proposed a "Grids Package" in early December to modernize infrastructure and strengthen the resilience of the energy system, including a plan to quintuple the EU’s funding for infrastructure over the 2028–2034 period73. For investors, value creation is no longer driven solely by energy production but increasingly by networks, storage, digitalization, and the equipment needed to support this scale-up.
US policy supports buildout yet delivery risks remain in renewable queues and LNG exposure
The US is pursuing strategic autonomy through incentives and localisation, but faces mixed signals that investors should recognise. The Inflation Reduction Act provides long dated clean energy tax credits and, since 2025, a domestic content bonus that increases the value of eligible credits by around 10% if projects meet US steel/iron rules and minimum shares of US-made components. Since early 2025, federal review has slowed some guidance and created timeline uncertainty, but the statutory credits and the domestic content bonus remain in force.
At the same time, load growth from AI data centres and electrification is pushing utilities towards capacity additions and grid upgrades, while gas and LNG price volatility and infrastructure decisions can pressure bills in some regions. FERC Order No. 2023 standardised and accelerated interconnection procedures by introducing cluster studies, firm timelines and withdrawal penalties to cut backlogs74. However, US interconnection queues still held more than 2,300 GW of proposed generation and storage capacity at the end of 2024, over 95% from solar, wind and storage as end of 2024, with projects wait times increasing from just over 2 years in 2000-2007 to 5 years for projects built in 202375.
LNG exports strengthen the US petrostate earnings base and support allies’ security, but over building risks lock in and cost pass through if domestic demand plateaus under stronger integration and electrification. The US context is challenging at the federal level, yet clean energy momentum remains robust driven by cost and security reasons. The transition may slow down, but it is unlikely to reverse.
Asia leads clean tech manufacturing and deployment, with China setting the pace
Asia’s role in the global energy transition is critical. As a dynamic manufacturing hub with rapid rise in population and living standards, and strong economic expansion, Greater Asia is now the largest energy producer and importer76. Southeast Asia alone accounts for half of global GHG emissions77, with coal supplying about half the region’s electricity and causing 80% of its power-sector emissions78.
For Asian countries, the case for a sustainable energy transition is clear: climate change threatens the region’s vulnerable biodiversity, economies and populations, while the shift offers greater energy independence and economic opportunity. The IEA warns Southeast Asia’s annual oil and gas import bill could hit $250bn by 205079, underscoring the strategic value of domestic clean energy. Nevertheless, the region is well placed to become a global clean energy manufacturing leader thanks to abundant resources (solar, hydropower and wind), critical raw materials and components production lines.
The electrostate trajectory is particularly grounded in scale, speed and depth in China. China has built manufacturing dominance across solar PV, batteries and EVs, and continues to deploy clean power at pace while expanding grid capacity and electrified end uses. China accounts for around 80%80 of the manufacturing stages of solar panels, produces over three quarters of global batteries, and manufactures more than 70% of EVs81. Alongside manufacturing dominance, China has also strong patent origination in batteries and smart grids, filing three times more clean energy technology patents that rest of the world combined82. This combination strengthens domestic energy security and global clean tech exports.
Case study: Asia equity play The global energy transition is reshaping capital allocation, with copper, EV batteries, nuclear, and grid infrastructure emerging as high-conviction themes in Asian equities. These themes offer risk- adjusted returns with measurable impact, aligning capital with the transition’s most resilient sectors.
Grid investments are surging, $700bn in annual spending are needed by 203086 to meet national energy demands and goals, compared to $470bn spent in 202587. Aging infrastructure in the US/EU and renewables integration require transformers and transmission upgrades, benefiting Korean firms supplying diverse markets. Ji Young Park, Senior Portfolio Manager, Asian Equities |
Execution, standards and affordability will be the key to energy competitiveness and autonomy
In Europe, the timeline and scope of CBAM will set the pace for carbon cost equalisation. Progress on the NZIA manufacturing targets and CRMA permits will show how far clean-tech supply can be localised. The practical test is delivery on grids and flexibility: shorter connection times and storage taking part in system services are the clearest signs that execution is improving.
In the United States, IRA incentives and domestic content benefits continue to support clean-tech build and localisation. Rising electricity demand from data centres and electric vehicles, together with grid congestion and bill pressures, will shape how quickly projects move. LNG final investment decisions will also influence regional exposure and long-term costs.
In Asia, especially China, large scale manufacturing and fast deployment in solar batteries and electric vehicles continue to set the pace. In emerging and developing economies, reducing total financing costs and strengthening power offtake arrangements are central to making strategic autonomy work beyond advanced markets.
Key signals to watch for investors:
Integration sets the pace as grids, storage and EVs charging are connected and managed as part of one network.
Autonomy adds resilience only when delivery plans both expand capacity and shorten connection times.
Diversifying components and subsystems, not just raw materials, reduces single-point supply chain bottlenecks.
Common standards and interoperable, digitalised grids lower system costs and improve utilisation.
LNG reliance declines only if renewables and electrification scale fast enough.
Insights from our research experts: Minerals supply in the age of electricity Why electrification puts mining and metals in focus Concentration and policy development will drive pricing China dominates many refining and active material steps and capacity additions in other regions will not remove the concentration risks by 2030. In such a system, export controls, permitting shifts or sanctions at a small number of hubs can trigger outsized supply shocks. Projects that assume unconstrained access to refined intermediates face execution risk if a major processor cuts or restricts exports. Price cycles add another risk, as projects need high upfront spending and take years to build, so if prices fall by the time production starts, margins can be squeezed. Value tends to increase where concentration risk is reduced and productivity improves. Building diversified mid-stream capacity, including low-carbon refineries and active material plants backed by clear offtake and multi sourcing, cuts single node exposure. Scaling recycling and second life creates certified secondary material and lowers geopolitical risk and lifecycle emissions. Digitalisation also lifts operations, as AI-assisted targeting, sensor rich plants and digital twins can raise discovery rates, improve yields and reduce downtime in mining and refining. Durable value comes from less concentration and real performance gains. Investors should favour mid stream plants that are commissioned with long term offtake, more recycled content with credible MRV89 and clear Tier 2/3 supply maps, and proven digital productivity. Alternative chemistries lower risk only when refining and precursor steps are diversified and operating at scale.
Case study: How we engage with issuers to limit risks on minerals supply Mineral supply chains are vital for the energy transition but face geopolitical, operational, and price risks. To limit exposure, we engage issuers through five key actions:
This approach limits exposure to supply shocks, enhances resilience, and aligns with long-term sustainability goals. |
3. Climate adaptation and resilience are now government and business imperatives
Clear progress on real economy transition, but far from 1.5°C trajectory
While projections before 2015 suggested warming could reach 4°C, the UN Emissions Gap Report 2025 shows that current policies now point to 2.8°C90, but still way above the 1.5°C objective of the Paris Agreement. Clean energy investment reached $2tn, nearly double the $1.1tn invested in fossil fuels91. Yet, global temperatures temporarily averaged 1.55°C above pre industrial levels in 202492, underscoring that physical thresholds are no longer theoretical. Emissions from the energy sector still increased for the fourth consecutive year, illustrating that renewables are scaling but not replacing fossil fuels fast enough.
Physical risks are now operational, with direct portfolio implications
Climate impacts are materialising through both chronic stresses and acute events, and already affect investment outcomes directly and indirectly. As outlined in our research93, loss and damage to an investee company’s assets raise capex needs, while operational disruptions weigh on margins and sales. Combined, these effects y increase downside risk and volatility across portfolios.
In 2024, global natural disaster losses reached $320bn94, underscoring that physical risks are already translating into material economic and financial impacts. The investment relevance lies in second-order effects: supply chain disruption, higher insurance premia, and longer downtime for critical infrastructure which can reprice risk across sectors and regions.
While vulnerability can be most acute in EMDEs, physical risk is also rising in developed markets, notably for sectors with concentrated exposure such as infrastructure, real assets, utilities, transport and part of industrials.
The EMDE adaptation finance gap and why it matters to all markets
The financing gap is most visible in EMDEs, where needs are largest and risk-absorption capacity is often weaker. UNEP estimates that cost of adaptation finance needed in developing countries is now around $310bn per year by 203595. At the same time, international public adaptation finance flows to developing countries were $26bn in 2023, down from $28bn in 2022, highlighting a persistent gap between needs and tracked flows.
The scale of adaptation investment required in EMDEs spans resilient transport networks and ports, climate-smart agriculture, early-warning systems, nature-based solutions, grid hardening and cooling infrastructure. Evidence on benefits is increasingly documented, though outcomes and timelines vary by sector, asset type and local context. World Resources Institute (WRI) research in 2024 finds that investing $1 in adaptation can yield more than $10.50 in benefits over 10 years96.
But this is not and EMDE-only issue: physical shocks and constrained adaptation capacity transmit through global supply chains, commodities pricing and sovereign risk, affecting portfolios regardless of where assets are domiciled. For investors, adaptation can be both risk management and a source of resilience value.
Integrating physical risks in financial assessment: a new imperative for resilience
2024 broke records as the warmest year ever recorded, and companies are already reporting significant losses due to chronic and acute weather events. Physical impacts have intensified, with climate-related losses now counted in the hundreds of billions of dollars per year and climate finance has grown from roughly $600bn in 2015 to nearly $2tn today, but flows remain highly concentrated in OECD economies and China97. MSCI’s 2025 corporate resilience survey98 shows that over 60% of companies expect significant financial impacts from physical risks within five years, yet fewer than 25% have quantified asset-level exposure.
To better manage risks, investors need to integrate physical climate risks fully into their assessment. The challenge is that adaptation metrics (localised, asset-based, tail-risk oriented) lag far behind the more mature metrics for transition risk (forward- looking, systemic, company-level).
Crucially, new financing structures, especially blended finance, are making it easier for investors to participate. Guarantees, first-loss capital, and resilience-focused funds are reducing project-level risk and improving bankability. In the wake of COP30, MDBs and governments are putting efforts towards country platforms and resilience pipelines designed specifically to crowd in institutional capital. COP30 also marked the operationalisation of the Loss & Damage Fund. These developments lower barriers to entry and allow investors to participate in solutions that were previously seen as too risky or too fragmented.
The call to action for investors is clear: integration and engagement must begin now. Investors should incorporate physical climate-risk assessment into their due diligence, asset allocation, and scenario analysis across their exposures. In addition to assessing companies at the entity level, our research highlights the need for investors to evaluate the impact that physical climate risk pose to entire supply chains. Investors need to assess both the upstream and downstream physical risk exposures of their investee companies as climate hazards can exert a knock-on effect throughout the supply chain which creates volatility in the market and additional downside risk for investors99.
Investment in real assets will play a pivotal role in the transition
Decarbonisation that matters in the real economy needs long financing horizons, operational access and risk sharing. Large renewable builds, industrial abatement pathways, deep energy efficiency retrofits and sustainable real estate renovations are capital intensive and execution heavy. Private markets and real assets provide the bespoke structures and continuous support through project preparation, procurement, construction and operations that turn transition plans into prepared pipelines and delivered assets.
Success will be heavily dependent on strong governance associated with sustainability outcomes, and the rise of outcome linked finance. Board level plans with measurable milestones on energy intensity, renewable sourcing and renovation schedules, reviewed annually, align management incentives and enable corrective action when performance drifts. Sustainability linked loans and similar facilities embed a small set of material KPIs, such as energy use, emissions trajectories or renewable share, with margin mechanics that reward or penalise outcomes.
4. Natural capital preservation as a prerequisite for enhancing portfolios’ resilience
Global nature-based investment reached about $200bn in 2022, up 11% year-on-year, yet this is only around one-third of the $542bn needed per year by 2030 to meet the Kunming-Montréal biodiversity and Paris climate objectives. Private finance accounted for about 18% of total flows100.
Momentum around nature finance is growing, with private finance assets under management rising from $9bn in 2020 to $102bn in 2024, a x11 increase101. The next step is now scale, and several financial vehicles are being developed to answer this need. Announced at COP30, The Tropical Forests Forever Facility (TFFF), a new long-term finance platform to reward countries that keep their tropical forests standing, could become the largest nature-focused financing instrument ever created, targeting $125bn with $25bn from public finance and $100bn from private102.
Several nature-related financial products have emerged
Green and Sustainability Linked Bonds
Global sustainable bond issuance topped $1tn in 2024103, with a rising share dedicated to biodiversity- related objectives. Uruguay’s $1.5bn sovereign SLB links the coupon to forestry and emissions targets104, showing how nature-related KPIs can be embedded into financial returns.
Blue Bonds
Blue bonds channel use-of-proceeds to ocean priorities such as wastewater upgrades, coastal habitat restoration, resilient ports and sustainable fisheries, guided by the Sustainable Blue Economy Finance Principles (UNEP FI, 2019) and ICMA’s 2023 blue finance/blue bond guidebooks.
Debt-for-Nature Swaps
Debt for nature swaps restructure sovereign debt and redirect savings into conservation finance tied to verifiable outcomes. Ecuador’s $1.6bn Galápagos transaction (2023) is expected to generate more than $450m for marine protection105, illustrating how swaps can strengthen biodiversity finance and macro resilience simultaneously.
Nature-related real assets (Nature-based solutions)
Nature based solutions invest in ecosystems to deliver services such as flood protection, soil regeneration, water security and carbon storage. The appeal lies in measurable outputs, for example hectares restored or gains in soil organic carbon, that can be tied to environmental and financial performance.
Impact Outcome Bonds
Outcome bonds channel private capital into social and environmental project delivery, investors are repaid only if independently verified outcomes are achieved. Thus far, over $800m of upfront capital has been mobilised through impact bonds106. The $225m Amazon Reforestation linked bond is the first bond that directly links investors’ financial return to the removal of carbon from the atmosphere, unlike past transactions linking returns to the sale of carbon credits107.
Credible measurement and affordable capital will scale nature finance
Nature related dependencies and impacts are increasingly being factored into responsible investment policies, ESG methodologies and stewardship. The Taskforce on Nature related Financial Disclosures (TNFD) offers a voluntary framework to assess and report nature risk, and more than 300 financial institutions representing over $20tn in assets have signalled intent to adopt TNFD aligned approaches108. Integration can shift capital without creating new vehicles, but data gaps remain significant. Few listed companies disclose robust, comparable biodiversity metrics, limiting the precision of risk assessment and the ability to steer portfolios towards nature positive business models.
Advances in geospatial analytics, satellite monitoring and environmental DNA are improving baselines and verification. Emerging biodiversity credit markets could, over time, help value ecosystem outcomes and attract additional pools of capital. Methodologies and registries are still evolving, so additionality, permanence and social integrity need careful treatment to build trust.
Closing the gap will depend on two sets of enablers. First, measurement credibility: consistent baselines and third party verification that align where possible with ESRS requirements and TNFD, so reported outcomes are comparable and audit ready. Second, bankability and affordability: all-in financing costs and risk-balance can make these kind of projects difficult for investors so structures such as guarantees and first loss tranches, together with local currency and FX risk sharing can facilitate access. With these elements in place, nature finance can scale from niche to material, delivering resilience and long term value alongside environmental gains.
Case study: using geolocation and satellite data to evidence environmental outcomes A major trend in ESG data is the growing use of geolocation and satellite imagery, particularly to create site-level evidence on deforestation, methane leaks, water stress and land-use change across company assets and supply chains. At Amundi, we are actively working with a leading data provider to enable more precise and timely monitoring of environmental impacts, which not only supports regulatory requirements and investor demand for real-world outcomes, but also significantly enhances our engagement activities with companies. By leveraging these innovative data sources, we are better equipped to identify, assess, and discuss environmental risks directly with issuers, fostering more informed and impactful dialogue. Mathieu Jouanneau, Head of Environment Data Solutions |
5. How AI is redefining ESG data landscape, ageing economies, and investment strategy
AI expands ESG data coverage and comparability
By leveraging advanced technologies such as automated data scraping, satellite imagery analysis, and natural language processing, AI enables the collection and processing of vast and previously difficult to access datasets. This increased capacity allows for broader and more granular coverage of companies, supply chains, and even asset-level environmental impacts, addressing longstanding gaps in ESG data availability and comparability.
Moreover, AI is transforming the nature of ESG indicators themselves. Traditionally, ESG analysis has relied heavily on structured, quantitative data points, metrics that are easily standardised and benchmarked. However, many critical ESG issues, particularly in the social and governance domains, are qualitative by nature and have been difficult to integrate into investment processes. AI can process unstructured data from diverse sources, such as news, reports, and social media, enabling the extraction and integration of qualitative insights alongside quantitative metrics. This shift allows for a more nuanced and holistic understanding of ESG risks and opportunities.
From quantitative metrics to integrated qualitative insights and forward looking analysis
In the long-term, these advances could fundamentally redefine ESG integration. Today, responsible investing is largely data point-driven, focusing on backward-looking, standardised metrics. With AI, the future of ESG analysis could move towards more forward-looking, strategy-oriented approaches, where investors can tailor analyses to specific investment strategies and sectoral contexts. This evolution will support the development of more sophisticated, sector-specific, and impact-oriented ESG products, ultimately enhancing the ability of investors to align portfolios with sustainability objectives and real-world outcomes.
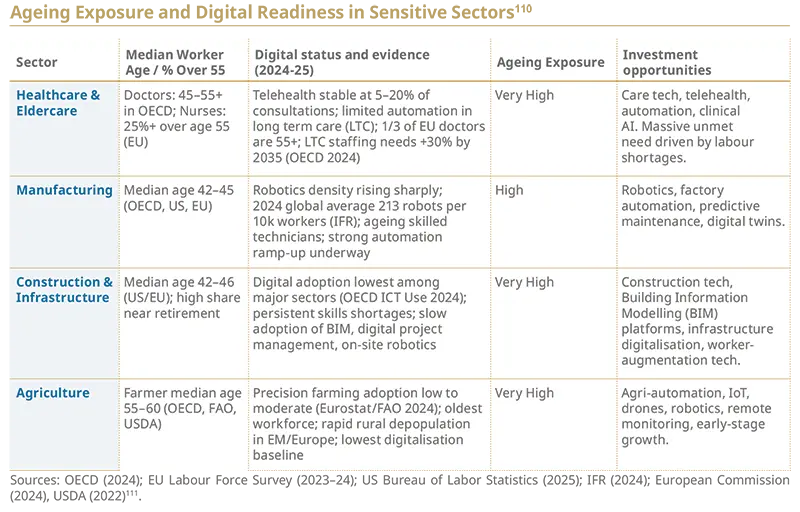
Digital disruption must shift to ageing‑exposed sectors
Digital disruption has so far overwhelmingly flowed towards “young” sectors and business models: e-commerce, digital media, software, payments. These are asset-light, connected and relatively unconstrained by regulation. By contrast, the sectors with the oldest workforces and the most demographic exposure remain only partly digitized: health, public administration, construction, transport, utilities and much of manufacturing and agriculture109.
2026 is therefore less a turning point than a vantage point: in ageing societies, AI used for care and public administration is being governed like critical infrastructure, and the misalignment between where technology is deployed and where demographic pressure is highest becomes harder to ignore.
Regulation, capital intensity, safety requirements and skills gaps are slowing adoption. From a 2026 perspective, the key question is whether capital keeps targeting incremental gains in already- efficient domains, or starts to lift productivity and resilience where demographic risk is structurally highest.
Insights from our research experts: AI and its impact on Responsible Investment Regulation will shape AI’s role in highly exposed sectors in 2026 From 2026 onwards, regulation and industrial policy become a clearer accelerators and filters. While opportunities will emerge, 2026 will witness the crystallization of regulatory fault lines such as ethics, IP and a widening regional policy divergence, forcing investors to redirect capital toward AI applications that demonstrably deliver social and economic value. In Europe, AI providers serving hospitals, grids and public agencies will need to comply with high-risk requirements on data quality, transparency, human oversight and monitoring. In Japan, acute labour scarcity has already driven deployment of robots in warehouses and, increasingly, in care homes and rehabilitation facilities113. In emerging markets, India’s Unified Payments Interface and the broader “India Stack” illustrate how digital public infrastructure can expand access to finance and public services including for older micro-entrepreneurs, while raising new questions around data governance and surveillance114. The emerging regulatory environment is further promoting AI adoption. The UK Financial Conduct Authority (FCA) has launched a ‘Supercharged Sandbox’ in partnership with NVIDIA giving financial institutions access to advanced computing infrastructure, better data, and regulatory guidance to safely experiment with AI applications. Similarly, the EU AI Act, which was enacted in 2024, establishes the world’s first comprehensive framework for trustworthy AI. The phased implementation of the AI Act proved European firms a predictable regulatory timeline to integrate and innovate with AI applications while ensuring future compliance. Overall, regulation is likely to make 2026 a critical year for AI in ageing societies. The combination of regulatory obligations and targeted public funding should accelerate deployment and consolidation around compliant platforms. The question for responsible investors is not whether AI is deployed, but whether investment is flowing into the sectors and geographies where ageing-related labour scarcity and demand are structurally greatest. Critical fields in the spotlight for AI and demographic shifts Three “demographically aligned” thematic opportunity sets, and associated stewardship priorities, stand out from 2026 onwards: Demographically aligned innovation Health and care platforms designed for chronic disease and frailty Digital infrastructure for demographic resilience For institutional stakeholders focused on long-term value creation, 2026 represents the year when demographic transitions shift from distant projections to immediate realities requiring strategic response. Beyond tackling the ageing-technology nexus, organisations will have to pivot quickly towards demographically aligned strategies. |
6. Enabling investors to act on sustainability preferences
Investors want to invest responsibly, but there are remaining barriers
As discussed earlier in this paper, younger generations have shown significant interest for responsible investment and the values, expectations and literacy of today’s young retail investors will shape the future demand curve for responsible investing.
While interest remains at an all-time high, investors also face more barriers to invest responsibly due to118: lack of clear definitions on what sustainable investing is (60%), limited knowledge about how to start sustainable investing” (56%), and lack of financial advice (51%).
Beyond literacy, a practical friction sits in the product- preference link. Since sustainability preferences were introduced in MiFID II suitability, advisers must translate stated preferences into a consistent product selection and evidence that match. In practice, terminology remains uneven across providers and disclosures are not always comparable, increasing both execution complexity and mis-selling risk. The challenge can be more acute for impact strategies and private assets, where objectives, KPIs and reporting are often less standardised than in liquid markets. Given this reality, enabling investors on their sustainability preferences is both a consumer-protection obligation and an opportunity to increase clients pool.
Rebuilding the dialogue: aligning clients preferences and products advisory
Rebuilding the client dialogue requires redesigned journeys that establish common reference points and surface real choices. Practical steps include understanding typical decision factors, dilemmas & biases, trade-offs, and identifying a few discriminating axes that matter most for savers. Presented simply, these help clients express preferences and avoid mis selling, while giving advisers and product teams a shared map from intent to evidence. With that in place, shorter disclosures can link stated preferences to product objectives and measurable outcomes in a way that is comparable across providers.
What to watch in 2026 is the coherence of the package: SFDR 2.0’s final text and guidance on product families, the technical alignment with MiFID II and IDD for preference capture and retail oriented disclosures, and supervisory signals that favour clarity over bulk. The goal is straightforward: a regulatory ecosystem that makes preferences easier to express, products easier to compare, and outcomes easier to evidence.
Policymakers response: simplifying labels and regulations?
The European Commission’s 2025 financial literacy strategy underlines that improved financial literacy will help citizens feel more confident in investing for their future and channel more savings towards productive and sustainable assets. The ongoing SFDR review is a case in point to highlight this shift. EU advisers have proposed replacing the current Article 8/9 regime with three clearer categories: “Sustainable”, “Transition” and “ESG Basics”, each backed by minimum criteria and measurable indicators. The explicit purpose of this change is to reduce complexity for retail investors by creating responsible investing labels that are more intuitively understandable.
We identified a few measures that can help increase investor’ awareness on responsible investing could be:
Concise and simple-worded fund summaries that explain the fund’s sustainability approach, typical holdings, and the outcomes it seeks to achieve.
Short, evidence based tools and videos demonstrating how choosing a sustainable option can alter portfolio exposures, risk and return over realistic time horizons.
Standardised and easily comparable labels to prevent misleading “green” marketing.
Ensuring retail investors are equipped with the required knowledge and a clearly navigable RI labels landscape will be central to scaling responsible investing.
1. Amundi analysis based on Broadridge data as of Q3 2025, scope: open ended responsible investment funds excluding money market
2. Amundi analysis based on Broadridge data as of Q3 2025, scope: open ended responsible investment funds excluding money market
3. Analysis based on MSCI indexes factsheets
4. Morgan Stanley’s, 2025 Sustainable Signals survey
5. SBTi website
6. IEA Energy and AI
7. Amundi analysis based on S&P Trucost data
8. Morgan Stanley’s, 2025 Sustainable Signals survey
9. UNEP, State of Finance for Nature 2023
10. Amundi analysis based on Broadridge data as of Q3 2025
11. Amundi analysis based on Broadridge data as of Q3 2025
12. AIGCC, “State of Investor Climate Transition In Asia 2025”
13. Environmental Finance article, PRI: Our signatories are not walking away, they are doubling down
14. Bloomberg, NYC’s lander recommends dropping $42 billion BlackRock Mandate, Warning that has been applied in November 2025 where comptroller recommended the dropping of $42bn mandate due “inadequate” climate plans from the asset manager.
15. Morgan Stanley, Sustainable Signals
16. Cerulli Associates
17. 1 year performance from 31 Dec 2024 to 31 Dec 2025, EUR/USD conversion based on same period
18. 1 year performance from 31 Dec 2024 to 31 Dec 2025, EUR/USD conversion based on same period
19. 1 year performance from from 31 Dec 2024 to 31 Dec 2025
20. Low- and Middle-income countries
21. GIIN, Sizing the Impact Investing Market 2024, October 2024
22. Global Impact Investor Network
23. OECD, OECD DAC Blended Finance Guidance 2025, September 2025
24. Amundi has been active in the blended finance space, working to further knowledge through multiple publications in 2025, with a Framework for Structuring a Blended Finance Fund (July 2025), How can investors lean into blended finance structures: demystifying credit enhancements (October 2025) and Blended Finance: scaling capital for sustainable impact (October 2025).
25. Amundi has been active in the blended finance space, working to further knowledge through multiple publications in 2025, with a Framework for Structuring a Blended Finance Fund (July 2025), How can investors lean into blended finance structures: demystifying credit enhancements (October 2025) and Blended Finance: scaling capital for sustainable impact (October 2025).
26. Such as SDG One in Indonesia and the Kenya Off-Grid Solar Access Project.
27. Compromiso de Sevilla, 2025
28. See more in Amundi dedicated paper “Blended Finance: scaling capital for sustainable impact”
29. EY, 2025 EY Global Climate Action Barometer
30. Amundi analysis based on S&P Trucost data on MSCI World as of September 2025
31. Morgan Stanley’s, 2025 Sustainable Signals survey
32. J.P. Morgan, Building Resilience Through Climate Adaptation
33. J.P. Morgan, Building Resilience Through Climate Adaptation
34. Investing website article : Moody’s upgrades PG&E Corporation and Pacific Gas & Electric’s ratings
35. IEA, Energy and AI
36. IEA, Energy and AI
37. PubMed, A generative AI-discovered TNIK inhibitor for idiopathic pulmonary fibrosis: a randomized phase 2a trial
38. Bank of America: “Is the AI revolution raising consumer’s electricity bill?”
39. Bloomberg Law
40. The SEC eliminated climate rules. Other governments are doing the opposite. | Institute for Business in Global Society
41. Canadian Regulator CSA Halts Mandatory Climate Reporting Requirements - ESG News
42. Singapore delays climate reporting requirements to give smaller companies more time to prepare
43. UK Drops Plans for Sustainable Finance Taxonomy - ESG Today
44. Considering the case of utility-scale PV as an example, the observed reduction rate of levelised costs until 2024 exceeded most of the cost reduction scenarios. In fact, by the end of 2023, the LCOE for solar PV has dropped to one-third of its initial cost earlier in the year.
45. Vatankhah Ghadim, H., Haas, J., Breyer, C., Gils, H. C., Read, E. G., Xiao, M., & Peer, R. (2025). Are we too pessimistic? Cost projections for solar photovoltaics, wind power, and batteries are over‑estimating actual costs globally. Applied Energy, 390, 125856. https://doi.org/10.1016/j.apenergy.2025.125856
46. For instance, Thailand has reached 20% EV sales share, selling more EVs than EU frontrunner Denmark. While in Indonesia, EVs have made up 15% of new car sales, surpassing the EV sales share in the United States for the first time. Ember: The EV leapfrog
47. IEA Energy and AI, 360TWh incremental required by 2027 vs. 2024
48. IEA Global EV outlook, 228TWh incremental required by 2027 vs. 2024
49. IEA Electricity 2025
50. IEA Renewable electricity
51. IRENA Renewable Power Generation Costs in 2024
52. Reuters, CATL sodium ion/Naxtra launch
53. IRENA, Sodium-ion Technology Brief (2025)
54. BloombergNEF reporting on battery pack prices
55. Bloomberg electric vehicle outlook 2025
56. BloombergNEF press release
57. DOE / LBNL Report on US Data Center Energy Use (2024)
58. IEA, Batteries and Secure Energy Transitions
59. IEA, Global Critical Minerals Outlook 2024
60. Sustainable Development Goals
61. An electrostate is a country whose economic and geopolitical influence is derived from the production, control, or export of electricity, particularly from low-carbon sources such as renewables
62. A petrostate is a country whose economy and political influence are heavily dependent on the extraction, production, and export of oil and natural gas
63. Kpler data, LNG supply hits high gear in 2025 with output poised to double
64. CarbonBrief article, China’s CO2 emissions have now been flat or falling for 18 months
65. The Guardian article, China breaks more records with surge in solar and wind power
66. White house press release
67. Eurostat, Renewables in electricity generation up 4% in Q3 2025
68. SolarPower press release, European battery storage grows 15% in 2024, EU energy storage action plan needed
69. European Commission
70. European Commission
71. European Commission
72. Eurostat
73. EC Europa website, European Grids
74. FERC 2023
75. Lawrence Berkeley National Laboratory
76. German Institute for International and Security Affairs, The Geopolitics of the Energy Transition in Greater Asia, Background, Dynamics, and Trend Mapping from within the Region, January 2025
77. IEA, Southeast Asia Energy Outlook 2024, October 2024
78. IEA, The IEA’s Regional Cooperation Centre is working to strengthen Southeast Asia’s energy future, April 2025
79. IEA, The IEA’s Regional Cooperation Centre is working to strengthen Southeast Asia’s energy future, April 2025
80. IEA, Solar PV Global Supply Chains
81. IEA, Global EV Outlook 2025
82. Ember Energy article, based on IRENA
83. Wood Mackenzie
84. IEA, Global EV Outlook 2025
85. IAEA
86. Battery Tech Network, based on IEA
87. BloombergNEF
88. IEA, Global Critical Minerals Outlook 2024
89. Monitoring, Reporting, Verification
90. UNEP Emissions Gap Report 2025 still places the world on a 2.8°C trajectory under current policies (vs. almost 4°C in 2015)
91. IEA 2025, Global investment in clean energy and fossil fuels
92. World Meteorological organisation
93.
94. MunichRE press release, Climate change is showing its claws: The world is getting hotter, resulting in severe hurricanes, thunderstorms and floods
95. UNEP (2025). Adaptation Gap Report 2025 | UNEP - UN Environment Programme
96. World Resources Institute (2025). Strengthening the Investment Case for Climate Adaptation: A Triple Dividend Approach, Analysing 320 projects across agriculture, water, health and infrastructure, the study identified over $133bn of cumulative investment expected to generate about $1.4tn in benefits over 10 years, with typical returns ranging from 20% to 27%.
97. Independent High-Level Expert Group (IHLEG) on Climate Finance
98. MSCI institute
99. Amundi (2024). When extreme becomes the new normal: how to address physical climate risk
100. UNEP, State of Finance for Nature 2023
101. UNEP, Private finance for nature in 2024
102. Emerging Market Green Bonds, IFC Amundi Joint Report, 2025
103. Uruguay's Sovereign Sustainability-Linked Bond (SSLB) Annal Report 2025, Uruguayan Government, 2025
104. Ecuador Debt-for-Nature Swap in the Galapagos Islands Launched, GGGI, 2023
105.
106. Oxford Government Outcomes Lab
107. World Bank
108. TNFD Status Report, TNFD, 2025
109. OECD. (2023). OECD Skills Outlook 2023. Bureau of Labor Statistics (BLS). (2025). Labor Force Statistics from the Current Population Survey: Employed Persons by Detailed Industry and Age, 2024 Annual Averages. HBI – Home Builders Institute. (2024). Construction Labor Market Report. USDA. (2022). 2022 Census of Agriculture
110. Ageing exposure metrics are drawn from OECD, Eurostat, USDA, and BLS age-distribution data for 2023–2025. “Digital adoption” refers to sector-level indicators. Classifications (“High”, “Very High”) reflect international comparisons rather than absolute thresholds
111. OECD. (2024). Employment & Labour Market Statistics. OECD. (2024). Health Workforce Statistics. Bureau of Labor Statistics (BLS). (2025). Labor Force Statistics from the Current Population Survey: Employed Persons by Detailed Industry and Age, 2024 Annual Averages. Eurostat. (2023–2024). Labour Force Survey. International Federation of Robotics (IFR). (2024). World Robotics 2024 Report. USDA. (2022). 2022 Census of Agriculture. European Commission. (2023–2024). Digital Economy and Society Index (DESI) / Digital Decade Data
112. OECD / European Commission. (2024). Health at a Glance: Europe 2024
113. Carnegie Endowment for International Peace. (2024). Kushida, K. Japan’s Robotics and Aging Society.
114. IMF. (2023). Alonso, C., Bastos, F., Krivonos, E. & Narain, A. Stacking up the Benefits: Lessons from India’s Digital Journey
115. Ada Lovelace Institute (2025) Friends for sale: the rise and risks of AI companions
116. NADRA. (2025). Pakistan launches first digital pension system
117. Smart Nation Singapore. (2024). Digital gouvernment services adoption rates
118. Morgan Stanley sustainable signals individual investors 2025, April 2025


Author