Summary
OBBBA: a costly and socially regressive fiscal plan
key takeaways
The One Big, Beautiful Bill Act (OBBBA), signed by President Trump on 4 July, marks a significant shift in US fiscal policy. Narrowly passed by Congress, the bill embodies the core of Trump's second-term agenda, combining substantial tax cuts with unprecedented cuts to social programmes and increased security spending.
The OBBBA is a patchwork of regressive measures that exacerbate inequality, impede the energy transition, and significantly increase US public debt.
However, these measures stimulate the US economy in the short term, by around 0.2pp, because spending cuts come next year. But much of this could be offset by increased interest payments on debt and higher tariffs. However, any short-term economic performance should not obscure the exorbitant cost of the OBBBA and its adverse social effects in the medium term. Ultimately, we believe that it poses a further threat to the future of US economic power.
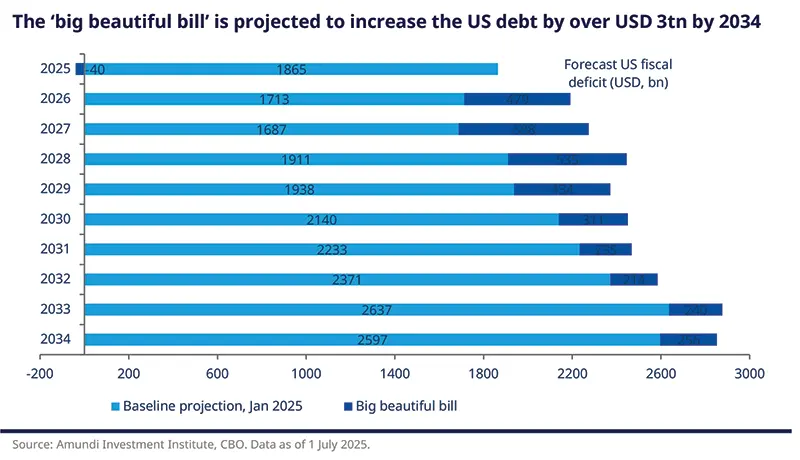
The tax cuts are estimated to cost $4.5 trillion over ten years, with only $1.5 trillion in spending savings, which would increase the debt by more than $3 trillion.
A costly undertaking
As expected, the 2017 tax cuts are being made permanent. Additional cuts are also being introduced, including an exemption on tips and overtime, deductions for seniors, and an increase in the State and Local Tax (SALT) deduction cap from $10,000 to $40,000 (this allows households, in particular, to deduct their property taxes from their federal income tax). These cuts are scheduled to expire in 2028 or 2029, while spending cuts are expected to escalate over time, provided that the Republican Party retains its majority in Congress in the November 2026 midterm elections.
Unsurprisingly, green subsidies are cut under the new multi-year budget, including the elimination of numerous incentives for renewable energy and the scrapping of the tax credit for electric vehicle purchases in September 2025, in favour of measures promoting fossil fuels and nuclear power. In addition, social assistance is being cut: 12 million people could lose access to Medicaid and the SNAP food assistance programme.
However, increased spending on security and defence has been allocated for: $170 billion to border security and $150 billion to defence.
Overall, the tax cuts are estimated to cost $4.5 trillion over ten years, with only $1.5 trillion in spending savings, which would increase the debt by more than $3 trillion.
12 million people could lose access to Medicaid and the SNAP food assistance programme.
An unnecessary fiscal boost
Had the 2017 tax cuts not been extended, the US economy would have experienced a sharp tightening of fiscal policy next year.
By comparing the new situation to a scenario in which no legislation had been passed, some organisations are overestimating the impact of the OBBBA on GDP growth. This is because they are reasoning in terms of the difference from a baseline scenario in which taxes would have increased compared to 2024. This would have had a recessionary impact. This excessive optimism about the economic impact is particularly evident in official estimates (from the Congressional Budget Office or the Council of Economic Advisers). However, all forecasters had already assumed that past tax cuts would be extended.
In practice, it is difficult to disentangle the impact of the 2017 tax cuts, which have been made permanent, from that of the additional measures announced. The latter are very diverse, and macroeconomic models are not designed to take their effects into account. Ultimately, everything will depend on fiscal multipliers. As a general rule, fiscal measures targeting lower incomes are estimated to have a much higher multiplier effect than those targeting higher incomes.
However, timing is crucial. While tax cuts take effect immediately (with some even being backdated to 1 January 2025), the planned cuts to social spending have been postponed until 1 October 2026. This will automatically stimulate economic activity in H2 2025 and beyond.
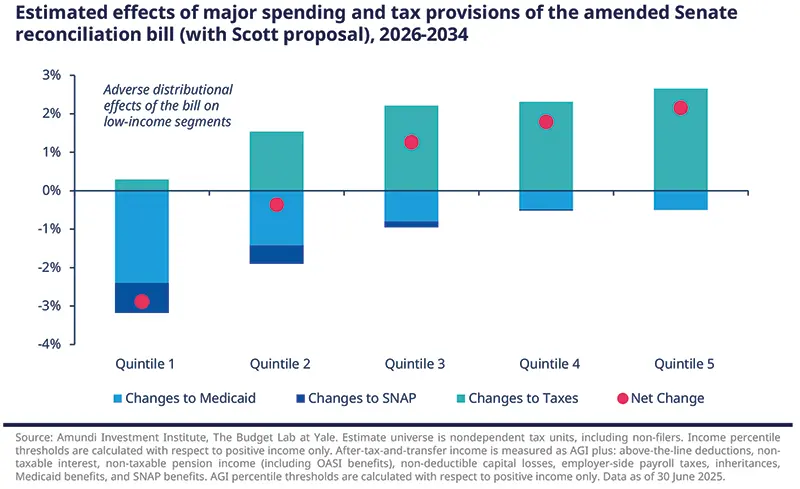
The two highest income quintiles, which account for over 60% of household consumption, will fully benefit from the new measures. The wealthiest households will mainly benefit from the continuation of tax cuts and the new SALT measures. The other measures will benefit the middle class more. Conversely, the lowest-income households will experience significant losses in benefits, but not before October 2026. Meanwhile, businesses will benefit from the return of 100% immediate tax relief on investments, which should temporarily boost investment and employment, particularly among SMEs.
Tax cuts take effect immediately, while social spending cuts are delayed until late 2026, supporting economic activity through 2025.
Initially, therefore, there will only be positive multiplier effects. Overall, we estimate that the additional tax cuts adopted as part of the OBBBA could boost US GDP by 0.2pp over the next few quarters (H2 2025 and H1 2026), all other things being equal. Not to mention the possibility of bringing forward certain security and defence spending ahead of the mid-term elections. However, this debt-financed fiscal stimulus was misguided. After all, there was no reason to stimulate an economy that had been operating at full capacity for the previous two years. That said, the stimulus would only partially offset the effect of trade tariffs, which could be significantly increased during the summer.
A highly regressive policy in the medium term
This stimulus will not be sustainable. In the medium term, massive social cuts will exacerbate inequalities and could lead to the loss of 1.2 million jobs. The revival in demand will therefore be short-lived; the loss of support for vulnerable groups will eventually outweigh the increase in demand resulting from tax cuts. Furthermore, the fiscal cost will be substantial: debt will continue to rise over the next decade and could reach 130% of GDP by 2034. This increase in debt threatens to push up the term premium on long-term Treasury securities, thus tightening financial conditions. Not to mention that expansionary fiscal policy complicates the Fed's task by giving it fewer reasons to cut its key rates.
By prioritising short-term 'stimulus' and postponing the implementation of unpopular measures that have already been approved, the US administration is making a political calculation. In doing so, it is seeking to maximise its chances of retaining control of the House of Representatives in November.
However, the strong economic performance should not obscure the exorbitant cost of the OBBBA and its adverse social effects in the medium term. Ultimately, we believe that the OBBBA poses a further threat to the future of US economic power.
The stimulus would only partially offset the effect of trade tariffs, which could be significantly increased during the summer.
Tariff uncertainty looms ahead of August deadlines
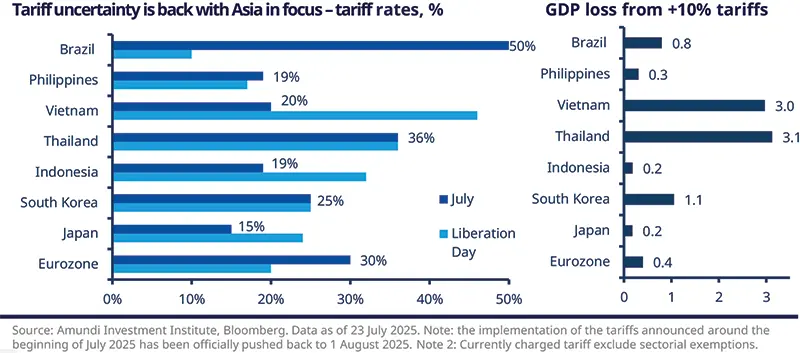
In July, the US administration surprised by announcing higher-than-expected tariffs on some major counterparts—notably 30% on Europe and 50% on Brazil—while extending the tariff pause until August 1. Clarity regarding the administration’s tariff plan with China should instead arrive in mid-August. Additionally, the recent tariff letters include, explicitly or implicitly, a clause imposing higher tariffs on transshipping. For example, Vietnamese-origin cargo considered to be transshipped goods will be subject to a 40% tariff – the current level applied to China.
While final tariff levels remain highly uncertain, it is worthwhile to begin assessing their impact on growth through trade channels across countries.
Asia is particularly affected. Despite the challenges in enforcing transshipping tariffs, medium and small open economies in the region face significant growth impacts, as they bear among the highest tariff rates in the new letters of intent. However, the situation remains fluid. Indonesia is a case in point, seeing a tariff reduction from 32% to 19% on the back of a deal to lower its own tariffs on the US and reduce its trade surplus. Japan also managed to reach a deal a few days after its upper house election, lowering the tariff from 25% to 15%.
Regarding Europe, the implementation of higher tariffs from 1 August is likely to cause a contraction in economic activity, potentially reducing growth by an additional 0.3% to 0.4% through the trade channel between the second half of 2025 and the first half of 2026.
With the latest tariff letters, the effective average tariff rate in the US is expected to rise from the current 15% to a range of 17% to 20%. This increase could negatively impact US GDP by approximately 0.4% and raise the core Personal Consumption Expenditures inflation rate by about 0.2%. Concerning inflation in the rest of the world, in the absence of significant retaliatory measures, persistent supply chain disruptions, and weak currency trends, price dynamics are expected to remain subdued due to weaker demand.
Bonds face a fiscal reality check
As the One Big, Beautiful Bill Act (OBBBA) takes effect, fixed income markets face challenges from rising rates, growing debt, and shifting capital flows. Drawing on insights from the Amundi World Investment Forum (AWIF) and recent developments, we highlight key themes for bond investors to watch.
Tug of war: secular drivers vs fiscal realities
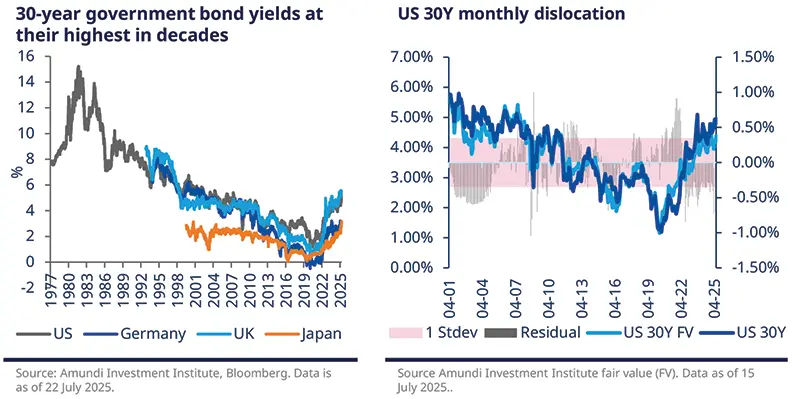
What drives rates in the long run? The secular drivers have always been demographics and productivity, and these variables suggest a return to structurally lower real rates. US real rates before the 2008 financial crisis were around 1–1.5%, followed by a post-crisis low of 0.5%, and are expected to revert to pre-GFC levels in the coming decade.
However, this secular narrative faces headwinds. Elevated public debt levels—projected to reach 113% of GDP in advanced economies and over 80% in emerging markets by decade’s end—pose a significant upside risk to yields. For over a decade, central banks suppressed yields through quantitative easing. But that regime is ending. As quantitative tightening takes hold, investors are demanding more compensation for inflation and fiscal risk.
A case in point is the US, where the debt-to-GDP ratio is projected to reach 128% by 2030, fuelling concerns over debt sustainability and fiscal discipline. This has pushed long-term rates higher, resulting in significant dislocation in 30Y Treasury yields versus our own macro fair value model. Beyond overlooking the $3.3 trillion increase in US debt (offset only marginally by annual tariff revenues of $200-300 billion), the greater concern is that the US fiscal policy mix may remain unfavourable, reducing the Federal Reserve’s (Fed) ability to cap long-term interest rates through balance sheet management.
Under the new fiscal regime, investor sensitivity to US debt quality is here to stay, making it challenging to determine fair value for the long end of the curve.
Markets are currently focused mainly on the debt impact, but the Fed’s balance sheet management will be crucial. While actual QE in the next year may be unlikely, the Fed’s reserves are nearing the lower bound of what’s considered ‘ample,’ potentially requiring reserve management purchases by mid-next year, indirectly helping the debt dynamics. We asked the attendees of our Fixed Income breakout session at AWIF what they expected the Fed to do next: the majority expect a slight easing of rates—still within mildly restrictive territory—and anticipate the Fed nearing the end of QT, with potential plans to expand its balance sheet again.
The fiscal lens now applies to developed markets too.
US Treasury yields currently offer historically attractive nominal and real returns, especially in a world where nominal growth is expected between 3.5-4.5%, making them a vital income source for global dollar base investors. However, fiscal credibility is becoming a critical differentiator. Markets are applying a sovereign credit lens to developed economies, not just emerging ones. In our view, yields of governments that appear too fiscally relaxed (like the UK or US) will continue to see pressure at the long end of the curve.
Global diversification beyond the US market
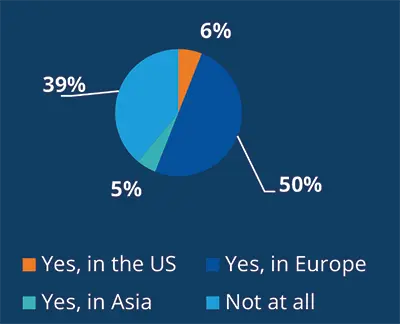
Investors are increasingly questioning their heavy US exposure. In addition, with changing correlation structures and the potential for a structural weakening in the USD (see box below), investors are reassessing their hedging strategies. Where hedges are too expensive, they are increasingly exploring diversification opportunities instead. The search for global diversification is driving interest in European sovereigns (as evident also from the survey at the AWIF), Asia-Pacific and emerging markets.
This environment demands a more active, globally diversified approach to fixed income: one that balances long-term secular trends with rising fiscal and currency risks.
Survey Results
Amundi World Investment Forum
| Hike interest rates | 3% | |
| Keep interest rates on hold for longer, but stop QT | 37% | |
| Cut interest rates above neutral and enact QE | 54% | |
| Cut interest rates below neutral and enact QE | 6% |
The US dollar: a structural shift in the making? |
As pointed out also in our Mid-Year Outlook, the US dollar’s recent behaviour has defied historical patterns. Traditionally, high US interest rates and rising term premia have supported a strong dollar, especially during equity sell-offs. However, since ‘Liberation Day’, the dollar has decoupled from these dynamics, failing to strengthen amid Treasury selling pressures. Three factors underpin this shift:
USD medium-term view: Whilst acknowledging short-term volatility, we expect a weak USD trend due to high financing needs and reduced appetite from foreign investors. The current average fair value for DXY is below 90 (1.23 for EUR/USD), but a more dovish Fed and/or faster reallocation of capital may add further downward pressure. Historically, the USD has occasionally undershot fair value before rebounding. |


Authors