
Summary
Executive summary
In this paper we examine the multi‑faceted transformation of India’s economy and financial markets and the implications for global investors. Among the structural drivers supporting growth we explore the scaling up of domestic manufacturing, the broadening consumption base, the improved infrastructure and strategic trade relationships, alongside ongoing policy measures to simplify taxation, strengthen data and regulatory frameworks, and improve market access. While the macroeconomic outlook is supportive, risks remain, reminding investors of the relevance of setting out actions to capture opportunities while managing these risks. Here are our key findings:
Structural growth drivers: India’s medium‑term growth prospects are supported by a policy push to localise strategic manufacturing, investment in capital‑intensive sectors, and reforms to improve the ease of doing business. These initiatives should raise productive capacity and shift the economy towards higher value‑added sectors.
Consumption upgrading: Household demand is shifting from essentials to discretionary and aspirational categories as incomes rise; vehicle ownership, domestic tourism, and higher‑end durable goods are clear beneficiaries. This should support a sustainable expansion in domestic revenue‑driven sectors.
Fiscal and tax reform: Goods and Services Tax (GST) simplification and tax‑policy measures are designed to incentivise formalisation, broaden the tax base, and spur domestic demand; if implemented smoothly, these reforms should boost medium‑term growth and improve fiscal transparency.
External positioning and trade policy: Active trade negotiations and renewed diversification of export markets are helping reduce dependence on any single trading partner and enhance resilience to geopolitical fragmentation.
Market structure and investor access: Deepening bond and equity markets, rising ESG‑aligned issuance, and improved index inclusion have reduced market frictions for foreign investors, while widening the domestic investor base.
Diversification benefits: Indian assets offer diversification benefits for global portfolios due to low correlation with many DM assets and improved return prospects, particularly over the long term.
Risks: Near‑term risks include cyclical softness in growth, persistent inflation, FX and liquidity volatility, and sector‑specific valuation pressures. Sovereign and corporate supply dynamics mean duration and credit‑selection risks require active management.
Global investors should consider a dedicated allocation to India that weighs policy, structural growth drivers, and liquidity/time-horizon constraints. They should adopt an active allocation with re-balancing triggers tied to policy and market milestones. In the near term, investors should focus on areas with secular growth stories --such as domestic electronics and defence manufacturing --and high-quality corporate and sovereign debt, while maintaining strict bottom-up selection and duration management. The expected benefits of including Indian assets in a global portfolio include improved portfolio outcomes through enhanced diversification and the capture of India’s equity and bond premia over the medium term. Moreover, as market access expands and data governance improves, the operational risk is getting lower. |
A disciplined, phased approach to allocation-supported by improved market access and data governance-will allow investors to capture India’s long-term potential while managing near-term risks.
India’s long-term transformational growth drivers
Scaling up domestic manufacturing
Make in India -- a policy framework encouraging domestic manufacturing -- was launched in 2014. The programme intends to incentivise domestic manufacturing to meet internal demand and exports. In principle, the programme goals were premised on sound economic logic: India had -- and still has -- a large, growing consumption demand for a range of goods and services, as the middle class and its disposable income grew, which was being met primarily through imports. Historically, India’s manufacturing was more industrial in nature, focused on sectors such as petroleum products, chemicals, metals, and metal products.
Over the past years, the policy environment has evolved to meet the challenges of scaling up domestic manufacturing. First, India worked strenuously to get the many basics in place, such as reducing logistics costs, ensuring sufficient quality electricity supply, easing land acquisition for industrial use through government land banks, and renewing the tax system (e.g. GST). In addition, various initiatives have been launched to get the machinery humming, such as production-linked incentive schemes, tax incentives for new manufacturing units, and the setting up of industrial parks. While not always directly consequential, these measures have provided the necessary base support to kick-start the manufacturing journey.
India has also made significant progress in cutting red tape for business, which has facilitated the transformation of the manufacturing sector. These include reforms in areas such as starting a business, dealing with construction permits, registering property, and enforcing contracts. These reforms have helped create a more conducive environment for businesses, boosting investor confidence, and encouraging both domestic and foreign investment. Indeed, they have also helped attract FDI into the manufacturing sector and reduce red tape.
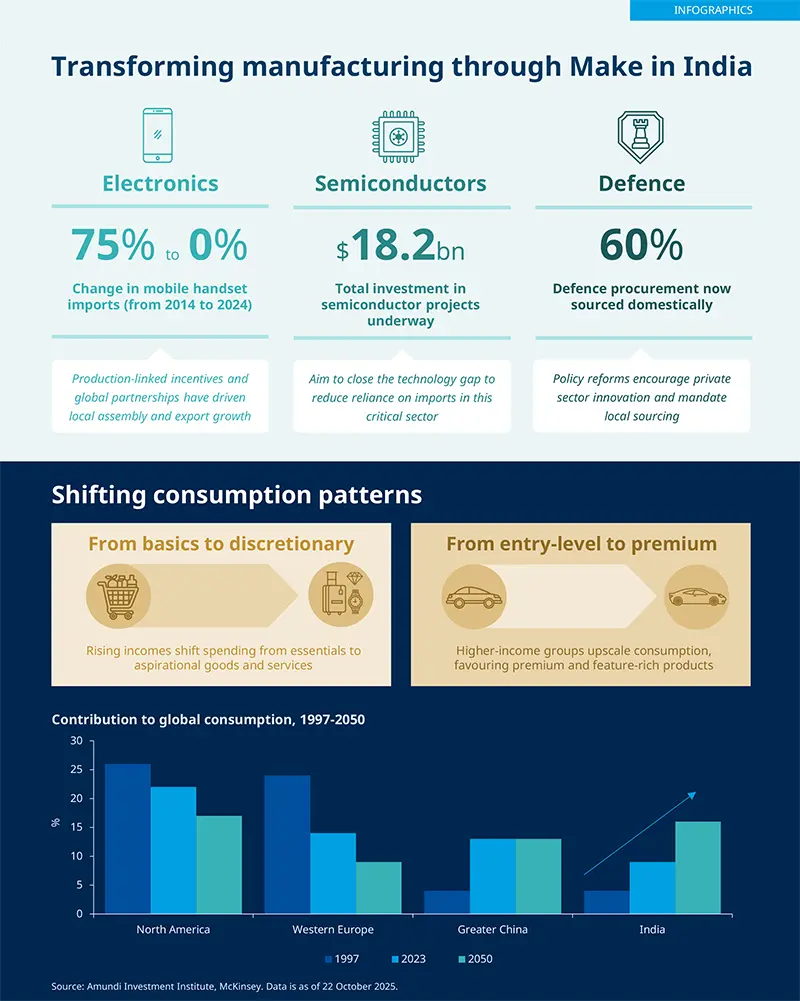
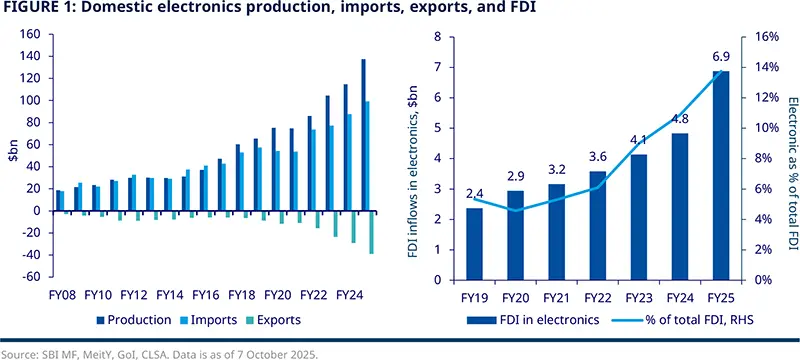
Current efforts to scale up manufacturing focus on a few key areas, including electronics – specifically semiconductors – and defence procurement. All these areas are strategic in nature from a political and geopolitical standpoint as India lacked significant domestic supply capabilities in all of them, both technical and manufacturing-wise. In electronics manufacturing, if we look at mobile handsets, the government focused on two aspects: first, setting up a production-linked incentive programme, which provided production-linked subsidies to bring local manufacturing costs to parity (compared with production located in China and Vietnam); second, encouraging global manufacturers to set up assembly and manufacturing facilities in India. In 2014-15, about 75% of India’s mobile handset demand was met through imports; by 2024-25, this is close to zero. In addition to meeting domestic demand, exports have scaled up materially. From a manufacturing standpoint this is a start of a long journey. Currently India is primarily assembling components, but, eventually, it is likely that a larger share of components will be made domestically as economies of scale kick in and technological capabilities are built.
Various initiatives have been launched to get the machinery humming, such as production-linked incentive schemes, tax incentives for new manufacturing units, and the setting up of industrial parks.
Developing semiconductor manufacturing is another key focus area for the government. This has the dual objective of creating a source of chips for domestic electronic manufacturing and building strategic capabilities for defence and computing applications. While home-grown talent for chip design is well established, the domestic production has room to evolve further. Low initial demand and high capital costs deterred local manufacturing. With current demand rapidly increasing, the government has provided large and generous subsidy programmes to address the high capital costs. Once again, the government’s intention to create domestic capabilities in semiconductor manufacturing for its own requirements first, and eventually to export.
The third big pivot has been the increased sourcing of defence equipment and consumables from domestic vendors. India has traditionally had strong local manufacturing capabilities in the industrial-machinery, tools, and equipment space, including for export orders. India needs to leverage these capabilities to meet its own new strategic requirements.
The government initiated a series of reforms aimed at encouraging domestic companies to invest into local defence technologies and to ensure off-setting clauses requiring domestic sourcing or technology-transfer conditions for defence contracts awarded to foreign firms. These included changing regulation to enable the participation of private-sector entities in the design, development, and supply of defence equipment and mandating a “procure from India” clause in many defence contracts. This has resulted in a spurt of domestic firms focusing on capital goods for defence tech.
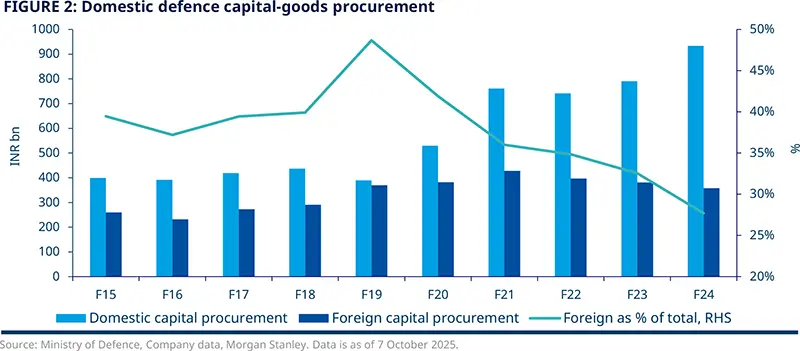
The government initiated a series of reforms aimed at encouraging domestic companies to invest into local defence technologies and to ensure off-setting clauses requiring domestic sourcing or technology-transfer conditions for defence contracts awarded to foreign firms.
Shifts in consumption patterns
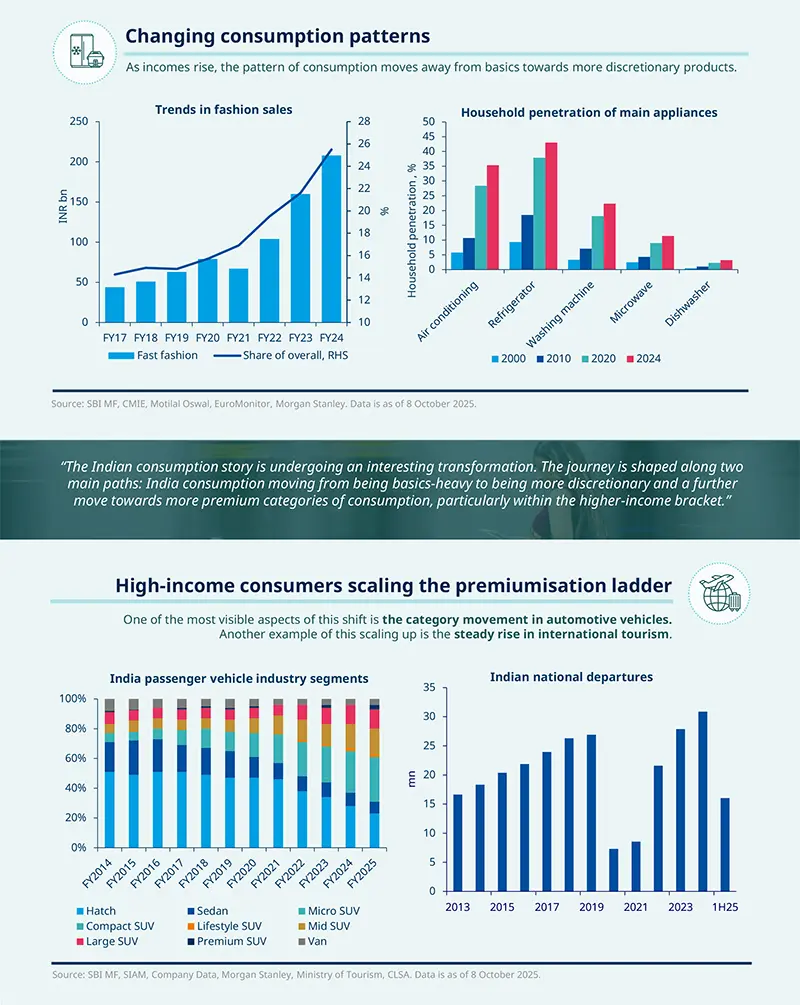
The India consumption story is undergoing an interesting transformation. The journey is shaped along two main paths: India consumption moving from being basics-heavy to being more discretionary and a further move towards more premium categories of consumption, particularly within the higher-income bracket.
On the first, the transition is similar to what has happened in most EMs. As incomes rise, the pattern of consumption moves away from basics towards more discretionary products. This is driving significant demand across a larger range of products and services, from household durables such as air conditioners and kitchen appliances to an increased propensity for travel and tourism. If we look at kitchen appliances, there is a high penetration of basics like refrigerators, but incrementally there is greater demand for lifestyle products such as dishwashers. Where households previously had one air conditioner (typically in the bedroom), rising affordability and more reliable electricity supply have increased the number of air conditioners per home. These changes are most visible in larger cities, but are beginning to percolate in smaller towns as well.
There is also an aspirational element to the changes in consumption patterns. The proliferation of smartphones, cheap internet, e-commerce, and digital payment systems is enabling notable change. Social media has amplified aspirational consumption. Consumers are no longer happy to wait for products to be available in stores or to travel to a larger town to purchase them. They want products delivered to their doorstep as soon as they become available in larger cities.
While the Indian middle class is spending on newer, aspirational areas of consumption, the higher-income segments are upscaling their spending. One of the most visible aspects of this shift is the category movement in automotive vehicles. Entry-level vehicles accounted for around 70% of volumes in FY2014 but are down to 31% in FY2025. Within each segment, the share of feature-rich vehicles has been rising. Another example of the scaling up is the steady rise in international tourism. Indian nationals travelling abroad hit an all-time high of 30.9 million in 2024. The aspirational Indian consumer is likely to continue expanding their consumption basket into newer categories, which should open new, longer-term growth avenues.
Due to the importance of the domestic economy to underpin economic growth, the government currently favours initiatives to support consumption among lower-income households. Over the last year, the government has introduced measures to increase disposable income, such as tax reduction and the GST reform (see box below).
While middle India is spending on newer, aspirational areas of consumption, the higher-income segments are upscaling their spending.
Box 1: Simplification of GST to spur growth potential One of the most consequential developments in India’s recent policy landscape has been the rationalisation of the Goods and Services Tax (GST) structure. This reform marks a pivotal moment in India’s fiscal architecture, aiming to simplify a system that had grown increasingly complex. India introduced GST in 2017 to unify its indirect tax regime into a single, streamlined framework. While the reform was transformative, the proliferation of multiple tax brackets introduced complications. Businesses often found themselves navigating a maze of classifications, where even minor changes in product definitions could shift items into higher tax brackets, triggering litigation and uncertainty. Consumers were also affected by inconsistent and often high tax rates on essential goods. Moreover, the rise of digital platforms, gig workers, and e-commerce businesses exposed structural gaps in the GST framework. The reform seeks to address these issues. The most notable change is the simplification of the tax structure, reducing the existing five brackets to three: 5% for essential goods and services, 18% for standard items, and 40% for sin and luxury goods. This move should reduce compliance costs for businesses and eliminate ambiguity in pricing. In addition, for consumers, the reform promises tangible relief. Many mass-market and aspirational goods will now fall under the 5% tax bracket. This shift should reduce the cost of living and boost consumption. Additionally, the reform attempts to correct inverted-duty structures in certain sectors. Aligning input and output tax rates will support domestic value addition and improve sectoral efficiency. The reform also introduces technological upgrades to the GST system, including real-time tracking, e-invoicing, and AI-powered reconciliation tools. The timing of the GST reform aligns with broader counter-cyclical measures designed to support domestic growth amid global uncertainties and is expected to buoy household consumption over the next quarters. The fiscal cost of the reform is estimated at INR 1.4tn, or 0.4% of GDP, which is manageable for FY2025–26, given the buoyancy in non-tax revenue for the central government. Importantly, GST cuts are likely to have a higher multiplier effect than income or corporate tax reductions, as they directly influence private consumption at the point of purchase. Lower GST rates should also have a disinflationary impact by easing inflationary pressures and increasing the likelihood of further monetary easing. In conclusion, the GST reform is a timely and necessary intervention, not just to simplify the tax system, but to stimulate domestic demand. While its immediate impact on spending may be modest, the long-term benefits should unfold gradually, reinforcing India’s growth trajectory through improved competitiveness, demand, and fiscal resilience. |
Indian assets in global portfolios
Rethinking geographical diversification in an era of geopolitical fragmentation
We believe the current era of geopolitical fragmentation and rising economic regionalisation is reshaping the approach to diversification. After a decade marked by US exceptionalism and broadening globalisation, investors now face a different reality. Covid‑19 and the war in Ukraine have accelerated a profound redesign of supply chains and national priorities, with energy independence and AI at the forefront, while the US administration is intensifying great‑power competition. Delays in the climate transition, rapid technological transformation, and challenging demographic dynamics in most countries (with a few emerging markets -- India being the most notable -- as exception) are having uneven effects across countries.
As noted in our 2025 Capital Market Assumptions (CMA), these trends will affect long-term return expectations across major asset classes and reshape approaches to diversification in global portfolios. In this new environment, the old playbook of global equity-bond allocations with a strong reliance on US‑denominated assets is under strain. Traditional equity‑bond allocations were tested by the 2022 inflation shock. More recently, the correlation structure of the USD has shifted: the greenback has not reliably acted as a safe haven during episodes of equity stress, such as the post‑liberation day sell‑off, amid rising uncertainty over US policy responses. Regional dynamics are also changing, with domestic growth more in focus at a time of rising tariffs.
All that has resulted in changing correlation dynamics. Average equity correlations between developed and emerging markets began to fall after Covid-19 and weakened further after 2022. This represents a regime shift from decades of growing synchronisation driven by globalisation, as capital flows, policy stances, and FX dynamics increasingly reflect regionalised interests. Far from signalling the end of globalisation, this fragmentation points to differentiated growth paths and idiosyncratic returns, precisely the conditions under which country allocations can add value.
As a result, new diversification engines are gaining traction: investors are increasing allocating to structural diversifiers such as gold and real and alternative assets and, selectively, to regional long‑term winners that can help diversify the geopolitical risk.
We believe that Indian assets -- both equities and bonds -- deserve consideration as potential long‑term standalone allocations that offer structural growth and attractive diversification benefits to global portfolios.
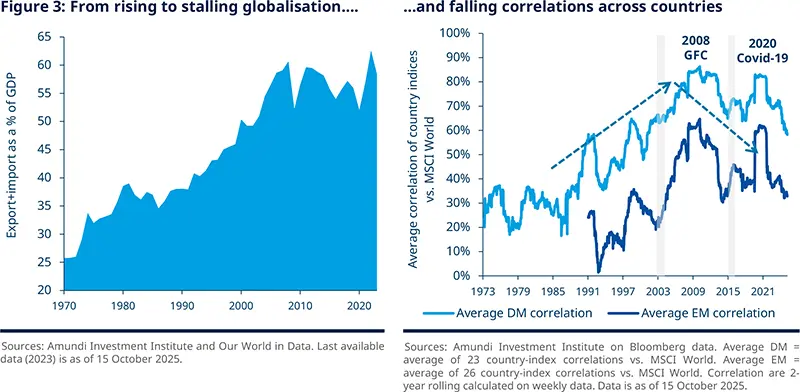
We are witnessing a regime shift driven by greater geopolitical fragmentation and the rise of regional powers, which makes the case for selective country allocations more compelling than in the past.
Three reasons to allocate to India: growth, diversification, and deepening markets
We see three main drivers underpinning a case for Indian assets in a strategic asset allocation (SAA): growth potential, diversification benefits, and a rising and diversified investor base.
Strong growth potential for both equities and bonds
As pointed out in our 2025 CMA publication, India’s long‑term macroeconomic outlook (10‑year horizon) is supported by still favourable demographics, accelerating urbanisation, and continued productivity‑boosting investment. Central to this is the government’s support to expand strategic sectors, cut import dependence, and boost exports, helping to rebalance a services‑heavy economy towards manufacturing. Rapid digital adoption is accelerating AI‑led innovation; amid rising US–China tech rivalry, India’s vibrant start‑up ecosystem and improving manufacturing capabilities make it an increasingly attractive option for companies seeking to diversify supply chains.
This economic backdrop will result in a decade of high-potential growth, which is seen as persistently at premium over the RoW, while adjusting marginally to the downside towards the end of the decade. At the same time, the inflation outlook is seen as benign, with inflation seen around the 4% level.
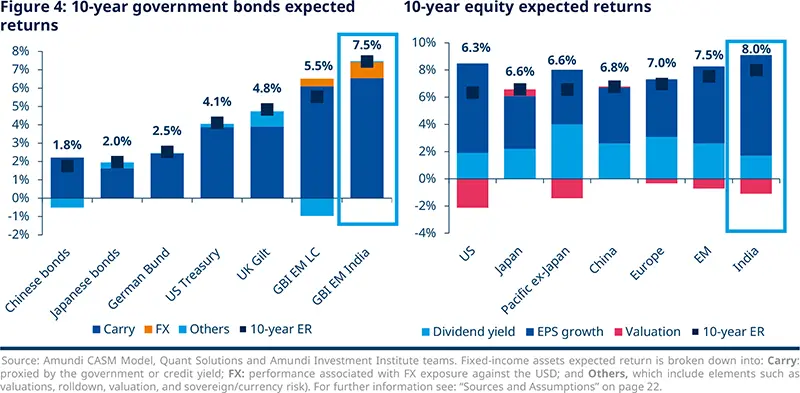
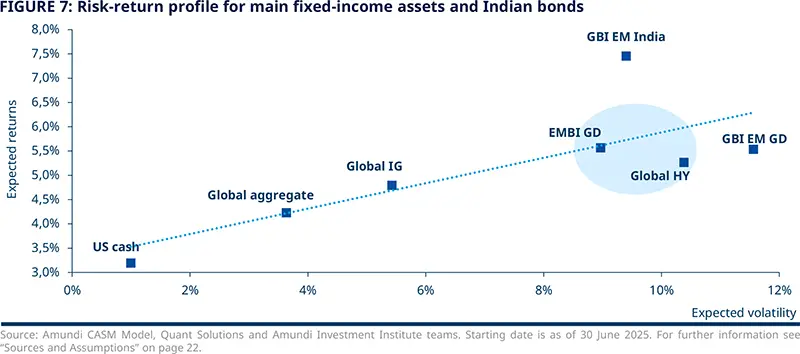
For Indian bonds, our long-term outlook based on historical analysis and forward-looking guidance from the above-mentioned macroeconomic scenario points to an expected return of around 6.5% over the next decade in local-currency terms (carry driven). If we include the FX contribution, the expected return over the next decade for the GBI EM India Bond Index in USD is 7.5%, the highest across the fixed income universe considered in our CMA.
For Indian equities, we anticipate an average return of 8.0% over the next decade, supported by strong EPS growth. Over the past year, valuations have improved, particularly in relative terms. Such a positive outlook may extend beyond the 10-year horizon, where the valuation component plays a smaller role, partially offsetting the long-term downward trend in macroeconomic fundamentals. India’s equity expectations are the highest across the equity spectrum, although volatility is also high, around 25%.
We believe that Indian assets -- both equities and bonds -- deserve consideration as potential long‑term standalone allocations that offer structural growth and attractive diversification benefits to global portfolios.
Box 2: Assessing the FX impact | |
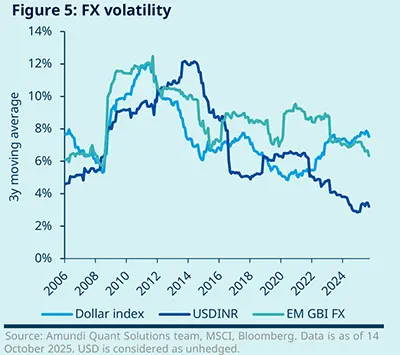
Currency fluctuations can have a significant impact for unhedged foreign investors. We expect the Indian rupee to appreciate by over 8% in cumulative terms in the long run, which could lift unhedged returns in Indian-rupee (INR) denominated assets by roughly 85bp. However, including FX typically increases measured volatility. According to our estimates, unhedged bond volatility could rise to around 9.5% and equity volatility to some 28%. Hedging the exposure to INR against the USD is an option, but comes with a cost of carry above 1% annually. This can make full hedging uneconomical in the case of the Indian rupee, which exhibits a low standalone foreign exchange risk. |
|
Indian assets’ diversification benefits within global portfolios
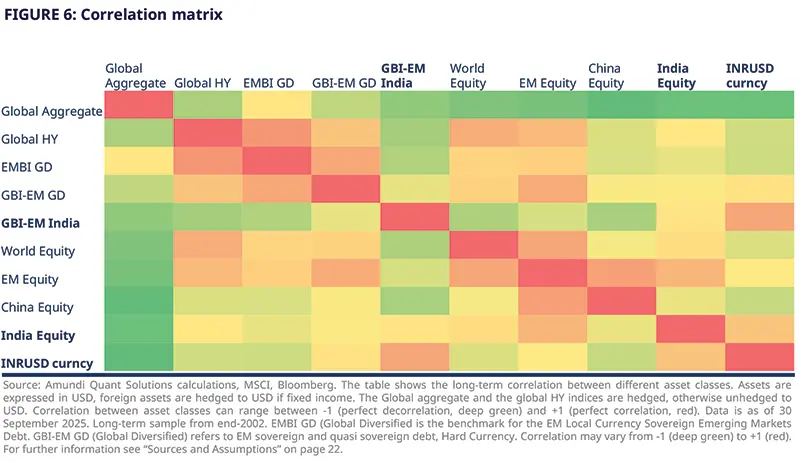
Indian assets offer notable diversification benefits in global portfolios. Both Indian equities and bonds display relatively low correlation to traditional building blocks (Global aggregate and World equity), largely thanks to the diversification benefit of the currency exposure.
Indian bonds: high income, appealing risk-return profile
In the fixed‑income universe, Indian bonds act as a strong diversifier. They show low correlation with the Global Aggregate Index and with the broader EM debt space, which is even lower compared to other high‑income fixed‑income asset classes, such as the global high‑yield market. In addition, Indian bonds also have among the lowest correlations (after the Global Aggregate) with World Equity, EM Equity and China Equity markets, making them an appealing diversifier in multi‑asset allocations.
What makes Indian bonds particularly attractive is also their risk‑return profile. Although they sit toward the higher‑risk end of bond asset classes, their higher expected returns make them favourable on a risk‑adjusted basis versus other major bond categories, especially given India’s strong sovereign rating. We also anticipate that volatility could fall structurally following Indian bonds inclusion in the GBI‑EM Index as market dynamics evolve, further improving their risk‑return payoff.
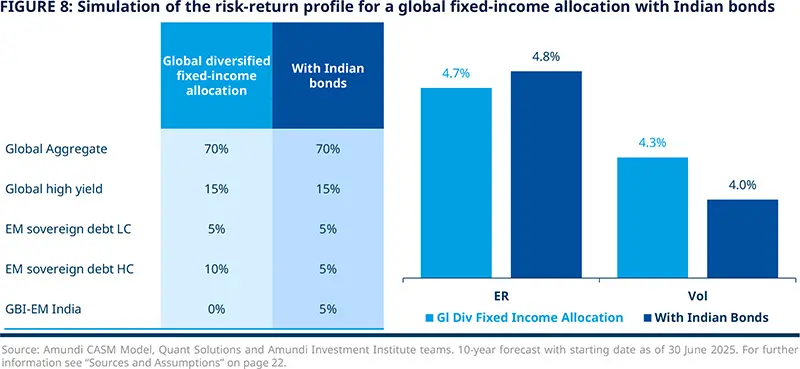
Based on the expected returns, volatility and correlation assumptions above, adding Indian bonds to a global diversified allocation could help to both raise expected returns and reduce overall portfolio volatility over the next decade. In the simulation shown below, we model a global fixed‑income allocation with an income tilt with a 15% exposure to EM debt (local and hard currency) and compare it with the same overall EM exposure but with a 5% allocation to Indian bonds. Over the next decade, the inclusion of Indian bonds materially improves the allocation’s risk‑return profile.
Indian equities: high return potential with a domestic bias
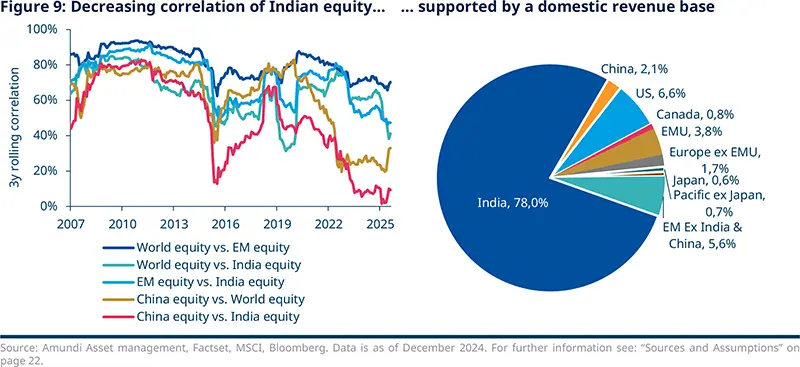
In the EM equity space, Indian equities are a good diversifier, as they offer below-average correlation with both global and EM equities. Crucially, their correlation with China is particularly low, highlighting divergent economic structures and policy drivers. As such, Indian equities are an attractive EM allocation, delivering appealing expected returns underpinned by fundamentals closely tied to domestic activity, as reflected in country-level revenue attribution. That domestic bias helps insulate Indian stocks from geopolitically driven trade tensions.
Building an ad hoc allocation to Indian equity can capture future economic growth and the likely reallocation of assets prompted by that growth, while enhancing overall portfolio diversification. India currently accounts for 18% of MSCI EM market capitalisation; based on our expectations, that weight could rise by about 5% to roughly 23% of the EM universe over the next decade.
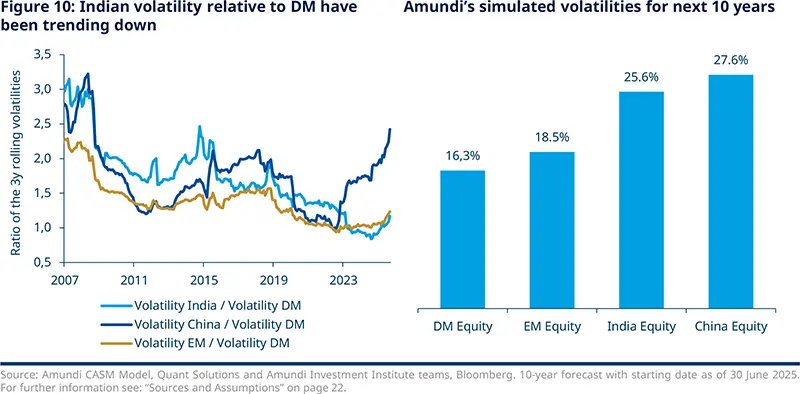
Historically, a key challenge when adding Indian equities to asset allocations has been their high volatility. We continue to assume volatility of around 25% for Indian equity in INR -- slightly below China, but well above EM equity (19%) and DM equity (16%). However, recent trends suggest the volatility premium versus the DM market is declining and, if sustained, could lead to a rerating of India’s volatility toward lower levels, further increasing the asset class’s appeal on a risk‑adjusted basis.
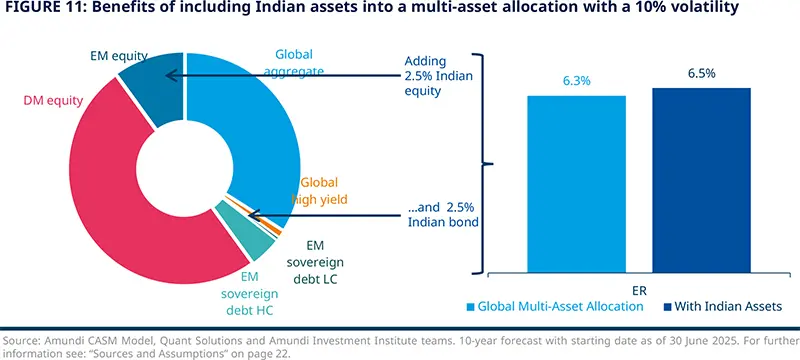
Given their risk‑return profiles and correlation features, the inclusion of Indian equities can be beneficial for diversified multi‑asset allocations. In the simulation below, we model a global allocation of 60% equity and 40% bonds with a 10% exposure to EM equity and 5% to EM debt (local and hard currency). We compare this with the same overall EM exposure which is split so that 2.5% is allocated to Indian bonds and 2.5% to Indian equities. Over the next decade, the inclusion of Indian assets increases annual expected returns by almost 15bp while maintaining the same level of volatility. This improves the global multi-asset allocation efficiency.
Rising and diversified investor base
As discussed, investing in Indian assets is not without risks. Standalone volatility, especially for equities, is high, while FX exposure adds risk, especially for bond investors. There are also caveats regarding capital market structure, efficiency and accessibility.
Historically, foreign investors have faced barriers when scaling exposure to India, including limited index representation, access constraints, and tax complexities. These constraints are now loosening. Inclusion of Indian government bonds in the JP Morgan GBI‑EM Index in June 2024 markedly increased passive foreign demand for local paper. At the same time, domestic savings and institutional demand are rising, improving market depth and stability. This is also demonstrated by the ever-growing interest of local buyers in Indian IPOs, which now represents most of the demand. As more domestic capital is poured into the local equity market, its resiliency and independence from foreign flows rises. This phenomenon could be a driver for years of market stability and lower volatility going forward.
Administrative hurdles are being addressed too: Indian Foreign Portfolio Investment license will soon be measured in days as opposed to the months or even years that prior bureaucracy could entail. Another challenge is the taxation environment, which remains less favourable for foreign investors. However, the establishment of dual tax agreements, first with GIFT City and then with Ireland, has significantly mitigated the impact on the final returns to investors.
Together, these developments make India more investible at scale, notwithstanding that taxation remains less favourable in some instances and operational setup is required for efficient market access.
The trend is clear: improved index inclusion, rising demand for diversification, and deeper domestic markets are steadily lowering historical frictions to investing in Indian assets.
Where does India stand on its long-term journey?
Short-term macroeconomic outlook
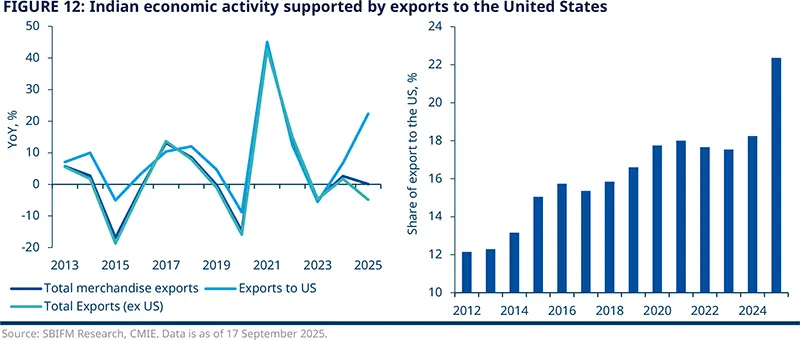
We have recently upgraded our India GDP forecasts for the current fiscal year (6.6% in FY2026) and they remain substantially unchanged for next year (6.3% YoY). Growth in the second half of 2025 appears solid despite recently imposed tariffs. The US’s 50% face-value tariff rate on Indian exports places India at a relative disadvantage, since peer economies like Vietnam and Indonesia have secured more favourable terms, but negotiations between the two countries are ongoing. Goods exports from India to the US have risen further in the first five months of 2025 to 22-23% as a share of total exports. While India’s overall merchandise exports have seen a marginal decline over the same period, exports to the US have risen by 25% YoY.
Having said that, it is worth remembering that India is an economy mostly driven by domestic demand. In the short -term, looking at consumption and investment, household demand perspectives seem more supported by the recently introduced fiscal relief (lower income taxes) and reform (GST), as well as the planned 8th Pay Commission expected by January 2026 that will see a rise in civil servants’ pay. As far as private investments are concerned, the recovery is more uneven and, recently, mostly disappointing amid the elevated uncertainty impacting business confidence. Indeed, the downside risk stems from the external environment, and it mostly concerns mostly investments and exports. Without any fiscal support, the growth impact would drag GDP growth below 6% in FY2026, compared to our baseline expectations of 6.3%.
We expect India’s headline inflation to average around 2.4% in FY2026 and stay well anchored within the target band, at 4.0-5.0% in FY2027. A favourable monsoon season and global food dynamics are conducive to a benign food inflation outlook. Subdued global energy prices and political compulsions have kept utilities inflation anchored, with transportation costs mostly unchanged since 2022, which has had a significant bearing on core goods and services prices. In addition, as per the Reserve Bank of India’s (RBI) latest monetary policy report, the GST reform could lead to a tax reduction of 11.4% in the CPI basket by weight. Eventually, the actual impact on CPI inflation will depend on the extent of the pass-through, but it will certainly be disinflationary.
Our expectations factor in the assumption of continuing favourable weather conditions and contained global food and energy prices, alongside a gradual pick-up in consumer demand aided by the policy stimulus. The introduction of a new rebased CPI series next calendar year aims to improve the accuracy in reporting the inflation data based on changes in consumption habits and a more inclusive consideration of urban India as well as rural India that is absent in some sub-components.
Monetary policy outlook
As the growth risks remains tilted to the downside, the RBI will be watching closely the trade developments, which potentially add uncertainty to the baseline. At its latest monetary policy meeting in October 2025, the RBI recognised the tariffs and trade headwinds as important risks. Nevertheless, the baseline for the Indian growth outlook appeared sanguine, forecast at 6.8% for FY2026. We are more cautious on growth prospects and believe that the actual growth dynamics in India are running softer than that recently portrayed by real GDP prints.
At its October meeting, the RBI confirmed its neutral stance, highlighted in June and August, which somehow overlooks the historical low level of inflation that makes real rates rather high. By anticipating higher inflation dynamics -- though not running above the CB target range -- we believe there are enough reasons for the RBI to depart from its recent neutral guidance and deliver an additional 25/50bp cut over the course of FY2026-27.
How India is dealing with new protectionism and geopolitical shifts
Despite the recent tariff spat with the US, India is a beneficiary of the geopolitical changes towards multipolarity. As a middle power and an alternative to China, India stands to gain from Western diversification away from China, and Asian diversification efforts away from the West. India follows a multi-alignment strategy, which involves fostering relationship with various powers, evident in its participation in BRICS, while at the same time expanding military drills with the US. India’s unique position in today’s geopolitical power plays has become evident in recent months, as it sought to improve ties with China. Prime Minister Modi attended the Shanghai Cooperation Organisation (SCO) summit in Beijing despite long-standing tensions. Both Xi and Modi will benefit from better ties, even if these mainly serve to improve negotiating positions with other countries.
Wary of over-dependence, in recent years India has diversified its defence procurement towards other countries, such as the US, France, and Israel, and is actively seeking to improve ties with the US. While it does not want to cut off ties with Russia, it has offered the US more energy purchases to get a trade deal over the line. Interestingly, as the US is shifting its support more towards India – and its relationship with Pakistan remains volatile -- China is the main provider of weapons to Pakistan, which is China’s own geopolitical hedge and pressure point against India.
Better US-India ties are in the interest of both: the US does not want to push India closer to China, while India remains wary of China’s intentions and wants to hedge geopolitically. Importantly, India is part of the QUAD, which also includes Australia, the US, and Japan and aims to support stability in the Indo Pacific region. Therefore, improved US-India ties are likely.
India’s approach to improving relations with other countries is evident in its recent trade negotiations. The country has stepped up trade engagement for both geopolitical and economic reasons. Talks are progressing well with the EU, after signing a deal with EFTA (Switzerland, Norway, Liechtenstein, and Iceland) and the UK earlier this year. It is also aiming to expand an existing deal with Brazil to include Mercosur countries.
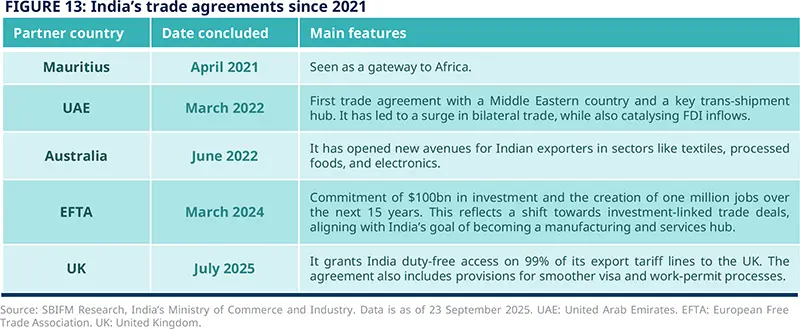
The macroeconomic impact of these agreements is multifaceted. First, they should enhance India’s export competitiveness by reducing tariff barriers and improving market access. Second, they support domestic manufacturing by facilitating the import of intermediate goods at a lower cost. Finally, they attract FDI by offering regulatory certainty and improved ease of doing business. India’s services sector has also benefited from these agreements, with services exports surpassing $375bn in 2024, from around $220bn in FY2018-19.
Looking ahead, India is actively negotiating trade deals with the US, New Zealand, and the EU. The India-US trade agreement has hit multiple roadblocks, though negotiations are ongoing. Meanwhile, the EU negotiations are targeted to be concluded by the year-end. India commenced trade talks with New Zealand in March 2025 and has successfully concluded two rounds of negotiations thus far.
In conclusion, India’s recent trade agreements are strategic instruments of economic transformation. By aligning trade policy with domestic reform, investment promotion, and global value-chain integration, India is laying the groundwork for sustained growth and enhanced global competitiveness. These reforms are not just about boosting exports, they are about reshaping India’s economy and its role in the new geopolitical landscape.
Equity market
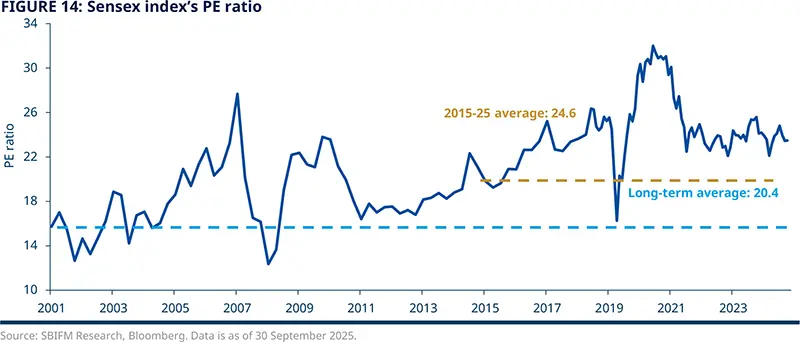
India’s equity market has had an uneventful last 12 months, with the Nifty 50 returning around 1% on a YoY basis and lagging in performance against key emerging and developed markets, as the market was undergoing a correction from high valuations. Following this weak performance, we find that, across all valuation parameters (trailing PE, normalised trailing P/E, market-cap-to-GDP ratio) the market is now hovering around the neutral zone after a period of high valuations compared with their respective historical averages. As such, we expect equity market returns to be in line with the expected cost of equity.
Market sentiment has eased off from exuberant levels of the recent past. It is a contrarian indicator wherein we turn positive on the market when the sentiment is negative and vice versa. Our proprietary market sentiment index had been elevated from late 2023 until mid-2024, when it started easing off. Over the past six months, it has been hovering in the neutral zone.
Regarding prospects ahead, challenges in fundamentals persist in the near term. India’s nominal GDP growth has fallen into single digits and should stay at similar levels in the current fiscal year (see p. 15 for further details). Slowing nominal growth rates are reflected in challenges to corporate top-line earnings growth. Post-Covid-19, markets have been focused on bottom-line growth, which had bounced back strongly from Covid-19 lows. However, during the same period, top-line growth was lacklustre, implying cost-efficiency-driven improvements in corporate bottom lines. FY2025 saw this trend ease and bottom-line growth converged with top-line growth to single-digit levels. Regarding FY2026, there was a widespread expectation of improvement in corporate performance and growth in the 14-15% range in bottom line. This number has been revised down and is currently at 9.1%, which still points to decent earnings growth.
Looking ahead, we expect some of the government initiatives to make the second half of FY2026 better than the first half. Such initiatives include the GST rationalisation, income tax benefits to a significant section of tax payers, and the impending revision of salaries to government employees, along with the usual demand uplift that we see during the festive season. While there are near-term challenges, the long-term attractiveness of India’s market fundamentals has not deteriorated.
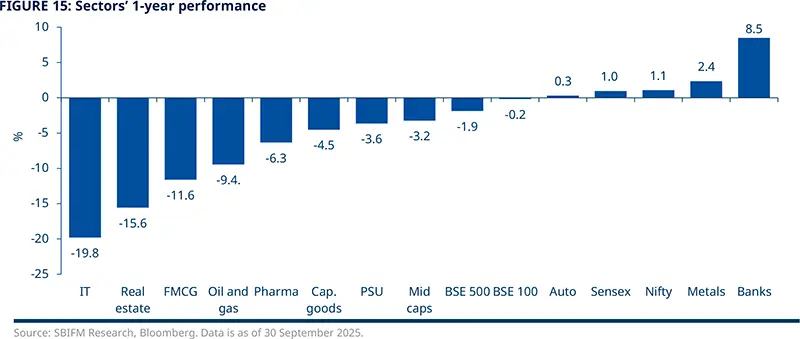
We see opportunities at the sector level using an active management approach. Over the past year, banks have stood out in terms of performance against the Nifty 50 Index, returning 8.5% vs. 1.0% for Nifty 50, respectively. Except for banks and metals (1-year return of 2.4%), all major sector indices underperformed the Nifty, with IT (-19.8%) and real estate (-15.6%) being the worst performers. Both defensives and cyclicals underperformed, underscoring the challenges of generating alpha in the current market.
Small and mid-caps (SMID) have had a very strong run against large caps since May, stretching their relative valuations to extreme levels. The price-performance differential between large cap and SMID hit a historical extreme in July 2024. From those levels, we have observed a reversal in this trend. However, we believe that there is still a lot of ground to cover, and during this period market concentration will increase, in our view. Therefore, we expect large caps to outperform SMID.
We expect large caps to outperform SMID; we see opportunities at the sector level using an active management approach.
Bond market
The RBI has cumulatively cut policy rates by 100 bp this year. At the same time, the central bank has shifted its policy stance from accommodative to neutral since the June 2025 review. Such a neutral stance provides adequate flexibility to respond to evolving macroeconomic conditions. From a growth-inflation perspective, there remains enough room to adjust policy rates lower in the current cycle, which has seen an unprecedented liquidity infusion as the banking liquidity tightened on account of FX interventions, which impeded policy transmission. Apart from the core liquidity injection of INR 5.2 trillion through open market purchases, the RBI has also cut the cash reserve ratio (CRR) cumulatively by 150bp in this easing cycle. Over this cycle, a liquidity injection of INR 10.0 trillion has been conducted through open market operations (OMO), a CRR cut, and FX swaps, on top of multiple rounds of short-term liquidity infusions through variable rate repo auctions.
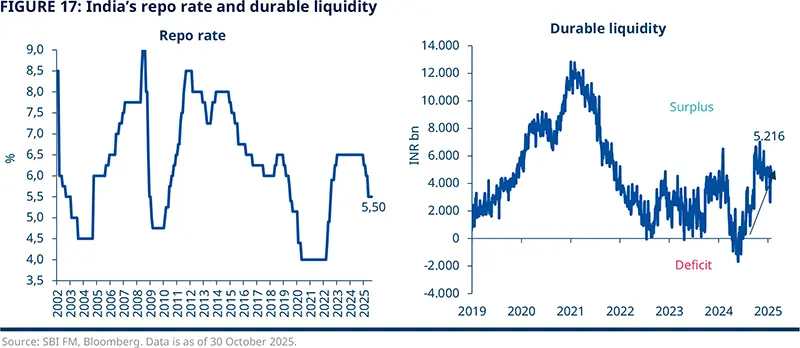
Alongside the rate cuts, the largest impact has been in system liquidity shifting from a deficit to a surplus with the core liquidity surplus currently under INR 4 trillion. The impact has been seen in the yield curve steepening over the past two years. The yield curve steepness reflects near-term demand supply challenges more than any material concerns about the fiscal framework. The fiscal deficit trajectory has shown a downward trend with the government budgeting FY2026 fixed deposits at 4.4% of GDP. In the FY2026 Union Budget, the central government has committed to anchoring the fiscal deficit over the coming five years such that the debt-to-GDP ratio is on a declining trend with a commitment to reduce the central government debt-to-GDP to 50% +/- 1% by March 2031.
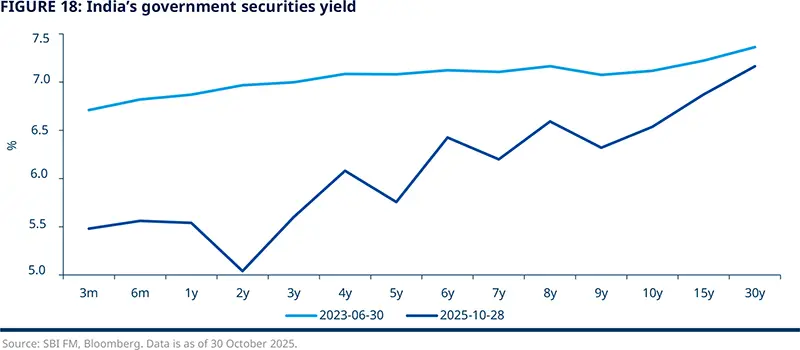
A steeper yield curve has also been the result of demand-supply gaps and certain changes in investment patterns by long-term investors. Over the last fiscal year, the impact of large OMO purchases and index inclusion flows largely masked the emerging challenges. With the RBI OMO’s winding down and the foreign portfolio investment (FPI) flows tapering off, these issues have come to the forefront. Changes in taxation norms as well as the investment pattern of pension funds have incrementally led to rising equity investments by these players. The tapering of long-end investor demand in sovereign bonds and higher duration supply by state governments in the State Development Loan (SDL) auctions has led to a widening tenor spread at the longer end of the sovereign curve. In response to these, the H2 borrowing calendar has been tweaked to reduce long-end supply. While some of the factors can adjust as the deposit rates in the banking sector stay lower, addressing the demand gap is crucial to enable a lowering of term spreads. At the same time, real rates on sovereign bonds remain very compelling.
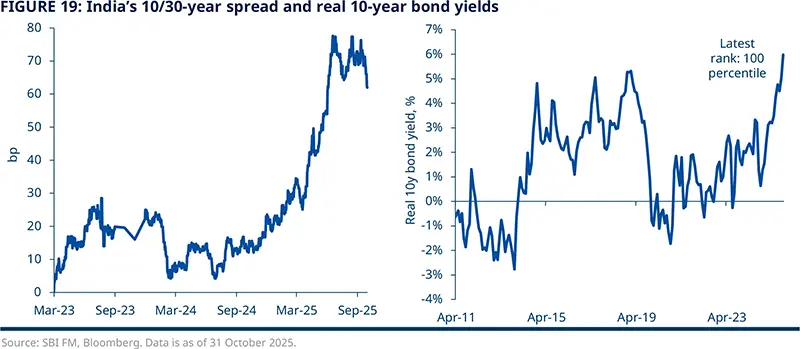
SDL issuances have been broadly in line with expectations in the first half of the fiscal year, with a larger duration supply leading to higher term spreads on sovereign securities. Lower Q3 borrowing has been announced even as expectations remain for a higher calendar in Q4. This is likely to keep SDL spreads high and provide reasonable investment opportunities, especially at the shorter end of the curve (10 year and below).
On corporate bonds, AAA bond spreads have remained elevated at the shorter end compared to recent history. While spreads remain modest on a long-term comparison, the emerging supply outlook is relatively favourable. Corporates benefit from better rates in the loan market, especially among the high-grade names and the supply has been fairly in line with demand. This trend may stay in the near term. Nuances on taxation-related demand shortfall has kept 3-year and below spreads elevated in an environment that has been traditionally spread supportive, e.g., excess liquidity and modest supply. The amendment to MF Debt taxation in 2023 has kept flows into bond funds muted.
Sustainable debt market
One area of India’s bonds market which has experienced remarkable expansion in recent years is the sustainable debt market, including both bonds and loans, which was propelled by supportive government policies, rising climate-positive capital expenditure by corporates, and growing commitments from investors and financial institutions towards sustainable finance. This momentum reflects a broader shift in India’s financial ecosystem toward ESG-aligned instruments.
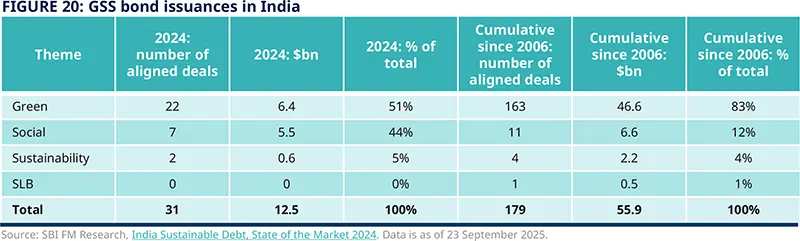
According to data from the Climate Bonds Initiative, India raised a cumulative $55.9bn in GSS+ (Green, Social, Sustainability, and related) debt by end-2024, a 186% increase from 2021. A total of 76 Indian issuers executed 179 deals, contributing 1% to global volume. In 2024 alone, deals worth $12.5bn were priced, a 25% decline from the $16.7bn recorded in 2023, which had been boosted significantly by a $7bn green loan from ReNew Power. Green bonds dominate, accounting for 83% of India’s cumulative aligned volume. The standout performer is the Indian sovereign green bond programme. Globally, India now ranks as the 18th-largest source of aligned GSS+ debt and the fourth-largest among EM, following China ($555.5bn), South Korea ($339.2bn), and Chile ($65.2bn).
Seven social bonds in 2024 added $5.5bn, lifting cumulative social-bond volume to $6.6bn. Non-Banking Financial Companies (NBFC) also raised $1.8bn in social loans during the year.
In June 2025, the Securities and Exchange Board of India introduced a comprehensive ESG Debt Securities Framework, expanding regulation beyond green bonds to include social bonds, sustainability bonds, and sustainability-linked bonds (SLB). This framework mandates enhanced disclosures, third-party verification, and alignment with global standards. Simultaneously, the RBI supports the market through its issuance calendar, which includes Sovereign Green Bonds (SGrB) across various tenures. These regulatory developments aim to boost investor confidence, prevent greenwashing, and align India’s sustainable finance ecosystem with international benchmarks.
Box 3: Climate transition: regulatory developments Under the Paris Agreement, India pledged to cut emissions by 33–35% and achieve 40% non-fossil power capacity by 2030. Both targets were met early. In 2022, India advanced its Nationally Determined Contributions (NDC) to a 45% emissions intensity cut and 50% non-fossil capacity by 2030. Now, India needs an estimated $10.1tn from 2020 to 2070 to reach Net-Zero. Conventional capital may provide $6.6tn, leaving a $3.5tn gap. To bridge this, India requires a total of $1.4tn in investment support, with the rest to be funded by private and institutional markets. Following are the areas where significant initiatives have been taken and sustainable investment is needed: 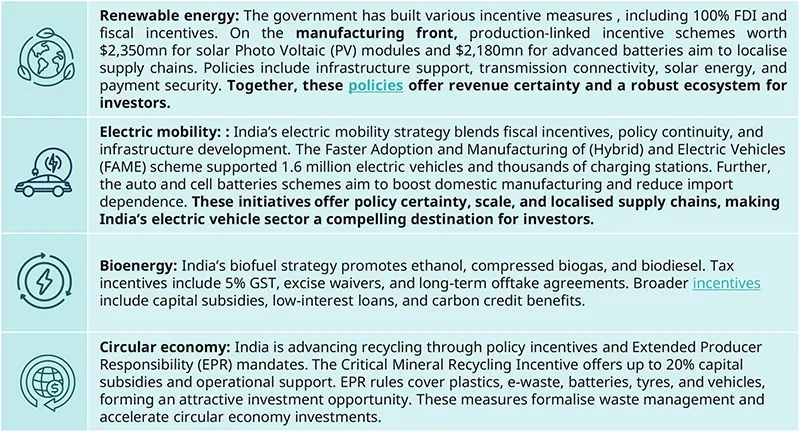
|
Sources and assumptions
Sources of CMA
CMA: Amundi Asset Management CASM Model, Amundi Asset Management Quant Solutions and Amundi Investment Institute Teams. Macro figures as of the latest release. The starting simulation date is 30 June 2025. Equity returns based on MSCI indices. Reference durations are average figures. Returns on credit assets are comprehensive of default losses. If not otherwise specified, expected returns are geometric annualised average total returns at the specific horizon. EM debt HC, EM-GBI, global infrastructure and hedge funds are in USD, all other indices are in local currency. Returns are nominal and gross of fees, except private equity which are net of single manager fees. Real estate refers to all property unlevered real estate. Hedge fund returns represent the expectations for a diversified aggregate of Funds of Hedged Funds are gross of Fund of Funds fees. The expected returns consider the market beta and the alternative assets risk premium. The alpha return component generated by portfolio management, strategy selection or specific value creation programmes, which can be significant above all for real and alternative assets, is not considered in any form.
The arithmetic average returns are derived using the price generated by our simulation engine. By definition, the arithmetic mean is always greater than or equal to the geometric mean. In particular, higher volatility of returns and higher frequency of returns and/or a longer time horizon will increase the difference between the two measures.
Simulated volatilities are calculated on simulated prices over a 10-year horizon. Simulated volatility for alternative assets is derived from unsmoothed return series. Hence, this measure of volatility will be different from the one obtained from realised IRR.
Expected returns are calculated using Amundi central scenario assumptions, which include climate transition. Forecast and fair values up to a 3-year horizon are provided by the Amundi Investment Institute Research team (macro, yields, spread and equity).
Forecasts for annualised returns are based upon estimates and reflect subjective judgments and assumptions. These results were achieved by means of a mathematical formula and do not reflect the effect of unforeseen economic and market factors on decision-making. The forecast returns are not necessarily indicative of future performance.
Data sources: Bloomberg, Cambridge Associates, Global Financial Data. Edhec Infra, MSCI and MSCI Burgiss.


Author