
Summary
Key takeaways
|
Introduction
Navigating an evolving regulatory landscape, insurers worldwide face a crucial challenge: how to efficiently manage the capital required to support equity investments without sacrificing potential returns.
In Europe, the Solvency Capital Requirement (SCR) defines the capital insurers must hold to cover unexpected losses with 99.5% confidence over one year.
Many Asian markets use risk-based capital (RBC) frameworks inspired by similar principles, though exact methodologies and nomenclature vary.
Equity-risk SCRs or equivalent capital measures play a pivotal role in shaping solvency ratio, portfolio allocation and strategic investment decisions globally.
Approved hedging tools and risk mitigation techniques in several jurisdictions enable insurers to reduce capital charges while maintaining market exposure.
In this paper, we explore the Targeted Equity SCR strategy, a structured overlay using derivatives to dynamically manage equity SCR within a pre-defined range. We examine its key features, variations and benefits through case studies.
I. Managing equity risk under risk-based capital frameworks
1) Solvency II and Global Risk-Based Capital frameworks
Since the implementation of Solvency II in 2016, European insurers have operated under a harmonised risk-based capital framework1 designed to strengthen resilience and ensure a consistent approach to risk management across the industry.
At its core is the Solvency Capital Requirement (SCR), which ensures insurers maintain sufficient capital to meet obligations with a 99.5% probability over a one-year horizon. The Market SCR, a key component, captures the potential impact of financial market movements, including equities, interest rates, credit spreads, currencies and property values.
Globally, similar risk-based capital (RBC) regimes have been developed or refined across Asia and other regions.
Frameworks for measuring the market risk exposures - such as the Prescribed Capital Amount (“PCA”) in Hong Kong, RBC Risk Charge in Singapore, Capital Charge in Malaysia, Minimum Capital Requirement in Mainland China, Risk Amount in Korea and Risk Capital Amount in Taiwan - share the same core principle: aligning capital requirements with the underlying risk profile of insurers’ balance sheets.
For simplicity, we will use “SCR” hereafter as a generic term for these risk-based capital requirements.
Similar risk-based capital (RBC) regimes have been developed or refined across Asia and other regions.
2) Equity risk: a significant driver of market SCR
Across global insurance markets, equity risk SCR consistently emerges as a major driver of overall market SCR.
For instance, in the UK life sector, equity risk accounts for 24% of the undiversified market SCR (Fig. 1).
By comparison, for the top five Singapore life insurers ranked by total premium income in 2024, equity risk represents a substantially higher share - between 52% and 64% - of the total undiversified market SCR in their Singapore life participating funds2.

Markets preparing to transition into more stringent RBC frameworks find the equity risk charge particularly onerous.
For life insurers in markets such as the UK and Singapore, equity risk SCR may feel less daunting, as they have already adapted to the “upgraded” RBC regimes over the past several years.
In contrast, markets preparing to transition into more stringent RBC frameworks find the equity risk charge particularly onerous.
Take Malaysia, for example:
The country will move to RBC 2 next year, with stress scenarios recalibrated from a 75% to a 99.5% VaR confidence level. This change will result in a 75% increase in the capital charge for equity investments in developed markets3.
While some insurers may react instinctively by cutting equity exposure, for insurers operating in jurisdictions where risk mitigation effects are recognised within the capital framework, a more strategic approach may be advantageous.
One such approach is the targeted equity SCR strategy. These strategies are designed not only to mitigate the heightened equity risk charge for insurers entering new RBC regimes but also to boost capital efficiency for those already operating under upgraded frameworks.
II. What are the targeted equity SCR strategies?
The targeted equity SCR strategies are structured approaches designed to keep an insurer’s equity SCR within a pre-defined range, thereby mitigating or optimising the capital required for equity exposure.
These strategies typically employ derivatives, such as put options (right to sell an asset at an agreed price, called the strike, within a certain period) or put spreads (buying a put option at one strike price and selling another put option at a lower price), at carefully selected price points (strike levels) to either reduce the SCR or maintain it within the targeted range.
The targeted equity SCR strategies are structured approaches designed to keep an insurer’s equity SCR within a pre‑defined range.
1) How does it work?
The targeted equity SCR strategies usually combine two complementary components: a protection leg and a financing leg.

a. The protection leg – managing the downside
The protection leg is designed to reduce equity SCR while still allowing participation in market upside. This is achieved mainly through the use of listed equity options.

In this structure, the portfolio buys a put option (e.g. with a 90% strike). This provides full downside protection below that strike. If the market drops sharply, the put increases in value, offsetting losses on the underlying equities.
However, this comes at a cost, in the example, the premium is 4.6% of the portfolio value. While it effectively removes most of the equity SCR, it can be relatively expensive to maintain systematically
The protection leg is designed to reduce equity SCR while still allowing participation in market upside.
| Practical illustration: impact on portfolio and SCR |
Assume that on 8 August 2025, the strategy purchases:
This strike level provides 80% downside protection (since 456 = 80% of the current price). Under an RBC regime requiring a 50% equity shock:
|

The trade‑off is that protection is capped below the lower strike, meaning extreme downside losses are not fully hedged.
A long put spread is a more cost efficient form of protection. It involves buying a put option near the current market level (e.g. 90% strike) and selling a deeper out-of-the-money (further below the current market level) put (e.g. 70% strike) in exchange for limiting protection beyond a certain threshold.
The long put provides the protection against moderate market declines, while the short put generates premium income, which reduces the overall cost of protection structure.
The trade-off is that protection capped below the lower strike, meaning extreme downside losses are not fully hedged.
In the illustration, the cost falls to 3.2% representing a meaningful saving compared with a full long put.
This approach is often relevant for insurers who want to reduce equity SCR exposure cost effectively, while accepting a measured level of tail risk in exchange for improved capital efficiency.
b. The financing leg – Financing the protection

A short call generates a premium income that reduces the net cost of the strategy, with the trade off capping potential gains above a predefined level.
The protection comes at a cost (the option premium). To help partially offset this, the strategy can include a financing leg, such as selling a call option (short call) above the current market level (e.g. 105%).
A short call generates a premium income (here, 0.5%) that reduces the net cost of the strategy, with the trade-off of capping potential gains above a predefined level.
This illustrates the fundamental balance in option-based targeted equity SCR strategies between cost efficiency, downside protection and upside potential.
A one‑size‑fits‑all hedge rarely delivers the desired outcome.
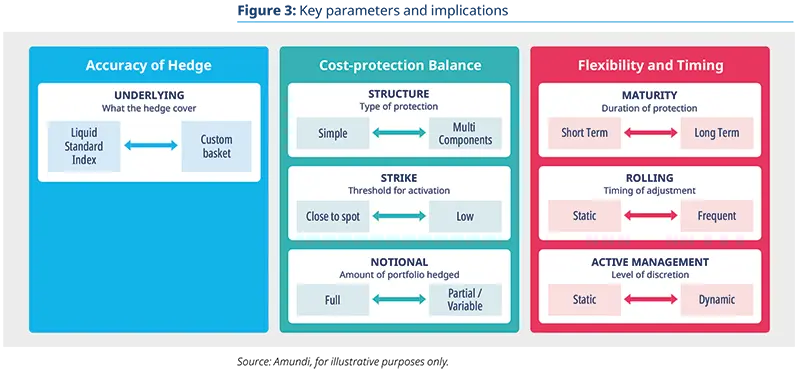
2) Key customisation parameters
A one-size-fits-all hedge rarely delivers the desired outcome. The real value of a targeted SCR strategy lies not only in its conceptual design but in its ability to effectively reduce the SCR and to be precisely calibrated to the insurer’s portfolio, risk profile and regulatory objectives.
Each targeted SCR strategy incorporates a set of key customisation parameters that determine:
How protection behaves under different scenarios
How closely it aligns with the portfolio’s exposure
When the hedge activates
How much of the portfolio is covered and
How the hedge evolves over time
Selecting the right index is critical for effective risk mitigation, regulatory recognition and accounting treatment.
a. Aligning the hedge with the portfolio: underlying
The underlying refers to the market index or basket on which the options are based to reduce equity SCR. Selecting the right index is critical for :
Effective risk mitigation, ensuring the hedge aligns closely with the portfolio market exposures
Regulatory recognition, such as risk mitigation effect under RBC frameworks and
Accounting treatment, including eligibility for hedge accounting under IFRS9.
In practice
In many cases, a standard equity index with liquid options, such as the S&P 500 or Euro Stoxx 50, often provide sufficient hedge.
However, if no liquid options are available (e.g., MSCI World High Dividend) or if the actual portfolio exhibits a high tracking error relative to the chosen index, a customised basket of indices may be required.
This tailored approach ensures the overlay accurately reflects the portfolio’s specific risk profile and characteristics, rather than relying on a generic benchmark.
b. Cost protection balance: structure, strike and notional
Structure
The structure defines the specific combination of two legs used in the strategy:
Simple structures typically involve straightforward protective positions such as buying Put options to hedge against downside risk and cap the maximum desired equity SCR,
Or more complex structures which can combine different option positions. For example, a Put Spread involves buying a Put, selling a Put at a lower strike (creating a Put Spread). The premium received from the short put helps offset the cost of the long put, reducing the overall protection cost. However, this also limits protection beyond the lower strike, effectively setting the lower boundary of the equity SCR range.
Strike (level of protection)
The option’s strike price determines the level where protection starts.
A strike price near the current market value provides tighter, earlier protection, resulting in greater SCR reduction - but at a higher cost.
Conversely, a strike price further from the market level (the spot) reduces cost but allows bigger losses and larger SCR before protection kicks in.
Strike levels can be expressed in different ways:
For some investors, it is easier to talk in moneyness (how far from the spot6 your option is).
E.g. 90% put, meaning protection starts 10% below the current market level (the spot).
Nevertheless, some more advanced investors would prefer to talk in terms of Delta (a measure of the option sensitivity to price changes), as the level of protection will vary depending on the volatility of the market.
E.g. 25% delta put7, meaning if the underlying asset’s price changes by $1, the put’s price is expected to change by $0.25, all else being equal.
Notional (amount covered)
The notional defines the proportion of the portfolio that is hedged:
100% coverage provides full protection, but typically at a higher cost due to the larger amount of protection purchased.
Partial coverage involves hedging only a portion of the portfolio. This approach reduces the overall cost of protection since fewer instruments are needed, but it also means that the unhedged portion remains fully exposed to market fluctuations and potential losses.
Similar to the strike level, the notional amount is a key parameter in controlling the equity SCR range. By adjusting the notional, investors can balance cost efficiency with the desired level of capital relief.
c. Flexibility and timing: maturity, roll and active management
Maturity (option’s duration)
It’s the option’s duration:
Shorter maturities allow more frequent adjustments to market conditions, can react well during market downturns, but have higher transaction costs and are more affected by the passage of time.
Longer maturities offer greater stability and lower transaction costs but have a higher premium and may react slower to sudden market changes.
Note: Under certain RBC regimes, the recognised mitigation effect is reduced proportionally to their remaining maturity (remaining days to 365). However, if a clear justification is provided that the arrangement will be renewed upon expiry, the full mitigation effect can be maintained.
Roll (timing of adjustment)
It refers to closing an existing option position as it approaches maturity and simultaneously opening a new position with a later expiry date.
This process allows the strategy to maintain protection and keep equity SCR within the targeted range while adapting to evolving market conditions and objectives.
The timing of rolling is typically aligned with the option’s expiration but may also be influenced by factors such as volatility levels and/or efficiency of the existing hedge.
Active management (level of discretion given to the portfolio manager)
The degree of discretion given to portfolio managers can significantly influence the effectiveness of equity SCR management.
Some approaches are fully predefined and static, while others incorporate dynamic adjustments of structure, strike, or notional coverage in response to changes in markets, macroeconomic outlook, and volatility.
| Static vs. dynamic protection |
There are two main ways to implement targeted equity SCR strategies:
This approach allows investors to optimise exposure, take profits on protection when relevant, and react quickly to new risks or opportunities. For example:
While the dynamic approach introduces additional complexity and monitoring requirements, its adaptability can help further enhance the portfolio’s risk-return profile over time compared to a static strategy and help reduce the cost over the long run. |
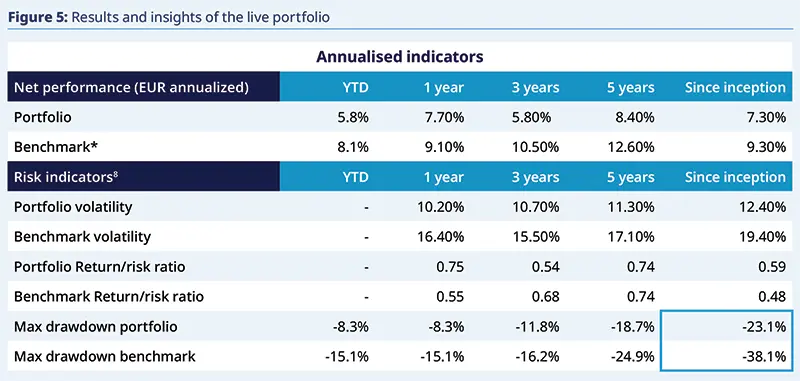
III. A live case study
To illustrate how the targeted equity SCR strategies work in practice, we look at a real-world example of a European insurer we helped optimise its capital efficiency.
Background The insurance company had a EUR 200 million allocation to ESG-focused Eurozone equities and sought to reduce portfolio volatility and drawdowns while keeping the equity SCR within a targeted range of 15% to 25%. Portfolio context The portfolio’s performance was highly correlated with the Euro Stoxx (TMI NR), reflecting broad European equity exposure. To ensure hedge effectiveness, we chose the Euro Stoxx 50 index as the underlying on which the options were based. Strategy overview As illustrated in the Fig. 4 below, we proposed a dynamic approach for active management combining protection and financing leg. The portfolio management had the possibility to utilise put or put spread for protection and had discretion to manage the financing leg. Characteristics of the protection leg:
Characteristics of the financing leg:

Results and insights Although the option cost did drag the portfolio performance relative to the benchmark, the overlay strategy delivered a better risk-adjusted return, has kept the equity SCR within the targeted range and significantly improved capital efficiency. As shown in figure 5 below, key outcomes include:

|
IV. Why It Matters: Key Takeaways
As insurers adapt to more demanding capital regimes and volatile markets, strategies that combine protection, flexibility and efficiency will become central to equity risk management.
The targeted equity SCR approach shows how option-based overlays can be used to limit portfolio losses and reduce equity risk charge while preserving upside potential, allowing investors to stay invested confidently without needing to time the market.
Each implementation is unique, can be customised, and actively managed to balance cost, SCR range and market participation. The next step lies in identifying how such a framework could fit within your specific portfolio and regulatory context.
Strategies that combine protection, flexibility and efficiency will become central to equity risk management.
1. Source: EIOPA “Solvency II – regulation and policy”, Directive 2009/ 138/ EC (Solvency II directives), Commission delegated Regulation (EU) 2015/35
2. Source: Singapore Monetary Authority, “Insurance Company Returns” in 2024
3. Bank Negara Malaysia, June 2024
4. based on the indicative pricing on 8 August 2025
5. based on the indicative pricing on 8 August 2025
6. Spot price or underlying price: The current market price at which an asset can be bought or sold for immediate delivery
7. A 25% delta Put is on average equivalent to a 90% moneyness over the last 20 years, but this number can vary depending on volatility


Authors
