
Summary
Executive summary

Vincent MORTIER
Investors will need to adjust to a paradigm shift away from the accommodative policy stance that has supported financial asset prices, to an environment that should make bonds more attractive while increasing the risk-adjusted required returns for other major asset classes.
Major central banks in advanced economies are continuing the reduction of the large balance sheets acquired since the Great Financial Crisis (GFC). While the Covid-19 pandemic led to a significant acceleration in central bank asset purchases to address pandemic-related lockdowns and disruptions to economic activity, the unexpected rise in inflation has prompted central banks to tighten monetary policy, first by tapering their asset purchases, then primarily through higher interest rates. Now that the policy rate hiking cycle is over or almost over, at least in terms of market expectations, attention could turn to central banks’ balance sheet policies once more.
The Federal Reserve, European Central Bank and Bank of England have embarked on a path to normalise their balance sheets by reducing their asset holdings – primarily in the form of government debt. Investors therefore need to prepare for a shift towards more debt being financed by the market, especially as governments are still running large budget deficits.
Reducing the size of public debt portfolios by halting reinvestment and potentially selling bonds outright presents challenges and should have a significant impact on market yields. In a higher rate environment, central banks may also incur losses on the excess reserves and bonds they hold, although a gradual exit strategy should help mitigate these losses.
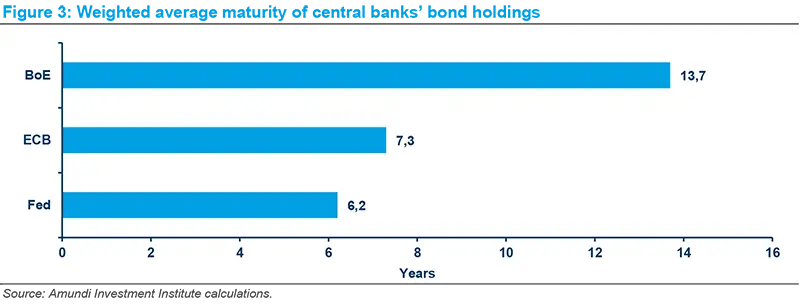
Central banks’ ability to unwind their holdings and the impact of quantitative tightening will also depend on the assets’ maturity profiles and the amount of additional government debt the market needs to absorb. No formal announcement on an endpoint to the unwinding of asset holdings has been made. However, given larger debt markets and higher demand for reserves and cash in circulation, central banks will want to carry larger balance sheets than before.
The prerogative for policymakers will be to unwind their holdings in an orderly way, while governments must recognise that already high levels of indebtedness and less monetary support will limit their fiscal flexibility. Investors will also need to adjust to a paradigm shift away from the accommodative policy stance that has supported financial asset prices, to an environment that should make bonds more attractive while increasing the risk-adjusted required returns for other major asset classes.
Impact of central bank balance sheet normalisation
Central banks (CBs) in advanced economies have started unwinding the large balance sheets amassed since the Global Financial Crisis (GFC). The Covid-19 shock triggered a renewal or acceleration of central bank asset purchases in response to pandemic-related lockdowns and disruptions to economic activity. But with the sudden and unanticipated rise in inflation, monetary policy has been tightened at a record pace, first through the tapering of asset purchases, then primarily through conventional interest rate management.
However, the Bank of England (BoE), the European Central Bank (ECB), and the US Federal Reserve (Fed) have indicated that, over time, they plan to normalise their balance sheets by substantially reducing the assets (primarily government debt) acquired since the GFC, at a time when governments continue to run deficits.
Investors need to prepare for a new paradigm of much more public debt being financed by the market – a marked change from the pandemic period when central banks effectively financed the net issuance of government debt in most jurisdictions. At the end of this process, financial markets will hold a lot more government debt than they currently do.
Whether markets will be able to absorb this debt, and what impact this will have on government bond yields, are pertinent questions, not just for bond investors, but also for the expected returns of other asset classes.
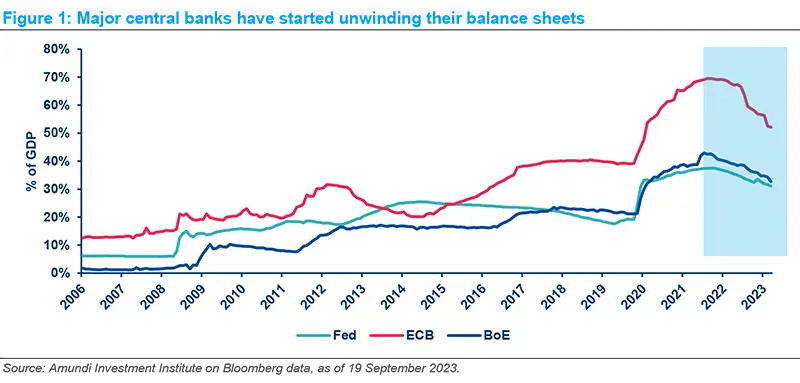
All three major central banks hold substantially larger balance sheets relative to the size of their economies compared to before the GFC, ranging from about 30% of US GDP for the Fed, to 50% of Eurozone GDP for the ECB. More importantly for financial markets, government bonds comprise the bulk of CB holdings. Of the Fed’s USD 8tn balance sheet, close to USD 7.4tn are Treasuries and Mortgage-Backed Securities (MBS).
Composition of central bank balance sheets
Some central banks, such as the ECB, have extended large amounts of liquidity to their banks, but this has shorter maturities and is quickly rolling off. Similarly, their holdings include corporate bonds, which comprise a very small portion and have much shorter maturities. Reducing the size of their public bond portfolios by halting reinvestment and, presumably, selling bonds, will be difficult and will have the biggest impact on market yields.

The pace of monetary policy normalisation
When central banks resorted to quantitative easing (QE) during a protracted period of low (and below-target) inflation, they envisaged a gradual exit from these policies. They could not have foreseen the sudden rise in inflation – well above their targets – triggered by the Covid shock and the Russia-Ukraine war, and the consequent shift to a much more restrictive policy stance. Though they would still prefer a gradual unwinding of QE, they are undoubtedly under some political pressure due to concerns about overly accommodative liquidity conditions and the apparent losses they might incur on their large bond portfolios.
The potential losses (and the corresponding decline in central banks’ annual transfers to fiscal coffers) stem from two sources. First, the losses on their bond portfolios, as interest rates are substantially higher than the coupon income on the bonds they hold. And second, the much higher (policy) interest rates they are now paying on excess reserves of the banking system – reserves largely created by bond purchases.
At market interest rates their notional losses (mark-to-market) would be large. Some commentators have highlighted this loss, while often ignoring the annual profits central banks transferred to governments when interest rates were low (Nugée, 2022). But through a gradual exit strategy, eventual losses would be much lower, as the proceeds of maturing bonds would be reinvested into higher coupon bonds. Recent studies by the US Federal Reserve point to a substantial recovery from current valuation losses – from about USD 500bn to around USD 250bn – based on possible market interest rate paths and higher reinvestment income (Anderson et. al, 2022).
The ECB’s balance sheet provides a good example of the cost of excess reserves conundrum. Banks’ excess reserves held at the ECB currently amount to over EUR 3.6tn, on which the ECB will pay over EUR 100bn in interest this year. This is a little below the Euro system’s consolidated capital position of about EUR 120 billion. Some commentators have therefore suggested unwinding the balance sheet faster to reduce excess reserves or imposing a higher non-remunerated reserve requirement on banks (Gros and Shamsfakhr, 2022). However, both options are unlikely to be pursued in the short term: they would lead to significantly more monetary tightening and most central banks prefer using interest rates as the main tool to deal with inflation.
In principle, central banks can overcome this dilemma because they can operate with negative equity (capital) and because over time they will recover some paper losses through higher interest income. And, in Europe, the national central banks incurring the largest losses (Germany and the Netherlands, for example) will receive higher interest income on their Target21 claims in countries such as Italy and Spain.
To avoid excessive monetary tightening, central banks will likely unwind their asset holdings at a gradual pace. A process that is already underway through reduced reinvestment by the Fed, no reinvestment of maturing APP securities by the ECB (since the second half of 2023), and active sales by the BoE2.
How fast can central banks unload their bond holdings?
How quickly central banks can unload their holdings, and the impact this will have on market yields, will also depend on how much additional debt (net issuance) governments might issue, since that will also have to be absorbed by markets.
How much more debt might governments issue?
To gauge how much additional debt governments might issue we are using the projections for public deficits from the IMF’s World Economic Outlook forecast until 2028. For 2028 to 2033, we assume nominal GDP growth rates and deficit/GDP ratios are unchanged at their 2028 projection. Note that in the case of the United States, this implies quite a high deficit of 7% of GDP per year, and a gross federal debt of around USD 57.8tn in 2033 (slightly higher but comparable to the Congressional Budget Office’s USD 52tn projection). In the case of the Eurozone and the UK, smaller projected deficits mean that the nominal debt will rise less by 2033.
Three case studies: the Fed, ECB and BoE
Unwinding large balance sheets will inevitably be difficult. The pace and scale will also depend on the size of the balance sheets central banks want to hold. Central banks recognise that, given the greater size of debt markets, their frequent market interventions and higher demand for bank reserves and cash in circulation, will mean they will carry larger balance sheets than they did before the GFC (Bernanke, 2017).
In the case of the Federal Reserve, despite no formal announcement on how large the balance sheet should be over the long term, there is a convergence of views that it should allow for ‘ample reserves’, with some illustrative work assuming about 20% of GDP3 10 years from now. Note that this 20% ratio is not usually presented as a stable, ‘steady state’ situation. Even without specific emergencies, central bank assets may need to grow at a different pace from GDP on a structural basis, as central banks’ main liabilities (cash and reserves) may themselves change for various reasons (for instance, banking regulatory changes and practices, or foreign demand for domestic cash).
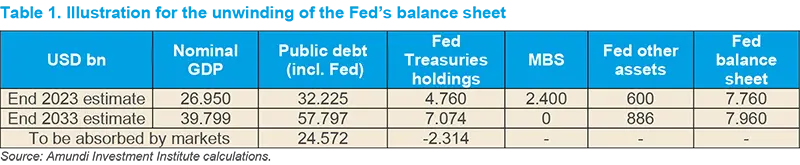
In the illustrative scenario below, we extrapolate the current situation and Quantitative Tightening (QT) flows to assume end-of-2023 numbers. Then, for 2033, we use the 20% of GDP ratio for the total balance sheet. While considerably larger than before the GFC (between 2003-2008 the Fed’s balance sheet was just above 6% of GDP), it is only slightly above where the Fed’s balance sheet was in H2 2019. In terms of composition, we assume the MBS portfolio will be unwound entirely by 2033 (including through active sales) and that assets, excluding MBS and Treasuries, will grow in line with GDP. Finally, we assume that Treasuries will equal the necessary amount for total assets to reach 20% of GDP.
These projections are summarised in the table below. Note that the negative number of Fed-held Treasuries to be absorbed by the market means that the Fed will be a net buyer rather than seller over the whole period (although it will be a net seller at the beginning).
For the European Central Bank there is even less guidance on what might be deemed an appropriate ‘steady-state’ balance sheet in terms of size or composition. On the one hand, holding public government securities is not a part of the ECB’s conventional monetary policy operations. The Eurozone central bank was highly explicit that QE would be temporary, including when challenged by the German constitutional court. Moreover, the ECB might also seek to rapidly reduce or eliminate its inventory of public securities to make financial and political room for potential uses of its new Transmission Protection Instrument (TPI).
‘Central banks recognise that they will carry larger balance sheets than they did before the GFC.’
On the other hand, however, some members of the ECB’s board have suggested they would retain government bonds on a structural (steady state) basis4.
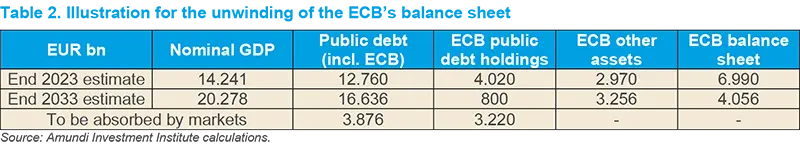
To strike a balance in our simulation, we assume the ECB will retain an amount equivalent to half of the Pandemic Emergency Purchase Programme (PEPP) portfolio, or EUR 800bn, in 2033. The rationale would be to maintain a buffer against various shocks, including maintaining the option to use selective reinvestment to face potential renewed episodes of sovereign stress and fragmentation. We also assume that, in 2033, the balance sheet would amount to 20% of Eurozone GDP, but we acknowledge that this choice is primarily an extrapolation of our assumptions for the Fed, one which roughly doubles the size of the ECB’s balance sheet as a proportion of GDP relative to the pre-GFC period. Other assets are then assumed to be the amount necessary, over and above the EUR 800bn in public securities, to reach 20% of GDP5.
For the Bank of England, we also assume a 20% balance sheet size relative to GDP at the end of 2033, which translates approximately to GBP 760 bn (compared to 5% of GDP before the GFC). We assume that Gilts will be retained in a proportion of around 4% of GDP, or GBP 150bn (proportionally equivalent to the ECB’s EUR 800bn in public securities relative to GDP) and other assets constituting the rest.
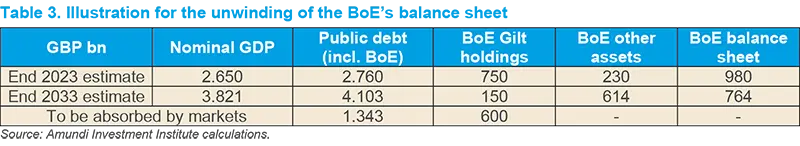
The difference between the three central banks is striking. In the US, the market will have to absorb much larger amounts of debt due to large deficits, with the Fed actually shouldering a small part of the burden over the period. In the Eurozone, lower projected deficits imply the market will need to absorb far less, especially in relation to current holdings, whereas QT flows will represent a large proportion of the net supply to markets (almost on par with deficits). In the UK, QT flows will add to the net supply of public securities to the market, although with a lower proportion than for the Eurozone.
Investment implications
Beyond government debt markets, higher rates for safe assets will lead to lower valuations across other assets (higher risk premia), possibly exacerbated by less abundant liquidity.
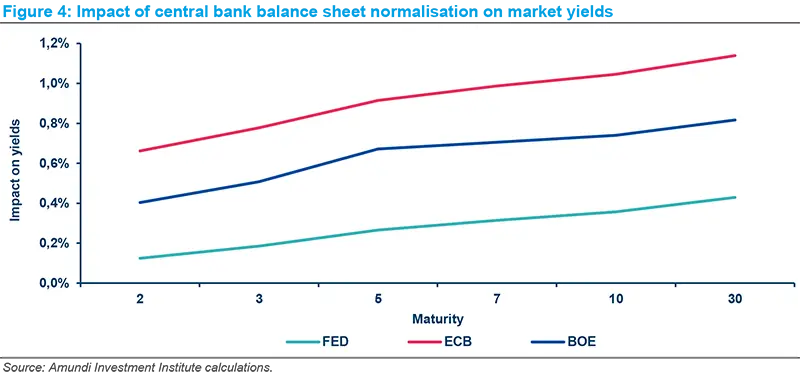
Balance sheet normalisation, combined with prolonged government budget deficits, implies a paradigm shift from an accommodative policy stance that has supported financial asset prices to an environment that will make bonds more attractive over time and increase the (risk-adjusted) required returns for all other major asset classes. Our simulations indicate markets will be able to absorb the extra supply of government bonds. In the US, this may raise 10-year yields by about 40bps, and by around 100bps in the Eurozone (and will also have an effect on sovereign spreads, which would be smaller should the ECB choose to retain more government bonds)6. The impact on near-term yields will be smaller: 2-year yields will be less than 20bps higher in the US, over 60bps higher in the Eurozone, and around 40bps higher in the UK.
This relatively sanguine view, however, does rest on some important caveats. First, that central banks normalise in an orderly way, taking market conditions into consideration in order to determine how much to sell each year. And, more importantly, governments recognise both the high debt they are carrying as a result of recent shocks, and the reduced space for fiscal manoeuvres. Central banks won’t be in a position to underwrite fiscal excesses in a higher inflation environment, and within the Eurozone, countries with bigger debt burdens will see a larger increase in their borrowing costs. Finally, our simulation does not account for possible second-round effects, for example, tighter fiscal constraints leading to lower growth.
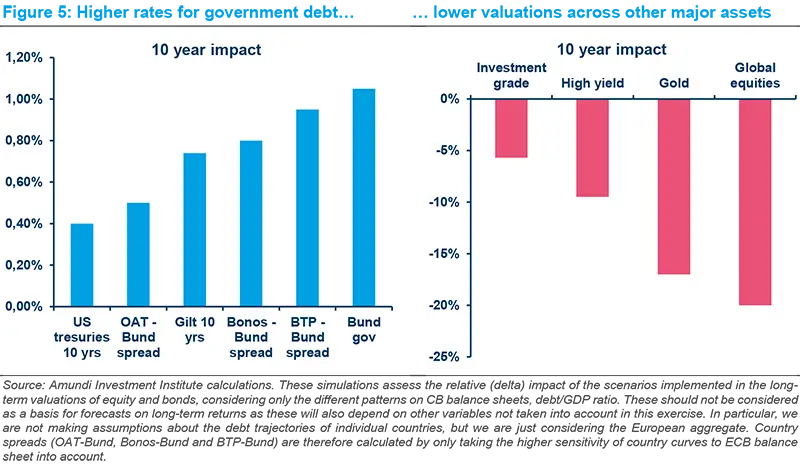
Beyond government debt markets, higher rates for safe assets will lead to lower valuations across other assets (higher risk premia), possibly exacerbated by less abundant liquidity (with less leverage). But here, too, we expect a gradual adjustment. The cumulative valuation adjustment over the next 10 years may be around 20% lower for global equities, 10% for the global high yield segment, 6% for investment grade credits, and 17% for gold. All of these could, of course, be offset by higher productivity and stronger growth.
This analysis suggests that central bank balance sheet normalisation should be manageable. More debt in market hands will raise rates together with some degree of yield curve steepening and will weigh on the valuation of risky assets. But a 10-year horizon to unwind these balance sheets should be ample time for markets to absorb the extra debt. Moreover, higher interest income over such a long period will more than offset the small capital loss as rates gradually increase. This new higher-yield environment is already generating strong demand from investment institutions that need to lock in higher long-term income to match their longer-term liabilities.
Pressure on governments to address competing demands in light of tight fiscal constraints and high public debt will cause more volatility for rates markets. Many governments will also be constrained in their ability to deal with economic shocks through countercyclical fiscal policies, adding to the volatility. For equities, higher yields on safe assets should depress returns. But over an extended period, these could be offset by higher productivity, more sectoral differences in returns and any sustained changes in the shares of capital and labour in value added. However, compared to the accommodative policies of the QE period, there will undoubtedly be less indiscriminate appreciation of asset prices. Investors and markets will likely focus more on fundamental analysis and sectoral shifts stemming from technological and productivity changes.
How confident can we be about this analysis and our estimates of the market impact? Central banks could of course cut back their balance sheets at a different pace. But, barring the very aggressive selling of assets in a much shorter time frame, we do not expect a material change to our estimates. The larger uncertainty stems from how much central banks decide to hold in the steady state, in countries where debt projections are high. This is where the US stands out. Unlike the Eurozone and the UK, the market will need to absorb a lot more newly issued debt from the US government.
Compass
For a short overview, click on the article below:

Central banks’ unwinding will put more public...
Sources
1 Target 2 Claims among NCBs (National Central Banks) within the Euro zone are created by cross-border flows in central bank money, corresponding to the settlement of cross-border transactions that are in most cases initiated by private entities.
2 At at end September, the Fed’s maximum monthly reduction pace was USD 60bn in Treasury securities (maturing Treasuries or T-bills) and USD 35bn in MBS, with no active sales. Since the start of its QT in June 2022, the Fed’s Treasury Securities portfolio has been reduced by c. USD 810bn (or 14% of the total) and its MBS portfolio by c. USD 260bn (or 10% of the total). The ECB has stopped reinvesting maturing APP securities but is not engaged in active sales. It has unwound c. EUR 120bn of government bonds since the beginning of its QT in March, or 3% of the total (including PEPP). The BoE was engaged in a combination of no reinvestment and active sales and has just stepped up its planned reduction pace to a total of GBP 100bn in Gilts between September 2023 and September 2024. (Since the beginning of its QT in February 2022, it has reduced its Gilt portfolio by c GBP 100bn, or around 11% of the total, and disposed of the vast majority of its corporate bond portfolio).
3 See for instance: Federal Reserve Bank of New York (2023); Congressional Budget Office (2023); Crawley et. al (2022).
4 Isabel Schnabel mentioned “a larger steady-state balance sheet, potentially including a structural bond portfolio” in her ‘Monetary policy tightening and the green transition’ speech at the International Symposium on Central Bank Independence, Sveriges Riksbank, Stockholm, 10 January 2023.
5 Isabel Schnabel also mentioned that once excess liquidity is absorbed, the Eurozone’s balance sheet may still need to be about three times the size it was in 2007, during her speech at an event organised by Columbia University and SGH Macro Advisors, New York, 27 March 2023. This amounts to EUR 3.6tn, which is not fully inconsistent with our EUR 4tn assumption for 2033.
6 Simulations are based on the Nelson Siegel (NS) methodology and proprietary tools, https://research-center.amundi.com/article/advanced-investment-phazer-guide-dynamic-asset-allocation. This approach for valuing bonds follows two steps: first, we use the NS model to identify the factors that determine the yield curve. Then, we model each factor using consistent macro-financial variables, which allows for robust and consistent valuations across maturities and the slope of the yield curve. See Nelson and Siegel (1987), and Diebold and Rudebusch (2013).


Authors