
Summary
Executive summary
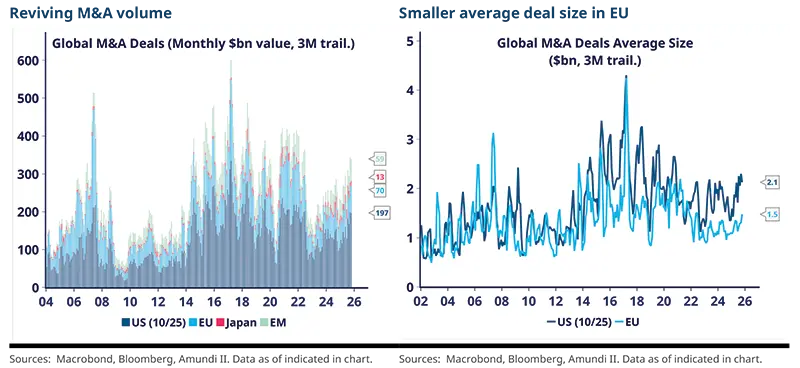
Deal flow is back: global M&A has resumed after a pause, reopening a larger investible universe for merger arbitrageurs.
In the US, vanilla deals dominate, producing more moderate spreads. In Europe, deals concentrate in mid-market, which offers a juicer playing field, with higher and more dispersed spreads.
The M&A rally has legs, supported by macro and credit conditions. Besides, external growth is once more an appealing option for companies, which are showing more animal spirit, while private capital, under pressure to put dry powder to work, add fuel.
Beyond surging acquisition volumes, the pipeline of deals appealing to arbitrage should sustain alpha generation, supported by a healthy flow of complex operations, few breakups, diversified maturity and risk profiles, and more navigable regulations.
From an allocation perspective, the merger strategy delivers valuable diversification, with returns comparable to fixed‑income markets but driven by fundamentally different factors. Merger risks also differ from bonds.
As a result, merger arbitrage can improve fixed-income portfolios’ risk/reward, thanks to the strategy’s short duration, low correlation to government and Investment Grade bonds, cash carry, and event alpha.
Global M&A deal flow reboot
After couple of years of pause, M&A markets have moved into a more constructive phase. This shift reflects a convergence of cyclical and structural factors that are reawakening both strategic and sponsor appetites to transact.
A worldwide M&A recovery
In the US, greater volume of vanilla deals. The US market has shown a noticeable revival, driven by resilient growth, the cyclical equity rally, deregulation signals, and improved credit availability. Changes in leadership and priorities at the US Department of Justice (DoJ) and the Federal Trade Commission (FTC) is leading to fewer blockages of horizontal deals, faster reviewing timelines, and more room for negotiation. In contrast, strategic deals linked to tech, pharma, and cross-border operations are facing acute scrutiny. As a result, the M&A rebound has been dominated by “vanilla” transactions, including friendly negotiated mergers, cash financed acquisitions, or smaller acquisitions to extend a business line (labelled add-on acquisitions). These deals are simpler in structure – fewer antitrust issues, limited leverage, cleaner financing structures – and more domestic in nature. They therefore tend to be more predictable and often trade at below-average spreads.
Juicier EU opportunities. M&A has revived in Europe too, driven by improving financial conditions, conservative corporate leverage, more involvement from private capital, industry consolidation that are encouraged by authorities, and a pipeline of acquisition plans that were waiting for better conditions.
Furthermore, cheap valuations create a “value-with-catalyst” opportunity, for investors seeking exposure to the European industrial and productivity recovery.
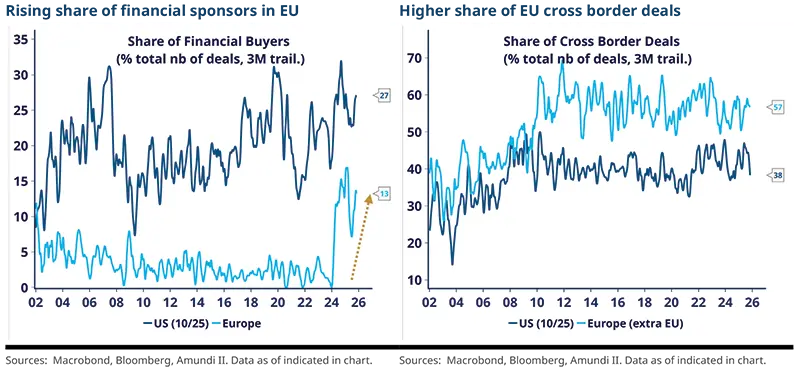
The EU market therefore shows a larger share of mid-market transactions – easier to access and attracting more bidders – as well as cross-border operations across European countries, which are structurally more complex (employee consultation rules, multiple regulatory touchpoints, tax and accounting differences) and more appealing to arbitrageurs. Regionally, deals were led by the UK, followed by Germany, France and Italy.
Why the rally has legs
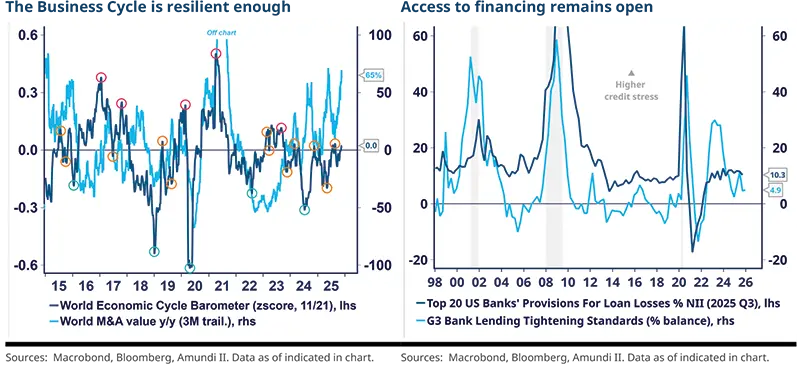
The macro environment is supportive. Global growth has been resilient enough to restore corporate confidence. Inflation has moderated from earlier peaks in many economies, and central banks have signalled or started a conditional easing path. Reduced policy and geopolitical uncertainties and clearer economic visibility are also encouraging executives to shift from preservation toward strategic repositioning.
Credit conditions are constructive. Global liquidity remains benign as well as credit conditions which are still supportive – even though they probably reached a typical mid-cycle gradual deterioration. Reduced banks’ loan provisions for instance imply limited stress. Bank lending and credit access is easing, while primary markets resumed after months of subdued activity – especially for High Yield, leveraged loan, and even IPOs. This is translating into easing funding conditions.
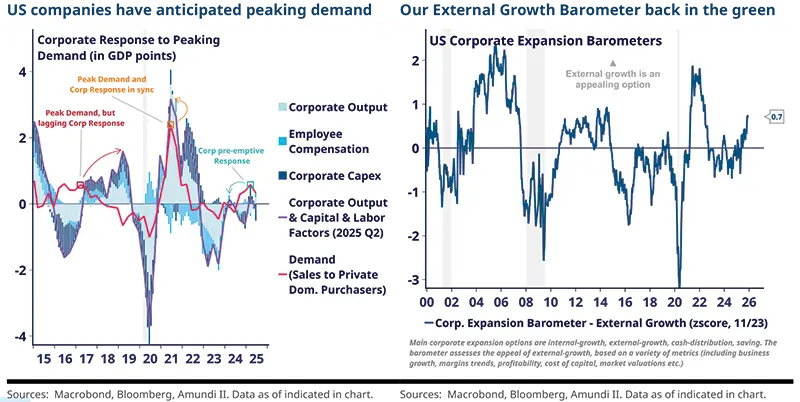
Corporations are in better condition for more activity. When the economy slows, firms that adjust activity quickly suffer less severe impacts. Companies have three key levers to respond to weaker demand: cut output, trim capex, or reduce costs – and as last resort, shrink their balance sheet via asset sales or restructuring. Our analysis shows the corporate sector in the US has pre-emptively been cautious ahead of moderating demand in 2025, as shown in the left below chart, which tracks demand compared to production factors, broken down per levers. By scaling down capex and production in advance, they now have greater room to expand.
Corporate metrics suggest they are ready for external growth. Our Corporate Expansion Barometer – that tracks corporate cash, leverage, capex, organic profitability, market affordability etc. – suggests external growth is an appealing option once more, primarily for add-on acquisitions and, increasingly, for larger transformational deals. In parallel, capital expenditure remains polarized, rising in industries investing in digitalization, AI, energy transition and supply chain resilience, subdued otherwise. Companies pursuing capex along with M&A suggest they expect robust enough demand to absorb integration costs, a sign of confidence.
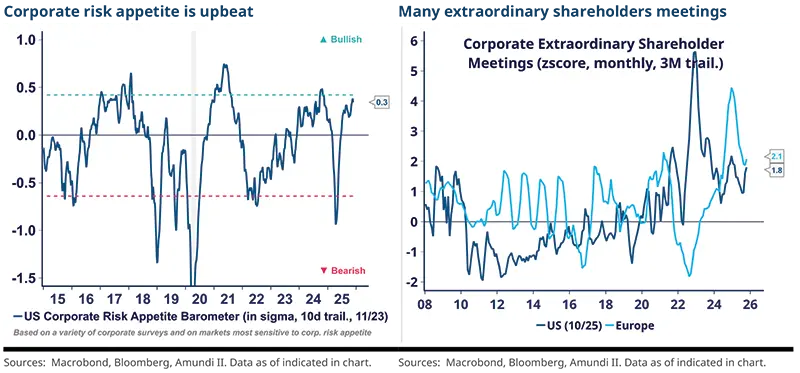
Corporate risk appetite has returned. Boards and CFOs express greater tolerance for transformative operations than in the recent slowdown. Investors – including activists – are also pressing for growth and strategic repositioning, in order to gain scope, scale or technological advantage.
There’s a high number of extraordinary shareholders meetings, where corporate operations are decided (ranging from acquisitions to disposals and governance changes), which bodes well for future M&A volumes.
Private capital dynamics are improving. Private capital remains a central driver of the M&A cycle. Fundraising and LP distributions are gradually resuming. Private players carry elevated dry powder, with growing pressure to deploy it. This is particularly visible in Europe where the share of financial sponsors is growing.
A broad positive backdrop. Taken together, supportive macro conditions, benign credit markets, open capital markets, healthier corporate balance sheets, returning capex, renewed risk appetite, reviving private capital dynamics set favourable conditions for M&A activity. While merger arbitrage returns are driven by the quality of individual deals rather than sheer deal volume, they benefit from a broader menu of opportunities.
A broader menu of opportunities for Merger arbitrageurs
Supportive alpha generation conditions
Beyond the broader uptick in M&A activity, the steady flow of attractive transactions and the current merger‑trading backdrop create supportive conditions for alpha generation.
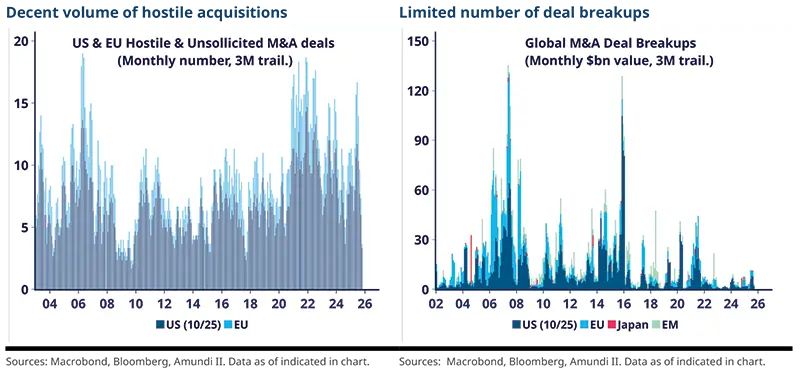
A decent volume of hostile and contested situations increases the probability of bidding wars, which can materially raise opportunities for arbitrageurs. Deal premiums are at healthy, historically normal levels – roughly 30–35% in the US and 25–30% in Europe – which signals sustained buyer demand for targets, decent animal spirit, and likelihood of competitive bidding.
Deal breakups remain scarce, which is boosting expected completion probabilities and limiting downside risks.
Diverse deal maturities both in the US and EU mean that managers can harvest complementary returns: quick, short duration tender arbitrages alongside longer, higher compensated regulatory or financing sensitive transactions.
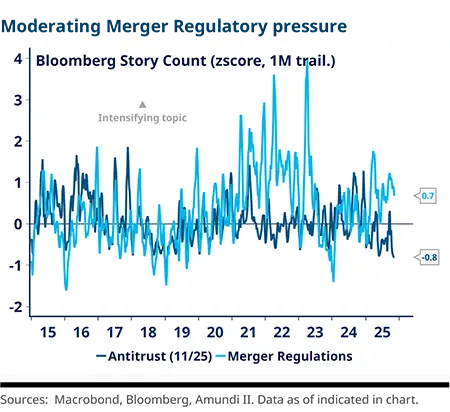
Regulation risk has become more navigable, particularly in Europe. Regulation has been a crucial risk for the strategy over the last couple of years, less so today. The regulatory backdrop is mixed both in the US and EU. In the US, regulators may grant more leeway for domestic deals but also raise the bar for cross border and strategic transactions in sectors like technology or pharma. In Europe, the environment has its complexities but appears easier to navigate. While competition and industrial consolidation remain scrutinized, many EU deals (especially mid-market) face less politically‑charged monitoring than in the US.
Furthermore, European authorities tend to welcome inbound capital, especially for infrastructure and industrial projects, facilitating cross-border operations.
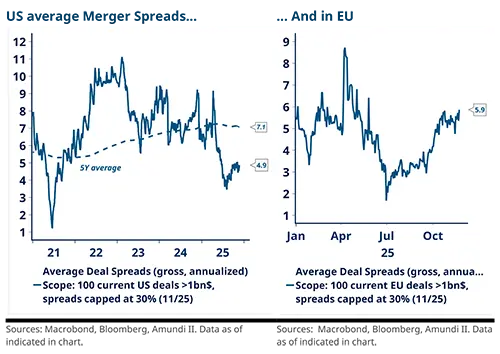
Merger spreads are modest in the US, higher and more dispersed in Europe. Higher deal certainty for vanilla transactions is capping spreads in the US, reflecting narrower arbitrage but improved hit ratio. Spreads are more attractive and more dispersed in Europe, providing better entry points.
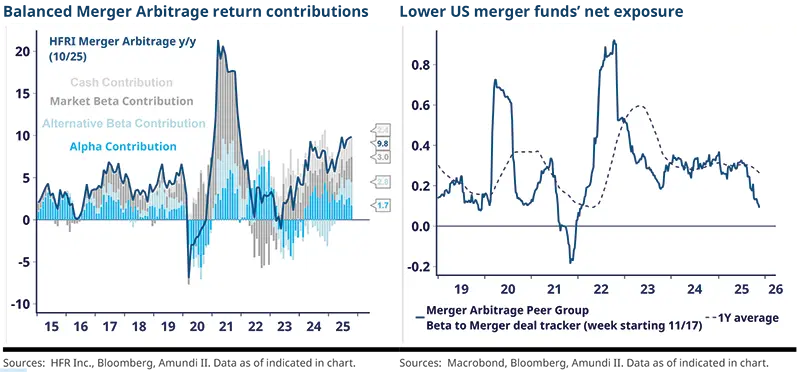
Elevated cash contribution to returns. Because merger arbitrage funds typically hold low net market exposure, they deploy significant liquidity as collateral and for short hedges1. That cash is directly or synthetically earning cash-like yields. The cash carry component – currently in excess of 2% and expected to remain significant for the foreseeable future – directly supports portfolio returns.
Balanced Merger Arbitrage performance contribution. Overall, managers’ returns are evenly driven by the contribution from cash, their merger beta (exposure to the segment), and alpha from deal selection and active positioning. This balance helps produce more robust and less volatile returns.
Managers remain invested but selective: reserving capital for higher conviction US situations, while more actively trading the denser EU market where deal structure and regulatory backdrop provide attractive opportunities.
Europe looks particularly interesting
There’s a planet alignment for European arbitrage. European acquisitions tend to concentrate on more competitive midmarket deals that create both primary and secondary arbitrage opportunities.
Sector diversification is greater than in the US – predominantly focusing on Tech – which helps reduceconcentration risk.
Cheaper relative valuations in many sectors widen the set of plausible targets.
Cross border transactions are encouraged by authorities, keen to attract Asia ex-China, US, or Mideast buyers. The structural complexity of cross border operations generates more appealing spreads. Private capital is also becoming a more powerful driver (especially in infrastructure and real assets), warranting more bidding wars and usually opening more tactical windows for arbitrageurs.
Finally, the merger market in Europe tends to be less efficient than in the US. Lower analyst coverage, heterogeneous accounting/tax treatments, and varying disclosure regimes create mispricings that managers can exploit.
The main drivers of European M&A include the energy transition and sustainability (renewables, grids, midstream services and decarbonization technologies), digital transformation and AI (software, data platforms and industrial automation), private equity activity (deployment of dry powder into buyouts and secondary deals), supply chain resilience and geopolitics (reshoring and nearshoring trends), sector consolidation (healthcare, finance, manufacturing, tech), and financing & valuation dynamics that make external growth an attractive option.
Merger arbitrage: a potent diversifier
Fixed‑Income‑Like Returns, Event‑Driven Roots
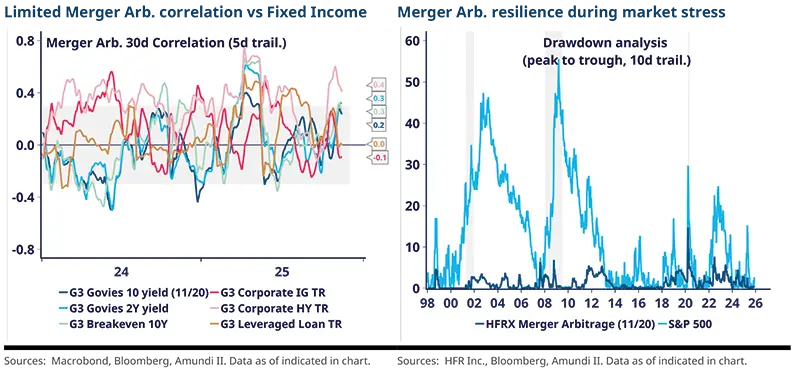
Merger arbitrage can deliver returns comparable to certain fixed‑income strategies, but its return drivers are fundamentally different. Traditional bond returns are driven by interest rates, term premia and credit spreads; merger arbitrage returns are event‑driven, tied to deal spreads, financing certainty, bidder incentives and legal/regulatory outcomes. This divergence in drivers produces low correlations with government yields and investment‑grade credit, and it can improve portfolio risk‑adjusted returns when merger arbitrage is blended into a fixed‑income allocation.
The strategy also focuses on shorter duration as merger positions typically close within months to a couple years. So, the rate sensitivity is lower than long‑dated bonds (i.e. lower duration risk).
Managers may hedge market beta (shorting1 deal targets or broad indices) and apply position limits and scenario hedges (options) to control tail risk. This further lowers the strategy’s correlation to equities and credit.
Merger arbitrage funds typically hold large cash buffers and earn cash yield on that liquidity. Merger Arbitrage can be compared to a blend of cash yield + realised spread capture. When short-term rates are elevated, the cash carry component becomes meaningful.
Finally, the strategy demonstrates limited sensitivity to market volatility, to a certain limit: in sharp market stress, spreads can suffer, amplified by a contagion effect as the pricing of mergers tend to correlate.
Main merger risks differ from other fixed income products
Merger Arbitrage also differ from regular fixed income products in their risks. The main risk for merger comes from broad repricing in deals spreads, which occurs more frequently at sector level, when the corporate backdrop rapidly deteriorates, or when the regulations shift.
Deal breaks – and more commonly, delayed deals or transactions that undergo material renegotiation, because of litigation, shareholder opposition, funding shortfalls, or regulatory remedies – represent a significant risk, particularly when positions are concentrated or under‑hedged. In practice, a few isolated incidents rarely derail a well‑managed portfolio, provided robust risk controls, position limits and contingency hedges are in place.
Equity sensitive risk is another differentiator: stock deals or hedging patterns that introduce directional equity exposure drive higher correlation with equity drawdowns.
Funding risk is important for sponsor led and highly leveraged transactions. A sudden credit squeeze can flip deals into a high break risk situation.
Regulatory shocks – sudden changes in antitrust posture, national security focus or state industrial policy, to some extent geopolitics – can also convert probable closures into costly uncertain outcomes.
These risks are, to a large extent, different in nature from duration or spread risk in fixed income, which contributes to the diversification benefit of Merger Arbitrage.
Merger arbitrage, being more event driven, provides appealing diversification
Due to its largely idiosyncratic sources of return, the strategy provides meaningful diversification when combined with a traditional fixed income portfolio.
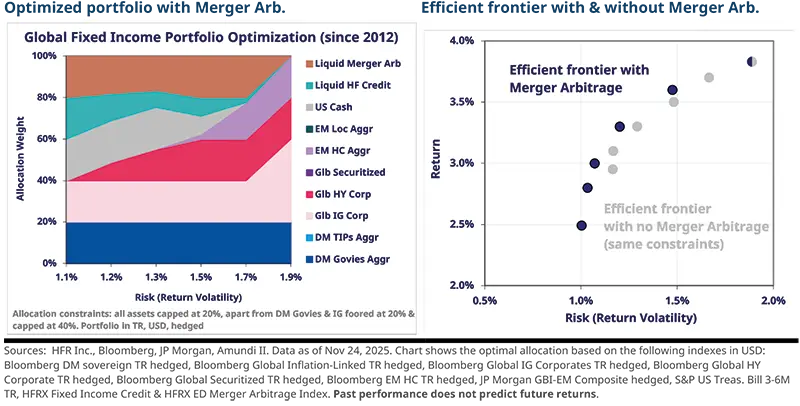
Portfolio optimisation shows that an allocation to merger arbitrage can help improve the efficient frontier. Historical optimisations show that returns rise for a given volatility target, or volatility falls for a given return level. The strategy combines cash-like carry, short duration, and event driven alpha that together reduce reliance on macro drivers. In the chart below, we simulated fixed-income allocations that optimised the risk/reward for US based investors.
These portfolios were submitted to the following constraints: a minimum and maximum government and IG bond weights of 20% and 40%, respectively, and a maximum 20% weight for all other segments, including merger arbitrage. Optimization shows that for investors targeting low to medium volatility, they would have meaningfully benefited from including Merger Arbitrage.
For all these reasons, we have a constructive view on Merger Arbitrage, with a preference for Europe‑focused strategies.
1 The Funds on the Amundi Alternative Platform do not take short positions directly but through the purchase of derivatives within the limits described in the Prospectus and Supplement.


Author