
Summary
Bond yields at the short end of the curve moved up as markets repriced central bank action in response to inflation. Long-end yields rose mainly because of higher risk premium, as the war in the Middle East continues to create uncertainty.
The US 30Y yields rose to 5.19%, the highest from 2007, while the 10Y moved above 4.5%. Yields across Europe and Japan also rose.
Pressure on global long-term bonds has been driven by uncertainty over inflation, monetary policy and fiscal spending.
All these factors support a more nuanced view of fixed income, with a close eye on the evolution of inflation and economic growth.
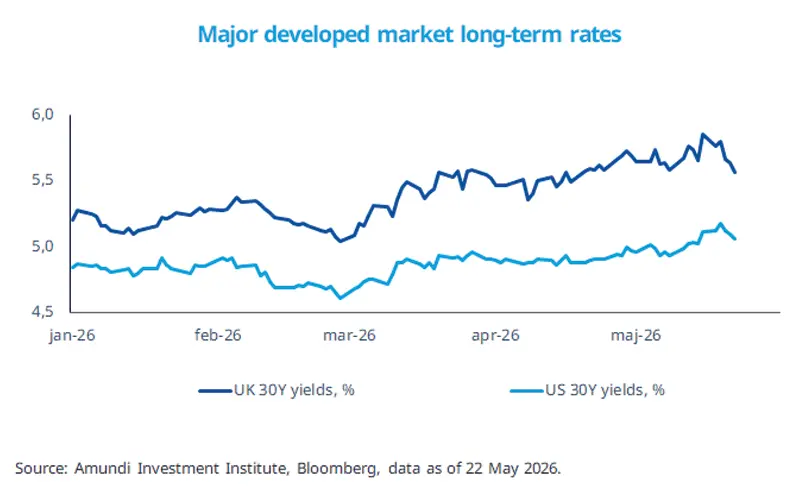
Global yields have risen sharply this year as the Middle East crisis has led to increased price pressures. This, coupled with changing views on central bank policy and persistently high fiscal deficits (the excess of government expenditure over revenues), has pushed long-end yields higher — US 30Y yields have reached their highest levels since 2007–08. Looking ahead, strains on public finances and heavy bond supply could continue to put pressure on yields. On the inflation front, we think the pass-through of the energy shock to the broader economy requires closer scrutiny. The key risk is not only the surge in energy prices, but also how long they remain elevated and their second-round effects on the economy. This is, of course, affecting central bank policy in the near term.
Hence, although we are constructive on bonds, we prefer to express this view differently across the curve, favouring short- and medium-maturity bonds.
This week at a glance
Global equities continued to rise on hopes of a possible deal between the US and Iran to remove the blockade of Strait of Hormuz. Persistent enthusiasm for the success of the artificial intelligence narrative also lifted the sentiment. Bond yields tested their multi-year highs in the first part of the week before eventually easing. The dollar remained unchanged against the euro, while oil prices fell.
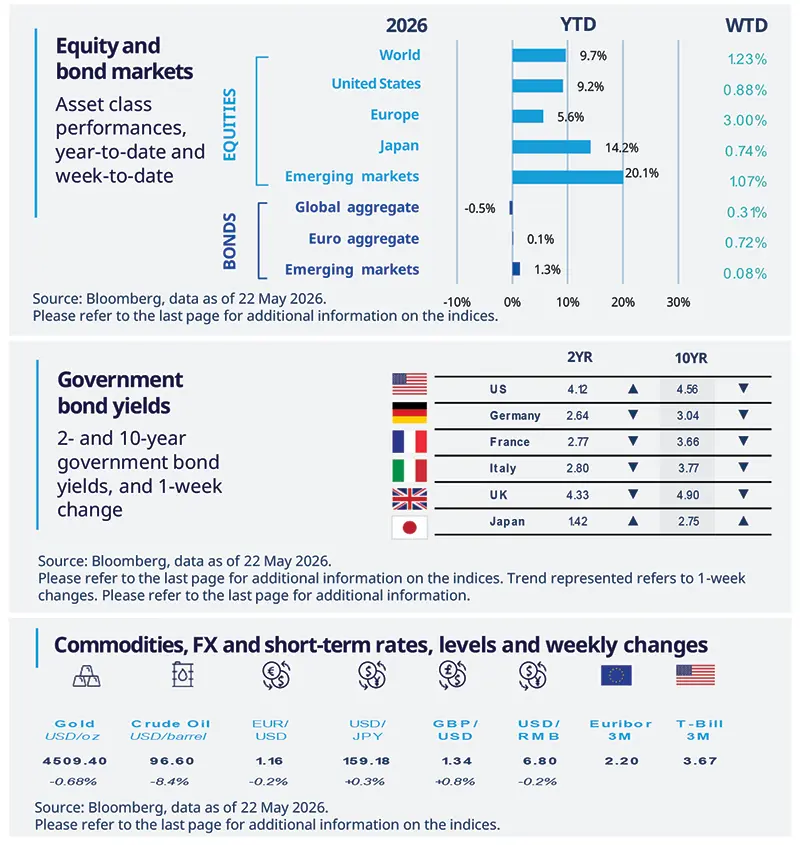
Equity and bond markets (chart)
Source: Bloomberg. Markets are represented by the following indices: World Equities = MSCI AC World Index (USD) United States = S&P 500 (USD), Europe = Europe Stoxx 600 (EUR), Japan = TOPIX (YEN), Emerging Markets = MSCI Emerging (USD), Global Aggregate = Bloomberg Global Aggregate USD Euro Aggregate = Bloomberg Euro Aggregate (EUR), Emerging = JPM EMBI Global Diversified (USD).
All indices are calculated on spot prices and are gross of fees and taxation.
Government bond yields (table), Commodities, FX and short-term rates.
Source: Bloomberg, data as of 22 May 2026. The chart shows the price of gold.
Diversification does not guarantee a profit or protect against a loss.
Amundi Investment Institute Macro Focus
Americas
US PMIs show mixed signals as price pressures build
The US services PMI edged down to 50.9 in May, slightly below expectations, with mixed components: employment declined while new business increased. The manufacturing PMI rose to 55.3, with output and employment improving, though new orders softened. Price pressures intensified in both sectors, as both input and output prices rose further. Expectations for output over the next year fell in services but improved in manufacturing. Overall, both PMIs remain above 50, indicating expansion, but the mixed signals and rising prices suggest demand could come under pressure.
Europe
Eurozone PMI falls as services take the hit
The EZ Composite PMI fell to 47.5 in May, missing expectations. Services weakened sharply, likely reflecting cautious consumers amid the Iran conflict, while manufacturing held up better thanks to frontloaded orders. However, falling new orders suggest this resilience may not last. Input prices continued to rise strongly, but the increase in output prices was much more limited, indicating only partial pass-through. Meanwhile, confidence indicator rose slightly in May, but remains at very weak levels. Overall, weak surveys and collapsing consumer confidence point to stagnation risks in Q2.
Asia
Japan GDP Beats in Q1, But Growth May Slow
Japan’s GDP grew at an annualized rate of 2.1% in Q1, surpassing expectations. Solid performance was supported by moderate growth in domestic demand and a sharp rebound in exports. Private consumption expanded for the fifth consecutive quarter, after nearly stalling in the previous quarter. However, the recent strength in growth has yet to fully reflect the impact of the Middle East conflict. Consumer sentiment has weakened as inflation expectations rise and willingness to spend declines. We expect growth to ease in Q2.
Key dates
US Conference Board Consumer Confidence |
Europe Economic Confidence, US Personal Spending, PCE price index and durable good orders |
Japan Retail Sales and Industrial Production, Brazil GDP Q1 |


Authors