
Summary
Executive summary
This paper explores how lifecycle investing is being remixed for a new era — through more sophisticated glidepath design, greater personalisation, and the expanding role of private assets in retirement portfolios.
Individuals are assuming greater responsibility for retirement outcomes as Defined Benefit pension schemes close and public pension systems come under pressure. Auto-enrolment, default solutions and digital savings platforms have made saving for retirement more accessible, but the central question remains how those savings should be invested over time.
For many savers, particularly those invested through default pension arrangements or without access to advice, the answer increasingly lies in lifecycle investing. Rather than relying on a static asset allocation, lifecycle strategies use glidepaths that adjust portfolios gradually as retirement approaches.
Designing an effective glidepath is therefore not simply a question of reducing risk with age. It requires a multi-period perspective that reflects the evolution of contributions, salary growth, time horizon, retirement needs, and risk capacity over an individual's working life. It must also accommodate practical realities, including behaviour, regulatory and peer group dynamics, and retirement objectives.
In this paper, we explore how to construct a glidepath that balances theoretical robustness with implementation, drawing on our global experience and research in designing retirement solutions across markets and client segments. Alongside glidepath construction, we consider two themes shaping the next generation of retirement investing: personalisation and the expanding role of private assets.
“Lifecycle investing is no longer simply about de-risking with age; it is about aligning each saver’s evolving human capital, risk capacity and retirement goals with a glidepath that can be personalised and, where appropriate, expanded to include private assets".
The logic of de-risking
Why do we want to change risk anyway? Before turning to glidepath construction, it is worth asking why de-risking is such a natural feature of lifecycle investing. In theory, long-term investors may hold a stable mix of risky and defensive assets. Retirement saving, however, is different: wealth is built gradually through contributions, while the time available to recover from losses becomes shorter as retirement approaches. De-risking over time is therefore not just common practice — it is a rational response to the changing nature of the retirement journey.
Table 1: 3 factors that drive de-risking in glidepath design
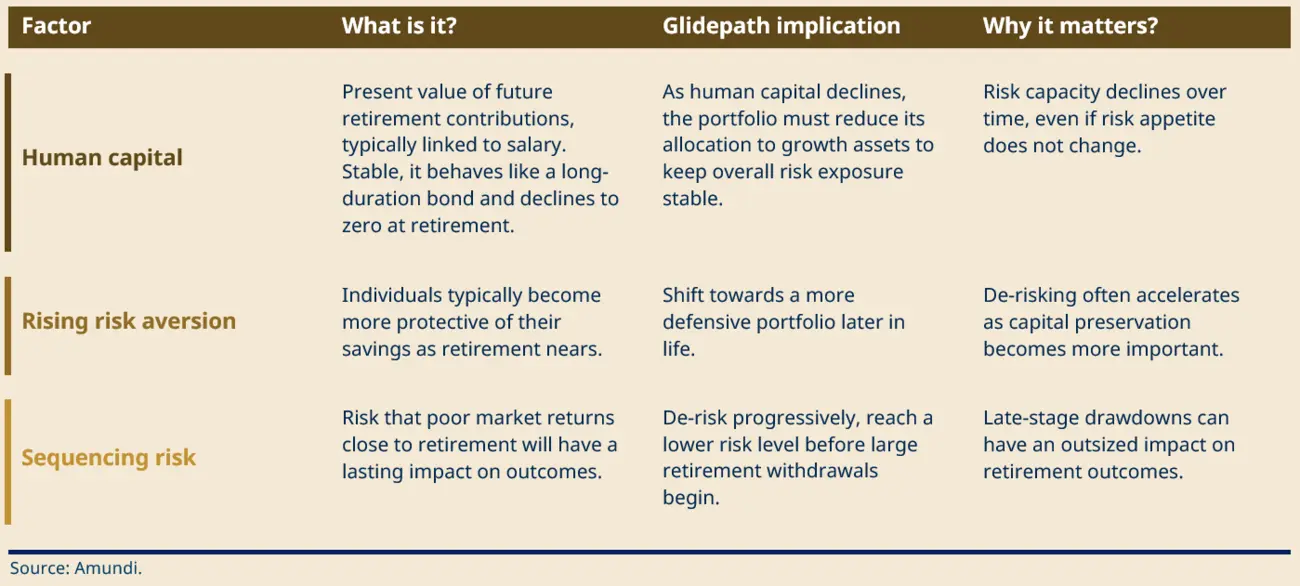
Three forces underlie this shift: human capital, increasing risk aversion, and sequencing risk (see Table 1). Collectively, these factors provide a rationale for the gradual reduction of risk exposure over time. The central design issue is therefore not whether de-risking should occur, but that it should be implemented in a manner consistent with the end investor’s retirement objectives, as well as with the structure of the solution — including its operational implementation and delivery vehicle, such as a pension fund or a platform. This constitutes the starting point for glidepath construction. |
A quick primer on human capital
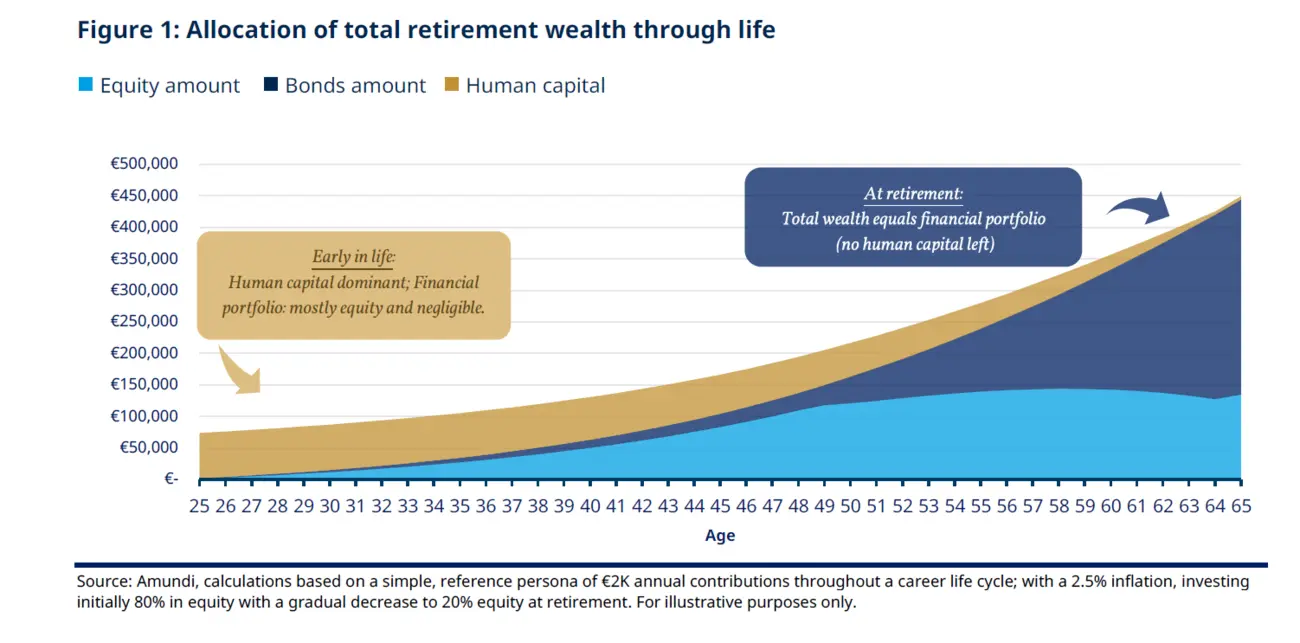
Human capital plays a central role in retirement investing and has been the subject of extensive academic research for decades. Simply put, it represents the present value of the pension contributions an individual is expected to make throughout their working life, driven by their earnings. Early in life, this asset is typically large, relatively stable, and highly bond-like in nature, reflecting the long-term and predictable character of future earnings. As an individual approaches retirement, human capital gradually declines, ultimately reaching zero at the point of retirement when no further contributions are made.
As a result, even when a young investor’s pension portfolio is allocated heavily to equities, their overall wealth may still be dominated by human capital. In this sense, the young investor’s true risk exposure is often substantially closer to that of a bond investor than the financial portfolio alone would suggest.
Figure 1 illustrates this dynamic:
At age 25, total wealth may be around €75,000 and is overwhelmingly bond-like, despite a financial portfolio that is largely invested in equities.
By retirement, total wealth may have increased to around €450,000, but human capital has been fully exhausted, leaving financial capital as the sole component of total wealth.
A framework for glidepath design
Glidepath construction follows four steps: assessing context and constraints, setting lifecycle assumptions and objectives, optimising the allocation path, and testing the outcome across scenarios.
Defining context and constraints
Understanding the context and ecosystem in which a retirement solution operates is a critical first step, as it ensures the design reflects the specific characteristics of each market.
The starting point is to assess whether the glidepath is primarily regulation-aware, peer-aware or objective-led — or some combination of the three.
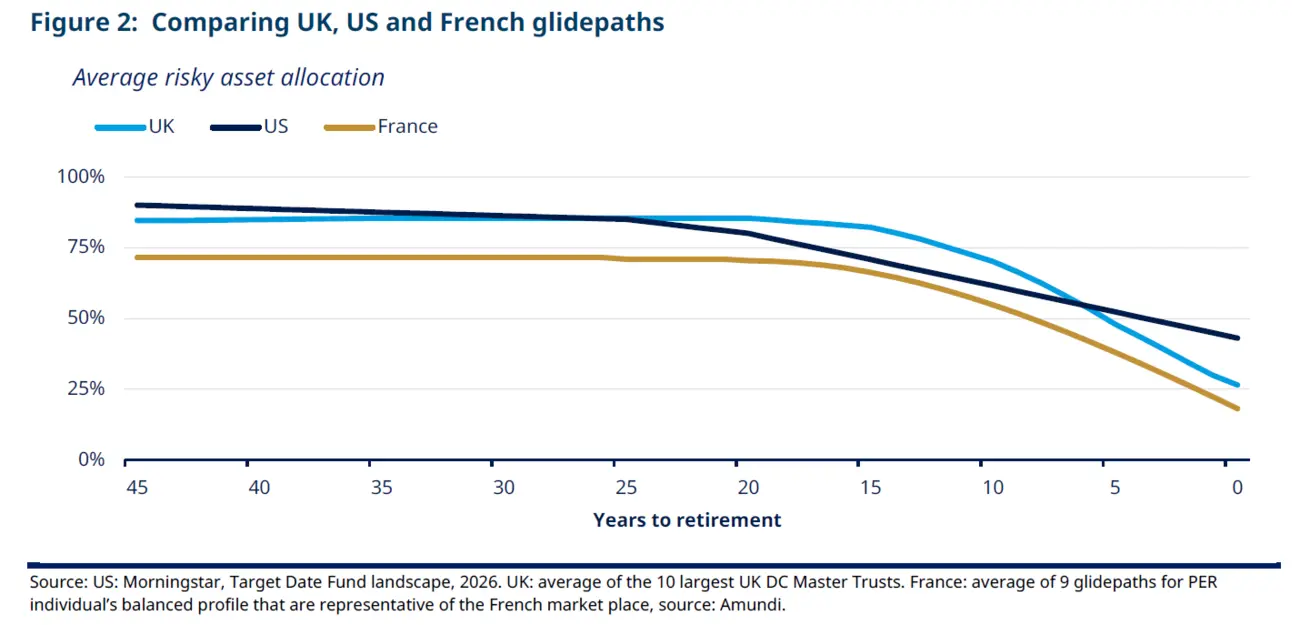
Regulation may impose constraints on glidepath design. In France, for example, third-pillar individual pension schemes are subject to allocation rules that gradually increase the minimum weight of low-risk assets as retirement approaches. Awareness of the local peer group is also important to ensure that the resulting glidepath does not become an outlier. In practice, the timing and pace of de-risking vary substantially across markets.
The chart below illustrates how these differences manifest across countries. In the United States, target-date funds typically begin de-risking relatively early and reduce equity exposure progressively over time. In the United Kingdom, by contrast, many default strategies follow a more linear glidepath, with de-risking generally beginning later than in the US. In France, de-risking follows a similar schedule as in the UK, but starting from a significantly lower level of risk and converging towards a lower risk level at retirement than in either the US or UK.
Set lifecycle assumptions and objectives
The key inputs that shape the design include contribution rates, salary growth, retirement age, life expectancy and risk tolerance. These can be based on population averages or segmented assumptions for different groups.
A representative persona is typically defined to reflect the average salary, contribution pattern, and typical objectives of the target population. Key Performance Indicators (KPIs) used to assess success — such as income replacement rate, retirement pot size, or drawdown sustainability — should also be established at this point, as they directly shape the objective of the optimisation process.
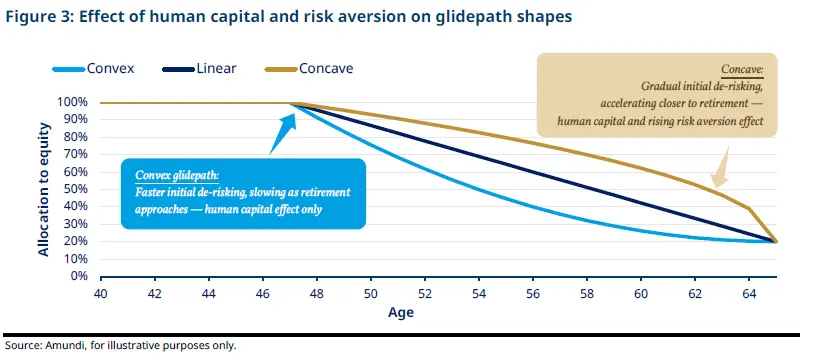
Inputs such as human capital and risk aversion are critical because they directly influence the shape of the glidepath. Human capital affects how much investment risk an individual can reasonably bear over time: someone with a long, stable career can typically remain invested in growth assets for longer, while an individual with an irregular contribution history — for example, due to career breaks or early retirement — may need to begin de-risking earlier. Risk aversion, meanwhile, determines how rapidly exposure to risk assets should be reduced as retirement approaches. Figure 3 illustrates how these assumptions give rise to three distinct glidepath shapes.
Optimise the glidepath
These inputs are then incorporated into a multi-period optimisation framework, which seeks to identify the portfolio allocation path that best meets the objectives of the reference persona over the full savings journey. The framework explicitly accounts for individual cash flows, including contribution patterns, and assesses how these interact with market conditions over time. For example, it can incorporate inflation effects on both the real value of contributions and expected asset returns, ensuring that the resulting glidepath reflects the full retirement savings experience.
If the investor’s objectives are not achieved, the assumptions — such as risk aversion, contribution levels, or investment constraints — and, where necessary, the objectives themselves are reviewed, and the optimisation is rerun.
Test the outcome
The solution should be benchmarked against reference strategies — such as a constant-mix allocation or a simple risk-free investment — to assess whether the glidepath genuinely adds value relative to the choices an individual could otherwise make.
Stress tests — including adverse market scenarios and sequencing risk near retirement — provide a further check on the robustness of the design. The key assumptions should also be stress-tested, as they directly determine the shape of the glidepath.
The ultimate goal of this testing phase is to ensure that the glidepath is not only theoretically optimal for the reference persona, but genuinely robust and fit for purpose across the range of individuals it is designed to serve. Where it falls short, the solution may need to be refined, segmented, or complemented by a separate investment option.
Case study: developing a glidepath for a pension provider Context and constraints In this case study, we consider a European pension provider designing a retirement glidepath with limited information on the potential client base. The provider operates in a market where regulation imposes the maximum allocation to risk assets as retirement approaches, and where the competitive landscape favours de-risking over time through a “life cycle” solution. Lifecycle assumptions and objectives To build a representative profile, we draw on several inputs: the average capacity to contribute to the pension scheme, shaped by salary progression and expected inflation, as well as the projected state pension income from the first pillar. 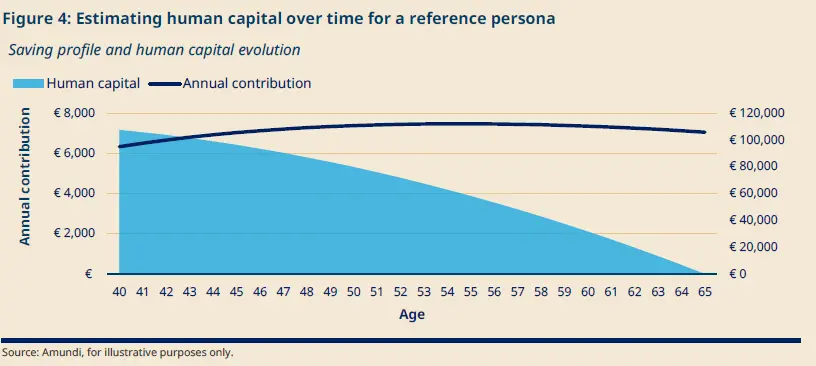
Glidepath optimisation The optimal glidepath starts with an 80% equity allocation and gradually derisks to 20% at retirement. This de-risking pace reflects two main factors: the decline in human capital described in Figure 4, and the effect of increasing risk aversion1. 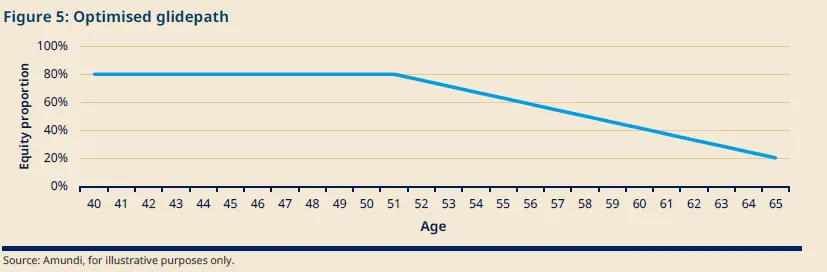
Testing robustness When we simulate the optimised glidepath, the reference persona accumulates an average retirement pot of nearly €500,000, after contributing between €6,000 and €8,000 per year throughout their career. Even in adverse scenarios, there is only a 5% probability that the pot at retirement falls below €283,000. 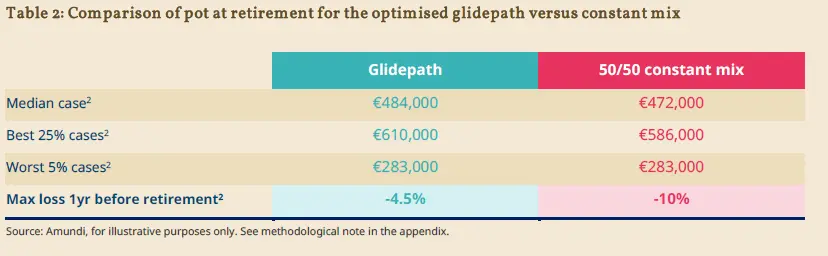
|
Beyond the default: personalisation
Personalisation is reshaping retirement investing
Personalisation is becoming a defining feature in modern retirement investing. Age alone is no longer a sufficient basis for designing glidepaths. Individuals of the same age can have very different savings patterns, earnings paths, retirement horizons and risk capacities, which means a single default will inevitably fit some better than others. Traditional target date funds and other age-based defaults often apply broadly similar glidepaths to investors with very different savings patterns, income profiles, retirement horizons and risk capacities. More advanced models can incorporate income, contribution behaviour, life expectancy and risk tolerance, but even these may not fully capture the needs of distinct groups.
As a result, DC schemes and retirement solutions increasingly consider different defaults for different groups of individuals, for example, non-contributors, investors with interrupted careers, deferred members, or those with materially different risk preferences. The same logic is increasingly relevant in wealth management, where the challenge is to deliver greater relevance at scale without moving to fully bespoke portfolios. Mass personalisation addresses this through data, segmentation and technology. It also has implications for the broader investment toolkit, including private assets, which may be suitable for some groups but not others depending on liquidity needs and retirement objectives.
One glidepath or many?
A glidepath calibrated to a reference persona (the baseline profile used to set assumptions about age, contribution patterns, retirement timing and risk tolerance) is only a starting point. Because the optimisation is conditional on these assumptions, the resulting path may not be equally effective for all. Robust glidepath design therefore requires a second step: testing the solution against alternative personas, meaning other plausible profiles that differ from the benchmark case in meaningful ways, such as starting age, retirement age, contribution patterns, employment continuity or active versus deferred status. In a context of mass personalisation, testing individuals’ outcomes is key.
The aim is to assess whether the glidepath remains fit for purpose across the wider population. If it does not, the answer may not be to abandon the design, but to refine it, segment it or complement it with an additional option.
Using artificial intelligence (AI) to identify common needs at scale
The challenge for large retirement systems is not identifying and testing for one individual profile, but rather recognising common patterns across very large populations. This is where AI can add value. As highlighted in Amundi’s research, a promising application of AI in retirement is in personalisation3. By analysing large datasets, AI can help identify clusters, behaviours and outcomes that may not be visible through traditional segmentation methods4. It is a key step towards building a scalable, mass-personalised retirement proposition.
In practice, this clustering approach can support a more robust and more personalised approach to glidepath design, helping providers move beyond broad averages to identify both representative groups and outlier segments. This makes it possible to test glidepath robustness against a wider range of individuals’ profiles and to highlight where the default solution may not be fully aligned with needs.
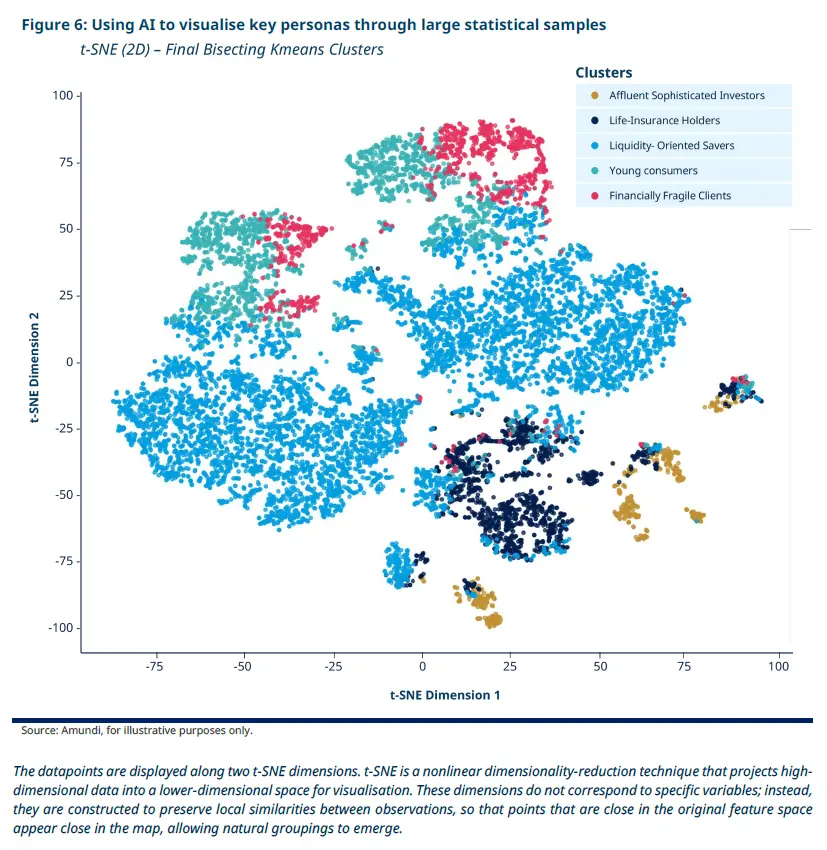
Mass personalisation through AI: a case study
In a recent research paper, Amundi used this AI-driven clustering approach to analyse a large retail client base, providing an overview of how mass personalisation can work in practice. Using a variety of inputs, the underlying client base can be segmented into five distinct saver segments: affluent sophisticated investors, life-insurance holders, liquidity-oriented savers, young consumers and financially fragile clients. While clustering takes place across multiple dimensions and inputs, Figure 6 aims to simplify this by presenting clusters in a two-dimensional format. While the X and Y axes cannot be interpreted on a standalone basis, they are constructed by incorporating more (higher-dimensional) variables.
When constructing clusters to visualise key personas, it is important that the underlying population of a constructed cluster shares similar characteristics.
Figure 6 aims to show the proximity in preferences and needs of a cluster to other clients in the same cluster.
By understanding different attitudes, this type of analysis helps determine the suitability of a given glidepath for a client cluster. In a context of mass personalised retirement, AI-enabled clustering analysis can be a cornerstone of robust glidepath design. More broadly, this clustering analysis can help providers identify individuals at risk of under-saving, adapt communication and refine product offerings.
Expanding the lifecycle toolkit: private assets
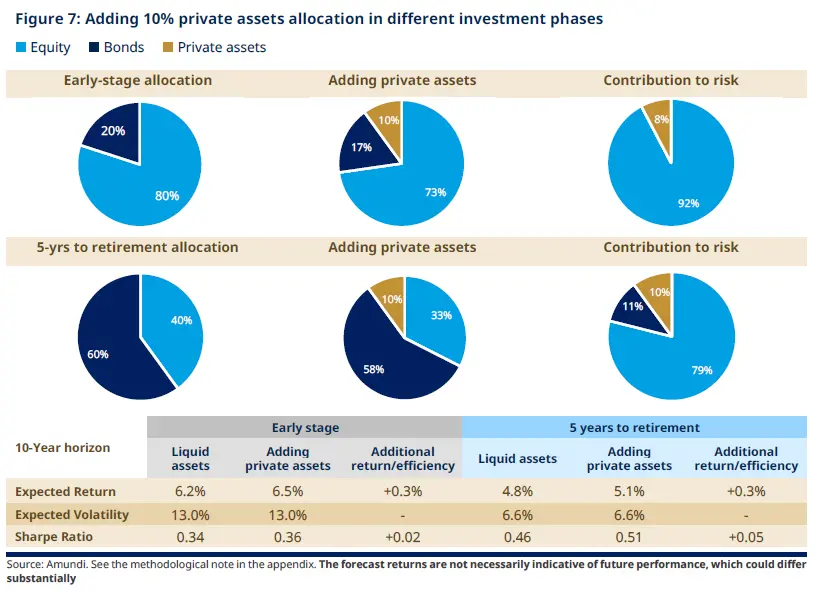
A more granular approach to asset allocation is becoming essential in lifecycle investing. Private assets are moving furtherup the agenda in retirement portfolio design. The logic is straightforward. In a world of modest contribution rates, higher retirement expectations and increasing pressure on portfolios to deliver over the long term, the case for broader diversification is strengthening. Yet any change in strategy must be grounded in a clear view of the return and risk drivers. It must also reflect the practical realities of deployment, valuation and liquidity. Private markets are not simply a different asset class. They operate differently, and access to them must be built deliberately over time. Private markets may not be right for everyone. But the direction of travel is clear. For many retirement markets, private assets are set to play a larger role in portfolio construction.
Glidepath analysis has traditionally focused on listed equities and bonds. Our framework, developed in T. Roncalli’s Retirement Accumulation Strategies with Real Assets and Inflation Risk5, extends this into a multi-asset optimisation problem that explicitly includes private assets. If implemented well, private assets can improve upon traditional equity-and-bond glidepaths by delivering return uplift through illiquidity and complexity premia, lower correlation to listed markets, inflation hedging benefits and lower volatility. This matters most for early-stage investors. They have the longest time horizon, the greatest capacity to absorb illiquidity and the most to gain from compounding an illiquidity premium across both equity and credit strategies over decades.
The return case for illiquid assets
There is extensive evidence, both historical and forward-looking, that diversified exposure to private assets can significantly improve risk-adjusted returns, even after fees. Our approach begins with forward-looking assumptions for public and private assets and tests the impact of adding private assets. This provides a useful starting point, complementing manager selection and operational criteria, and allowing us to assess the initial impact on retirement outcomes.
A 10% allocation to private assets can deliver annualised returns of around 30 basis points above liquid-asset-only portfolios, at the same level of risk (see Figure 7). While this uplift may appear modest, it can compound over time and, alongside a broader opportunity set and alpha from effective manager selection, become a meaningful contributor to long-term portfolio performance. As we move from investment design to portfolio management, operational and implementation considerations also become essential in shaping the final investment solution.
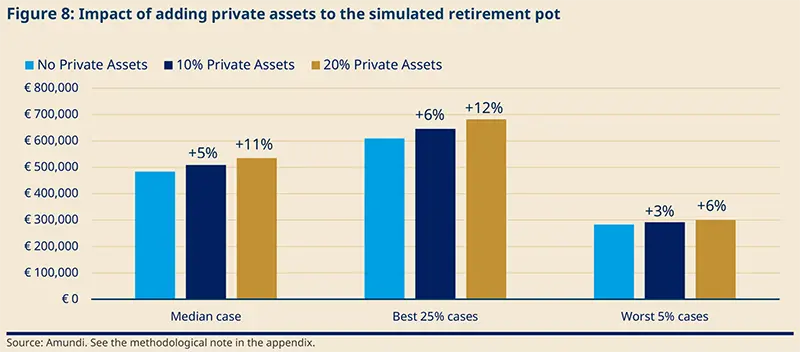
Case study: developing a glidepath for a pension provider — Part II: Impact of adding private markets Building on the glidepath framework and persona introduced in Section 2, a 10% allocation to private assets is introduced during early accumulation and the initial de-risking period, with exposure phased out in the five years preceding retirement. Under this scenario, the expected retirement pot rises by 5%, and the uplift approximately doubles when the allocation is increased to 20%.6
|
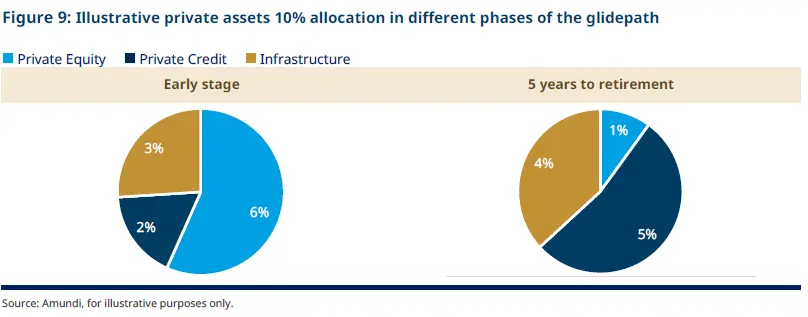
Not all illiquids are the same
Not all private assets should be used in the same way across the glidepath. In early accumulation, the portfolio can absorb assets with longer holding periods and less regular cash flows, such as private equity or venture/growth capital, because investors still have time to benefit from the illiquidity premium and recover from J-curve effects. Private equity is particularly useful at this stage as it supports capital growth. The broader private assets allocation should be complemented with infrastructure and real estate, which may provide inflation-linked revenue streams providing natural hedges throughout the long lifecycle and until retirement. Indeed, inflation is a major risk when considering retirement, as it can erode the purchasing power associated with retirement income and these assets can provide a hedge against it. As retirement approaches, the mix should shift toward private assets with more visible cash flows and a shorter duration, such as private credit, which can help preserve return potential while reducing capital-call risk and improving liquidity management. At the same time, closed-end private assets allocations should be progressively reduced so the portfolio is liquid by retirement.
Implementation and liquidity management
An important dimension of implementation is the choice between drawdown and evergreen funds. Drawdown (closed-end) funds have defined time horizons after which the vehicles liquidate: typically, 10 to 12 years for private equity funds, slightly longer for infrastructure, and slightly shorter for private debt. The correct implementation date for these drawdown funds in a glidepath therefore matters. Evergreen funds have no finite time horizon, and investors can subscribe and redeem their shares as the vehicles’ governance allows; consequently, these structures are designed to be more flexible in generating liquidity to investors according to their own preferences. Drawdown funds may offer higher long-term return potential, but deployment is gradual. Evergreen structures are typically invested more quickly and can help reach target allocations sooner, although redemption capacity remains more limited than public assets.
The choice of private market vehicles should align with both the commitment strategy and the retirement objective. As individuals approach retirement, portfolios designed to deliver pension payouts should reduce — and eventually stop — making new commitments. This ensures private market exposure is phased down in line with future liquidity needs and does not depend on secondary-market sales. The overall structure of the glidepath solutions is also important as they can be implemented through model portfolios, or target date funds, all of which influence the portfolio management approach and the range of permissible vehicles. Best practice is to build a framework that identifies the right private assets for each stage of the retirement journey and the most suitable access vehicle for implementation to drive better outcomes. Manager and strategy selection are key drivers of successful private asset programmes, as are more granular allocation choices that can improve efficiency. These are determined at the portfolio implementation stage; however, this goes beyond the scope of this paper.
Conclusion
Glidepath design is ultimately a question of fit: fit within the retirement ecosystem, fit with individuals' population and fit with the intended outcome. In some settings, a static allocation may remain appropriate; in others, a glidepath will better reflect the changing balance of risk, capital and time as retirement approaches. The challenge is to design with clarity, implement with discipline and revisit with purpose as individual needs, regulation, data and investment opportunities continue to evolve.
Where private assets are included, the type of illiquid asset must match the lifecycle stage — equity-oriented strategies (both private equity and infrastructure) for young individuals, private debt and yield-oriented for de-risking ones. Vehicle and commitment pacing matter as much as asset-class selection, and closed-end and evergreen allocations must be wound down ahead of retirement so that liquidity needs can be met without recourse to secondary-market sales or incurring redemption restrictions.
As retirement solutions become more individualised, the next step will be to redesign defaults and propositions themselves — enhancing existing approaches where they work and creating new ones where they do not. The result will be a remix of proven lifecycle principles with new research, new technologies and a broader investment toolkit.
1. Without increasing risk aversion, the optimal allocation would have de-risked more slowly near retirement and ended at a riskier level, around 50% equity instead of 20%.
2. Median, Best 25% and Worst 5% cases refer to the median outcome, the 75% percentile and the 5th percentile, respectively, of the 10000 simulated pots at retirement. Max loss 1 year before retirement is calculated by taking the worst annual loss one year before the retirement date.
3. Brière, M. & Blanquart, O. (2026). Understanding retail investors: a clustering approach, Amundi Research Center. https://research-center.amundi.com/article/understanding-retail-investors-clustering-approach
4. Brière, M. & Huynh, K. (2025). Artificial Intelligence for Behavioral Finance, Amundi Research Center. https://research-center.amundi.com/article/ai-meets-behavioural-finance-smarter-tools-retail-investors
5. Roncalli, T. (2025). Retirement Accumulation Strategies with Real Assets and Inflation Risk
6. Note that for a younger individual with a 40-year contribution horizon, rather than 25 years, a 20% allocation to private assets could increase the retirement pot by around 20% on average. The expected pot for retirement is for illustrative purposes only and may differ substantially.


Author