
Summary
In the Iran crisis, oil is the key transmission mechanism through which tensions spill over into the global economy: a total disruption of the Strait of Hormuz is the decisive trigger that can turn an energy shock into a broader macroeconomic shock.
The Iran crisis pushed oil and gas prices higher, raising concerns about higher inflation and weaker growth—especially in regions that rely on energy imports.
In the absence of a material disruption to oil infrastructure and Hormuz traffic, we regard the current episode as a temporary oil shock with only modest implication for growth and inflation.
Aside from tactical adjustments, from a long‑term perspective it is paramount to focus on fundamentals.
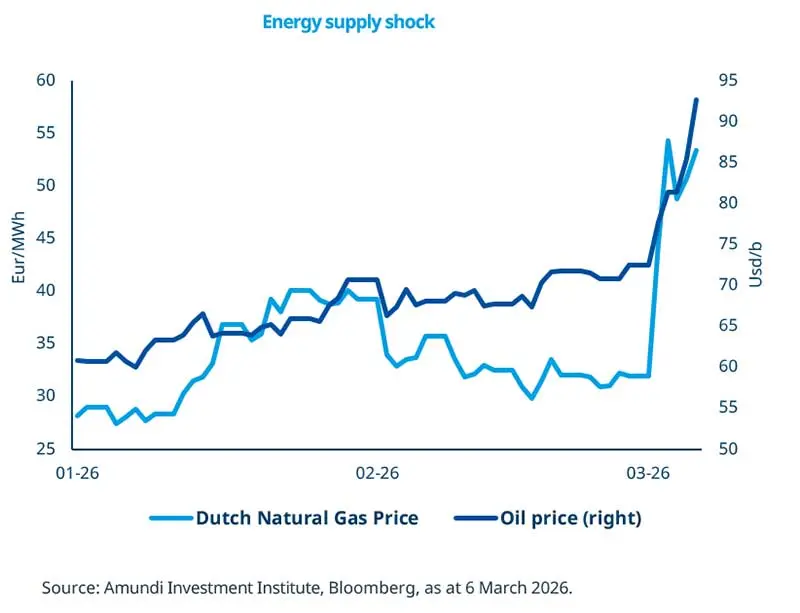
Escalation in Iran transmits to the global economy and markets mainly through oil: the Middle East is a major oil and gas producer (c. 31% of global oil production and c. 18% of global gas production), and the Strait of Hormuz is a critical transit point, particularly for shipments to Asia, which receive almost 90% of the crude and condensate transported through the waterway. Oil shocks generally have uneven effects on economies: exporters tend to benefit while importers tend to lose out, with the intensity of the impact linked to magnitude and persistence of price spikes.
Over the weeks ahead, the oil-price outlook depends on the intensity and duration of disruption to infrastructure and Hormuz traffic. A short conflict with limited disruption could lead to a temporary oil price spike with limited impact on global growth and inflation. Central banks’ data dependent approach will likely result in a postponement of actions while they assess the growth-inflation mix.
This week at a glance
The Iran crisis pushed energy prices higher. Equities fell, particularly in countries more dependent on energy imports. Concerns about inflation pushed up government bond yields—especially at the short end of the curve—amid a repricing of central bank expectations. Gold fell on profit‑taking after an earlier strong performance.
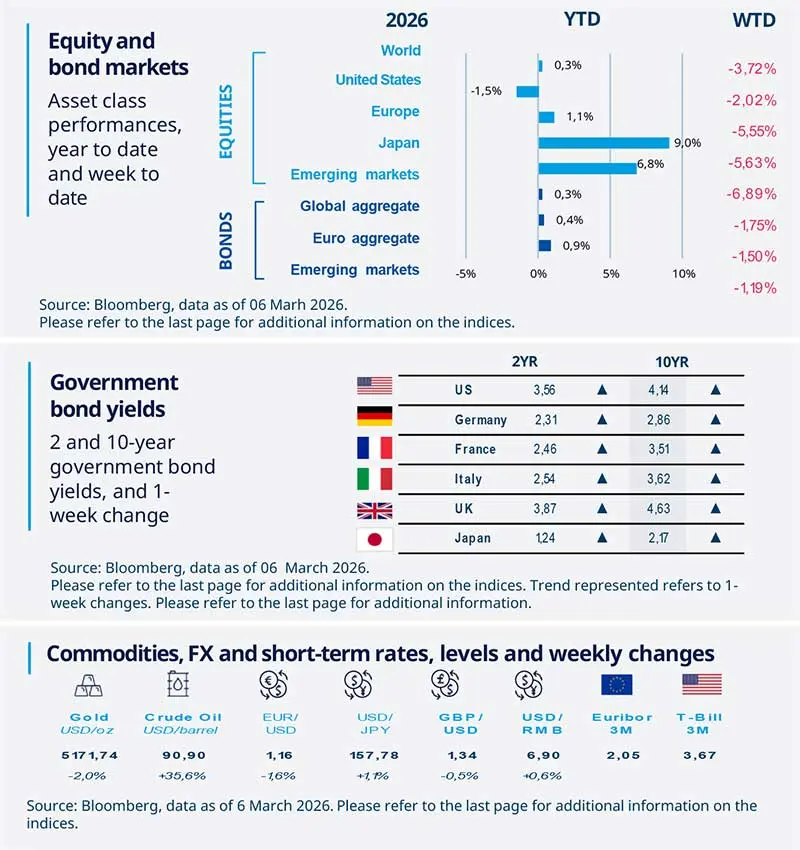
Equity and bond markets (chart)
Source: Bloomberg. Markets are represented by the following indices: World Equities = MSCI AC World Index (USD) United States = S&P 500 (USD), Europe = Europe Stoxx 600 (EUR), Japan = TOPIX (YEN), Emerging Markets = MSCI Emerging (USD), Global Aggregate = Bloomberg Global Aggregate USD Euro Aggregate = Bloomberg Euro Aggregate (EUR), Emerging = JPM EMBI Global Diversified (USD).
All indices are calculated on spot prices and are gross of fees and taxation.
Government bond yields (table), Commodities, FX and short-term rates.
Source: Bloomberg, data as of 06 March 2026. The chart shows the price of gold.
Diversification does not guarantee a profit or protect against a loss.
Amundi Investment Institute Macro Focus
Americas
US productivity in good shape
For 2025, the estimate of US productivity growth has been revised up thanks to better data for the first nine months of the year after a downward revision to payroll numbers. For the full year, productivity growth of 2.2% was slower than the 3.0% recorded in 2024, but quarter by quarter data show stronger momentum in the second half of 2025. This sets the stage for stronger productivity growth in 2026.
Europe
EU inflation pressures could increase
Euro-area inflation rose to 1.9% year on year in February. The increase was driven by a surge in services inflation and a lower reduction of the energy component YoY. The index excluding more volatile components such as energy was up at 2.4%. Given the conflict in the Middle East and the associated movements in energy prices, further inflationary pressures may emerge; albeit it’s uncertain at this stage.
Asia
China growth target in line with consensus
China set the 2026 GDP growth target at 4.5–5.0%, down from around 5% in 2023-25 but broadly in line with consensus and aligned with the 15th Five-Year Plan. The slight reduction may give policymakers more room for structural adjustments. On the fiscal front, the aggregate deficit is budgeted at 9.5% of GDP for 2026, below consensus but higher than the 9% shortfall in 2025.
Key dates
CHINA PPI and CPI, Germany industrial production, Mexico CPI |
Korea GDP, Japan GDP, South Africa GDP, China Trade balance |
USA JOLTS Data, Consumer Confidence, PCE Price Index, GPD. |

Authors