
Summary
Executive summary
2021 will be a pivotal year to curb climate change. Although global CO2 emissions dropped 7% in 2020 due to the effects of Covid-19-related lockdowns, stronger action will be needed at the upcoming Conference of the Parties (COP) 26 to keep temperature increases below 2°C and towards 1.5°C.1 Achieving the 1.5°C goal will require net zero global emissions by 2050. Today, the financial sector has new tools to measure the alignment of investment portfolios with the goal of net zero global emissions by 2050. Among these are temperature scores. To compute the temperature of company x, one compares the future emissions trajectory of that company with the corresponding trajectory of its sector, as deemed by the International Energy Agency (IEA) in alignment with a world where the temperature rise is limited to 1.5°C. So far, these scores have been adopted by only a handful of investors. A significant amount of work is still needed for investors to efficiently use such scores in their strategies. The aim of this paper is to present an overview of temperature scores across equity and credit universes. This paper builds on prior research on the distribution of temperature scores across different investment universes, using the methodologies of three data providers: CDP (Carbon Disclosure Project), Iceberg Data Lab, and Trucost. These are our key takeaways:
- Across providers, very few companies have a temperature score below 2°C.
- Our analysis of temperature distributions finds unevenness across geographies, with US equity being the worst performer, followed by emerging markets (EM) and European equity.
- Sector-based analysis shows large temperature discrepancies among industries.
- Techniques to compute temperature metrics are under development and could evolve as data providers improve their methodologies.
- Focusing on the distribution of temperature scores rather than on the score of an aggregated portfolio could be an efficient way for investors to use these metrics.
We believe that there will be increasing demand for transparency and to direct investors towards companies that can manage the energy transition effectively. Finally, temperature scores could be a relevant metric to build innovative investment products that deliver a reliable net-zero trajectory. They could enable investment professionals to project it on several dimensions, including geographical exposure or a sectoral axis. Temperature scores also have the advantage of being easy to read and understand. This is critical, especially for retail investors, as climate metrics can often be hard to grasp. Such an indicator represents a strong communication tool for net-zero investment strategies or sub-investment processes, which are designed to contribute to a net-zero trajectory.
Evolution and innovation will be key factors in the development of any responsible-investing business and to help companies make progress on a wide range of issues, such as mitigating the impact of climate change or lowering the corporate carbon footprint, guiding companies to become compliant with the Paris agreement’s goals.
Jean-Jacques Barberis
Analysis of temperature score distributions
At the COP21 conference -- held in Paris in 2015 -- governments committed to curbing the global temperature rise well below 2°C above pre-industrial levels and to pursue efforts to limit global warming to 1.5°C. Indeed, the Intergovernmental Panel on Climate Change (IPCC) warned that global warming must not exceed 1.5°C to avoid the catastrophic impact of climate change.2 The Paris Agreement also set the stage for investors willing to integrate climate goals into their portfolios. In article 2.1(c) of this agreement, signatories committed to “making finance flows consistent with a pathway towards low greenhouse gas emissions and climate-resilient development”.3
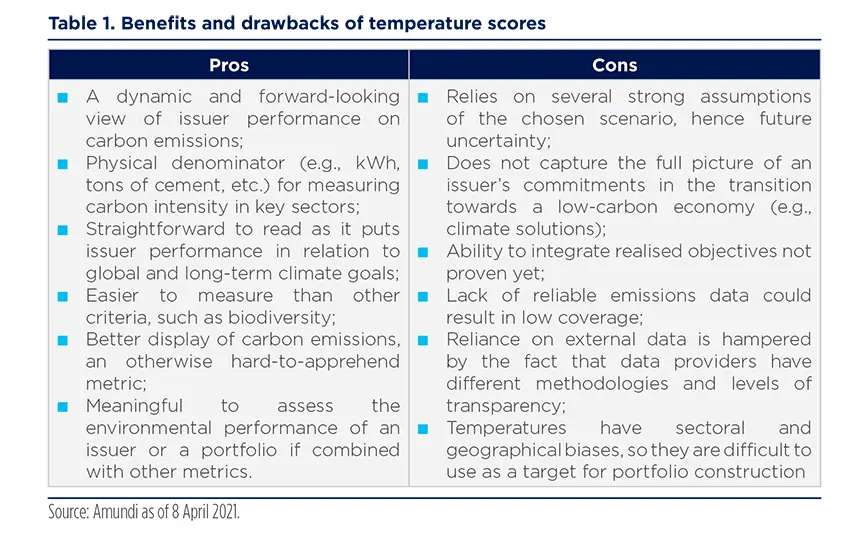
In this context, temperature scores have emerged as an innovative tool for investors to align their portfolios to the goals set out by the Paris Agreement. Measuring the temperature of companies through this metric can help asset owners and managers understand the transition trajectory of their investments and respond by aligning their strategies with the transition to net zero. They appear to be an insightful complement to existing climate-oriented metrics, such as carbon emissions or green and brown revenues. By providing a simple and contextualised metric, temperatures can become a standard for measuring the alignment of investors’ portfolios. They offer a forward-looking and long-term view on investments, whereas previous metrics were mostly backwards looking. However, as these methodologies still have room to develop, several pitfalls remain.
Temperature scores have emerged as an innovative tool for investors to align their portfolios to the goals set out by the Paris Agreement.
| Note Transitioning to a low-carbon economy in a timeline in line with the Paris Agreement, while avoiding further inequalities, will be key. Adjusting portfolios to this goal while maintaining their riskreturn profile is ambitious. Nevertheless, there is no consensus today around portfolio alignment methodologies, but rather a combination of solutions and tools that could guide action when used together. Temperature indicators are one of them. Investors may have other powerful drivers to contribute to the transition to a low-carbon economy through active dialogue with corporates, voting policies and the financing of the energy transition with tools such as green bonds. |
We have conducted an analysis of temperature score distributions within different equity and credit universes, relying on three main providers, namely CDP, Iceberg Data Lab, and Trucost. While their methodologies differ on a number of points, their ambition is the same: computing historical data on greenhouse gas emissions and/or targets disclosed by issuers on future carbon reduction to obtain a single temperature metric.4 This temperature score gives investors a sense of companies’ alignment to different climate scenarios.
|
Paris Agreement Capital Transaction Assessment (PACTA) Developed by the 2 Degrees Investing Initiative (2DII) with backing from the UN Principles for Responsible Investment (PRI), PACTA enables users to measure the alignment of financial portfolios with climate scenarios as well as to analyse specific companies. Concretely, the PACTA tool aggregates global forward-looking assetlevel data up to parent company level, building off a vast climate-related financial database. The tool then produces a customised output report, which allows investors to assess the overall alignment of their portfolios with various climate scenarios and with the Paris Agreement. In September 2020, 2DII also launched PACTA for banks, an open-source climate scenario analysis toolkit for the corporate lending sector. Developed with the input of leading global banks, universities and NGOs, the tool enables users to measure the alignment of their corporate lending portfolios with climate scenarios across key climate-relevant sectors and technologies. In addition to enabling users to measure the alignment of their portfolios, PACTA also helps investors implement the recommendations of the Task Force on Climate-related Financial Disclosures (TCFD), as well as comply with related regulations. |
Five takeaways can be identified from our temperature score analysis.
1. Across all three data providers, very few companies in global indices have a temperature score below 2°C
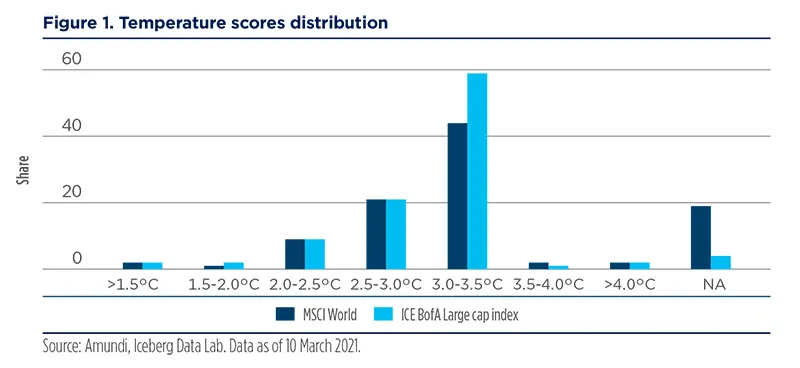
The data providers considered in this paper use their own data sets and methodologies. Consequently, companies’ temperature scores can differ to a sizeable extent depending on the provider. In this section, we focus on the metrics produced by Iceberg Data Lab. According to this data, less than 5% of companies have a temperature score below 2°C across all investment universes, with reference to the MSCI World index. This share is even lower (3%) when considering the ICE BofA large cap index. In both cases, a significant share of companies have temperature scores ranging from 2.5°C to 3.5°C. The ‘NA’ column includes issuers that have not disclosed any emission reduction targets and that, as a result, are not in the scope of Iceberg Data Lab’s methodology.
Less than 5% of companies have a temperature score below 2°C across all investment universes.
At this stage, it appears difficult to build investment portfolios uniquely made up of corporates that are already aligned to a 2°C trajectory and moving towards 1.5°C.
Differences between credit and equity temperature levels on similar universes lie in the differences between benchmarks, not in the issuer’s temperature scores (i.e., corporate x stocks and corporate x bonds have the same temperature score). At this stage, it appears difficult to build investment portfolios uniquely made up of companies that are already aligned to a 2°C trajectory and moving towards 1.5°C. Moreover, only a handful have taken pledges to reduce their carbon emissions to limit global warming to 2°C or below. This is despite the risk of having stranded assets due to efforts to decarbonise the economy. Pioneering companies have taken the lead in the zerocarbon transition by setting emissions reduction targets grounded in climate science through the Science Based Targets initiative (SBTi). Targets are considered to be ‘science-based’ if they are aligned with emission levels consistent with limiting global warming to well below 2°C above pre-industrial levels and towards 1.5°C. To take part in such a global effort, large asset managers have started to develop robust engagement strategies encouraging companies to set more ambitious targets in line with the Paris Agreement’s goal. In practice, this can be done in different ways through continuous and collective engagement with issuers.
2. The distribution of temperature scores varies across geographies
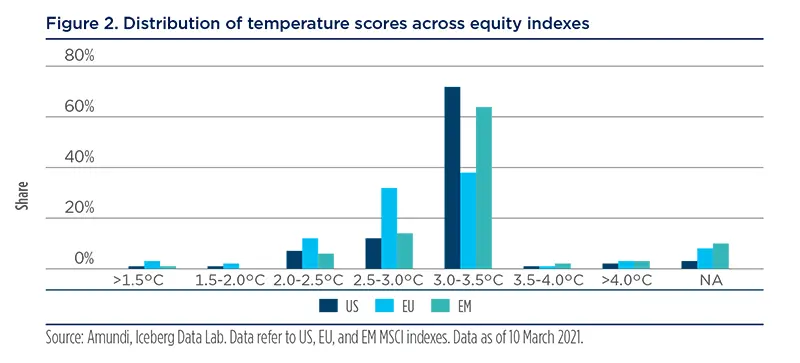
Temperature metrics also hinge on the regions considered. Focusing on results provided by Iceberg Data Lab, the worst performer of all equity universes is US equity, with 75% of corporates being above the 3°C threshold. This is followed by emerging markets (EM) equity and European equity, where the share of companies with a temperature above 3°C is 69% and 42%, respectively. Two main reasons can explain the differences across regions:
- European companies are leading the charge in their efforts to reduce their carbon footprint. In contrast, US corporates have generally been slower to acknowledge the inevitability of transition and to announce ambitious emission reduction goals.
- Temperature methodologies rely on a single global scenario for sectoral pathways, which means that the demanded level of ambition is the same across regions. This does not account for discrepancies in the maturity of issuers and countries across geographies.
Additionally, a significant share -- worth around 10% -- of the MSCI EM index is not covered by Iceberg Data Lab’s methodology. This can be explained by the fact that EM issuers are lagging behind their European and US peers when it comes to climate disclosure and reporting practices, as well as the fact that providers tend to focus on advanced economies first. Both the availability and quality of information relating to carbon emissions tend to be lower for EM issuers, making it more difficult for data providers to assess the companies’ temperature performance.
To take part in such a global effort, large asset managers have started to develop robust engagement strategies, encouraging companies to set more ambitious targets in line with the Paris Agreement goal.
European companies are leading the charge in their efforts to reduce their carbon footprint. In contrast, US corporates have generally been slower to acknowledge the inevitability of transition and to announce ambitious emission reduction goals.
Within the US equity universe, only 2% of companies have a temperature score below 2°C, while 84% of them follow a 2.5-3.5°C trajectory. Considering the MSCI European equity index, 5% of the universe has a temperature score below 2°C, while 70% of companies sit in the 2.5-3.5°C range. Across the MSCI EM equity universe, only 1% of companies lie below the 2°C threshold, while almost 80% have a temperature score between 2.5°C and 3.5°C.
3. Sector-based analysis also indicates notable temperature discrepancies across industries
Another way to compare temperature scores across geographies is to look at sector scores. This can be done, for instance, by comparing the European utility sector to US utility companies. Again, the picture remains similar across sectors: European companies tend to outperform their US peers. An important feature to highlight when comparing temperature scores across geographies is that they all rely on the IEA’s global sector trajectories. However, the IEA also provides regional sector trajectories, which are more stringent for European companies, given they are at a more advanced stage. Were these regional sector trajectories used to compute temperature scores, the differences between regions would probably be less apparent.
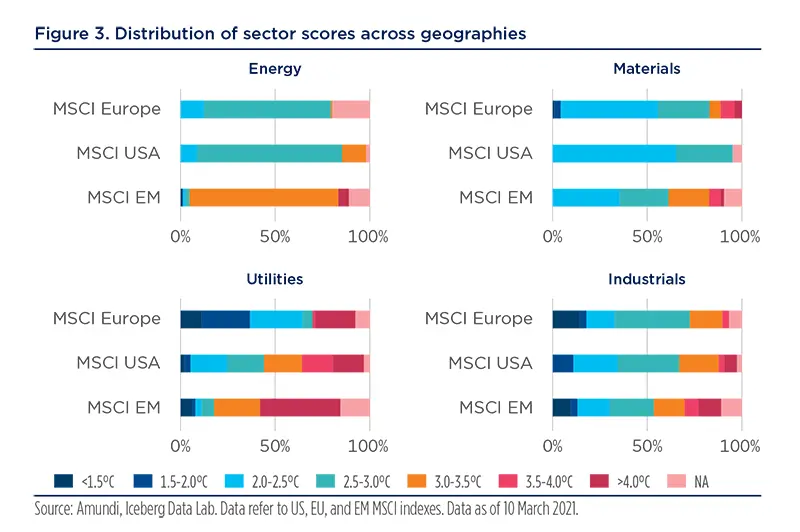
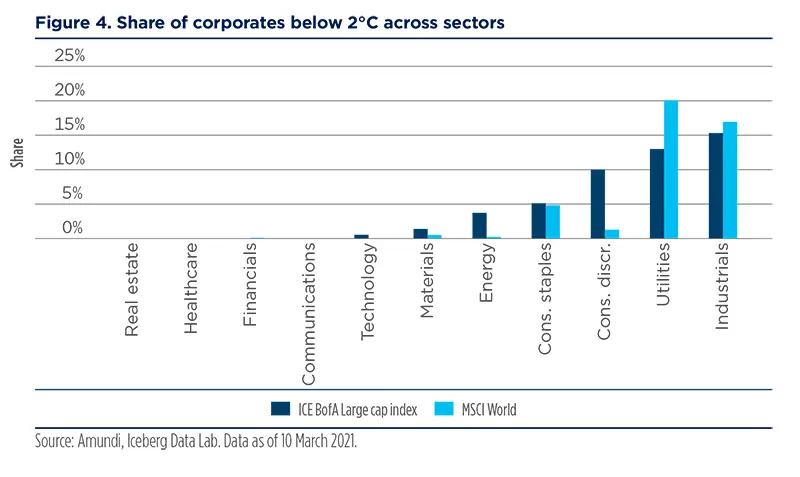
Figure 4 shows the share of corporates that are below the 2°C target within each sector, according to Iceberg Data Lab’s methodology. While the amounts remain low overall, some of them fare significantly better than others. Utilities, industrials and consumer discretionary are the best-performing sectors, with over 10% of corporates aligned with the Paris Agreement goals, while real estate, healthcare, financials and communication have no firms below the 2°C target. Similar results can be observed in a global credit universe using Iceberg Data Lab’s methodology.
Utilities, industrials and consumer discretionary are the best-performing sectors, with over 10% of corporates aligned with the Paris Agreement goals, while real estate, healthcare, financials and communication have no firms below the 2°C target.
4. Analysing the distribution of temperature scores within investment universes, rather than the score of an aggregated portfolio, is an efficient way for investors to interpret these metrics
A portfolio’s aggregate temperature score may not reveal its true climate performance. For instance, while the overall score of a portfolio can be low, some of its holdings may have a temperature score much higher than the 2°C threshold. In addition, an aggregated portfolio score does not take into account the fact that the reduction of greenhouse gas emissions in a given sector may be much more impactful than in another one. For instance, a score of 2°C within an energy portfolio is much more significant than the same score in a healthcare portfolio, given the challenges faced by the former to transition to a more sustainable economic model.
Overall, these variations are not properly represented by the single-weighted average temperature score of an aggregated portfolio. As a result, focusing on the distribution of scores might be a more efficient way for investors seeking to decarbonise their portfolios. Ultimately, this technique will facilitate active engagement, allowing portfolio managers to identify and target those companies that are aligned to a 2°C trajectory and, as such, are in a position to manage the energy transition and extract value from this.
Rather than being used on their own, temperature scores should be considered alongside a broader set of criteria to assess a company’s alignment with climate goals.
5. Methodologies to compute temperature metrics are under development and could evolve further
Temperature scores have only been developed recently and data providers are reassessing their methodologies to enhance the scores’ relevance and applicability. Rather than being used on their own, they should be considered alongside a broader set of criteria to assess a company’s alignment with climate goals. For asset managers, it is paramount that sufficient resource is utilised to assess fully this methodology and its broader application.
Opportunities for fundamental investors
Responsible investors could integrate temperature scores through various channels, typically through their engagement and investment strategies. In this respect, temperature scores could complement the various climate metrics that are already in use.
Engagement strategy
Responsible investors could deploy their engagement policy as part of their ESG criteria inclusion policy to help companies make progress on a wide range of issues, such as mitigating the impacts of climate change or lowering the corporate carbon footprint, guiding companies to becoming compliant with the Paris Agreement goals. While today companies acknowledge global warming as a major systemic risk, much remains to be done for them to be on a 2°C trajectory. On the topic of climate change mitigation and adaptation, a solid engagement strategy should rest on four pillars:
- An annual letter sent to companies to set out climate goals;
- Continuous engagement to encourage companies to declare and have their transition objectives certified by the Science-Based Target initiative (SBTi);
- Collective engagement to catalyse corporate action and achieve a stronger impact; and
- Pre-annual general meeting dialogue and voting to encourage companies to adopt climate-neutral policies.
Another interesting tool that responsible investors could include in their engament strategy is to join forces with multilateral financial institutions to provide a benchmark tool for investors. This would enable them to assess an investment at an issuer-level, in relation to climate change-related financial risks and opportunities. As part of such an investment framework, an effective engagement policy should target both issuers and data providers.
In this way, companies could be encouraged to improve their disclosure practices, when it comes to data linked to the company’s exposure to transition risk, physical risk and contribution to the transition. ESG data providers also play an important role in filling the gaps where corporate disclosure is limited. As a result, engagement should also focus on challenging data providers’ methodologies and expanding their coverage.
|
Engagement case studies Sector leader: automobile manufacturer Transitioning company: utility sector corporate Laggard: mining company |
Investment strategy
Criteria related to the temperature score and trajectory of a company are increasingly being integrated into responsible investment strategies. However, these metrics should be used as a complement to other climate indicators, rather than as stand-alone tools. The following case study highlights how temperature metrics could be combined with additional criteria to monitor all types of climate-related risks.
Responsible investors could deploy their engagement policy as part of their ESG criteria inclusion policy to help companies make progress on a wide range of issues, such as mitigating the impact of climate change or lowering their corporate carbon footprint, guiding companies to become compliant with the Paris Agreement goals.
|
Just Transition for Climate Strategy case study A euro credit strategy may follow stringent investment guidelines to ensure the alignment of invested assets with the Paris Agreement goals:
These investment guidelines allow for a better targeting of companies, according to their compatibility with the Paris Agreement goals. In addition, investment portfolios are monitored continuously to ensure their alignment with the 2°C goal. This is done through:
|
The robustness of this investment process will depend on the accuracy and applicability of the corporate climate and temperature data. In order to improve the quality of data used in investment metrics, investors could work closely with data providers to enhance their methodology and coverage.
Criteria related to the temperature score and trajectory of a company are increasingly being integrated into responsible investment strategies.
Financial innovation
The Institutional Investors Group on Climate Change (IIGCC) advocates for the design of a net-zero investment framework. This initiative is based on stakeholder and market engagement, as well as policy advocacy. We believe that temperature scores could be a relevant metric to building innovative investment products that deliver a reliable netzero trajectory. As highlighted in this paper, temperature scores could help aggregate several dimensions relating to carbon emissions and the climate impact of different tools and enable investment professionals to project it on several dimensions, including geographical exposure or sectoral axis.
While we acknowledge that today this innovaton is not a perfect instrument, we encourage its use and adoption. Nevertheless, we encourage its use and adoption in the belief that -- through trial and error -- temperature scores and their methodologies will be refined and enhanced by the financial industry.
Temperature scores also have the advantage of being easy to read and understand. This is critical, especially for retail investors, as climate metrics can often be hard to grasp. While we must not use it too-simplistically, this indicator represents a strong communication tool for net-zero investment strategies or sub-investment processes, which are designed to contribute to a net-zero trajectory. It would help develop science-based scenarios or pathways used to guide target setting and company assessment. In this way, asset managers and asset owners can assess the alignment of the assets they select and challenge their environmental performance in comparison to targets over time.
Conclusion
By providing a clear science-based standard, temperature ratings have emerged as useful tools for investors willing to align their portfolios with international climate goals. Not only do these tools serve to identify climate leaders, they also enable asset owners and managers to encourage laggards to implement more ambitious climate commitments. A few interesting takeaways from our study can be highlighted.
First of all, our analysis of temperature distribution across investment universes reveals that very few companies currently have a temperature metric below 2°C. These scores thus reflect a well-known scientific consensus: the world is still far from reaching the goal of keeping global temperature increases below 2°C and towards 1.5°C.
Then, we observed important variations in temperature scores across investment universes, regions and industries. This suggests the distribution of temperatures across investment portfolios can be an efficient way for investors to gauge the temperature pathway of specific issuers. By adopting this approach, asset owners and managers can target issuers throughout the investment and engagement process and select companies with which they can carry out specific climate commitment actions. Another key point is that, while these scores are useful to rank ‘leading’, ‘transitioning’ and ‘laggard’ companies, they are partly capturing climate targets and ambitions and are not solely based on past performance. This means that companies will ultimately have to deliver on these targets in the long term. This is why CDP’s credibility check, for example, is useful in assessing a company’s genuine climate commitment.
Looking at the distribution of temperatures across investment portfolios can be an efficient way for investors to gauge the temperature pathway of specific issuers.
Finally, these temperature metrics are meant to complement other instruments and initiatives aiming to align capital flows towards reaching the Paris Agreement goals. For instance, the European Commission has introduced Paris-aligned benchmarks as part of its 2018 Action Plan on Financing Sustainable Growth. These benchmarks’ underlying assets are selected in a such a way that the resulting benchmark portfolio’s emissions are aligned with the global warming target of the Paris Agreement. Global initiatives, such as the Net Zero Asset Owner Alliance, reveal growing investor ambition to align portfolios with a 1.5°C scenario. The alliance -- which gathers 33 institutional investors committed to transitioning their investment portfolios to net-zero greenhouse gas emissions by 2050 -- has paved the way for the financial sector as a whole to drive global climate ambitions.
Although a lot of work still needs to be done to improve the reliability and applicability of these metrics, the emergence of temperature scores is encouraging for the investment industry. Along with other recent developments, it indicates investors’ incremental commitment to adopting a more forward-looking approach to aligning their portfolios to the necessary transition to net zero.
Appendix: comparing methodologies
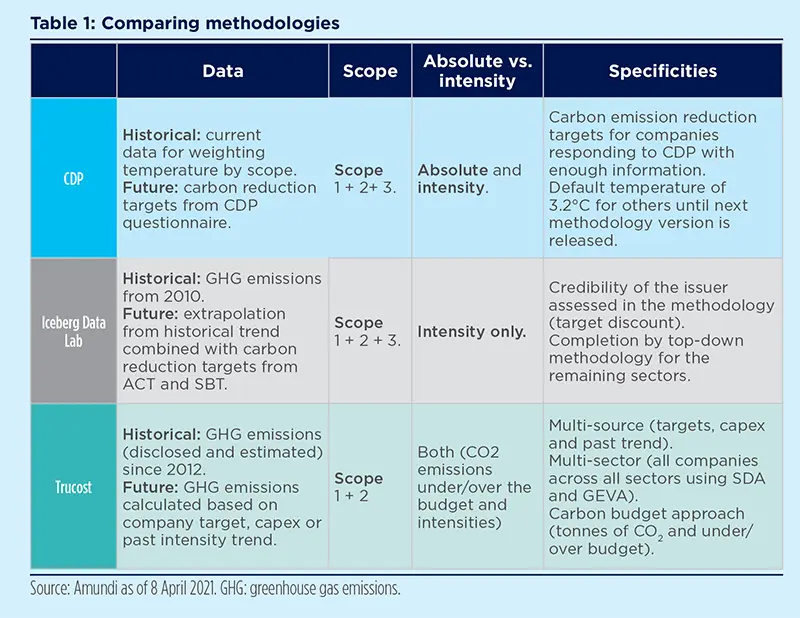
To calculate the temperature score of portfolios, investors usually rely on three main data providers, namely Iceberg Data Lab, Trucost, and CDP. Their methodologies are similar: they analyse historical data and/or targets disclosed by the issuer on carbon reduction to obtain an overall temperature score. For instance, Iceberg Data Lab gathers a company’s carbon performance over the past ten years, as well as its carbon-reduction targets. Then, it assesses the company’s ambition and checks whether the issuer is credible based on the actions it has taken already. Ultimately, it draws a comparison between the issuer’s trajectory and different climate scenarios, to assess its alignment to a net-zero world.
There are a few notable differences between the data providers’ methodologies, mainly based on the type of data they collect and the techniques used to gather it. Before diving into these specifics, it is necessary to understand what kind of emission scopes and targets are considered in these methodologies. There are three different kind of scopes, each measuring greenhouse gas emissions caused by economic activity with varying closeness to the core of a firm’s activity:
- Scope 1 covers direct emissions from owned or controlled sources;
- Scope 2 encompasses indirect emissions from the generation of purchased electricity, steam, heating and cooling consumed by the reporting company; and
- Scope 3 includes all other indirect emissions that occur throughout the different steps of a company’s value chain. Scope 3 emissions are rarely included in computation methods, as they are deemed less reliable and more difficult to measure.
There are a few notable differences between the data providers’ methodologies, mainly based on the type of data they collect and the techniques used to gather it.
As for the type of targets considered, they may be ‘absolute’, thus referring to the total amount of emissions being emitted, or ‘intensity’-related, which is a normalised metric that sets a company’s emission targets relative to other types of economic output, such as the company’s revenues or physical output (e.g., MWh of power produced). Three key differences among the methodologies stand out:
- All three providers assess the ambition of corporate carbon reduction targets. However, Trucost and Iceberg Data Lab also consider the past trend in carbon emissions when estimating a company’s future trajectory.
- Iceberg Data Lab is the only provider to actively take into account the credibility of the issuers it rates. This refers to assessing the extent to which concrete actions taken by companies reflect their commitments and goals. This is one of the methodology’s key strengths since the engagements announced by issuers remain declarative. As a result, a discount of the target is probably relevant when it comes to assessing the projected emissions of an issuer.
- Many issuers have not yet disclosed a reduction target. To tackle this issue, CDP has chosen to apply to them a 3.2°C trajectory by default.
Empirical cases
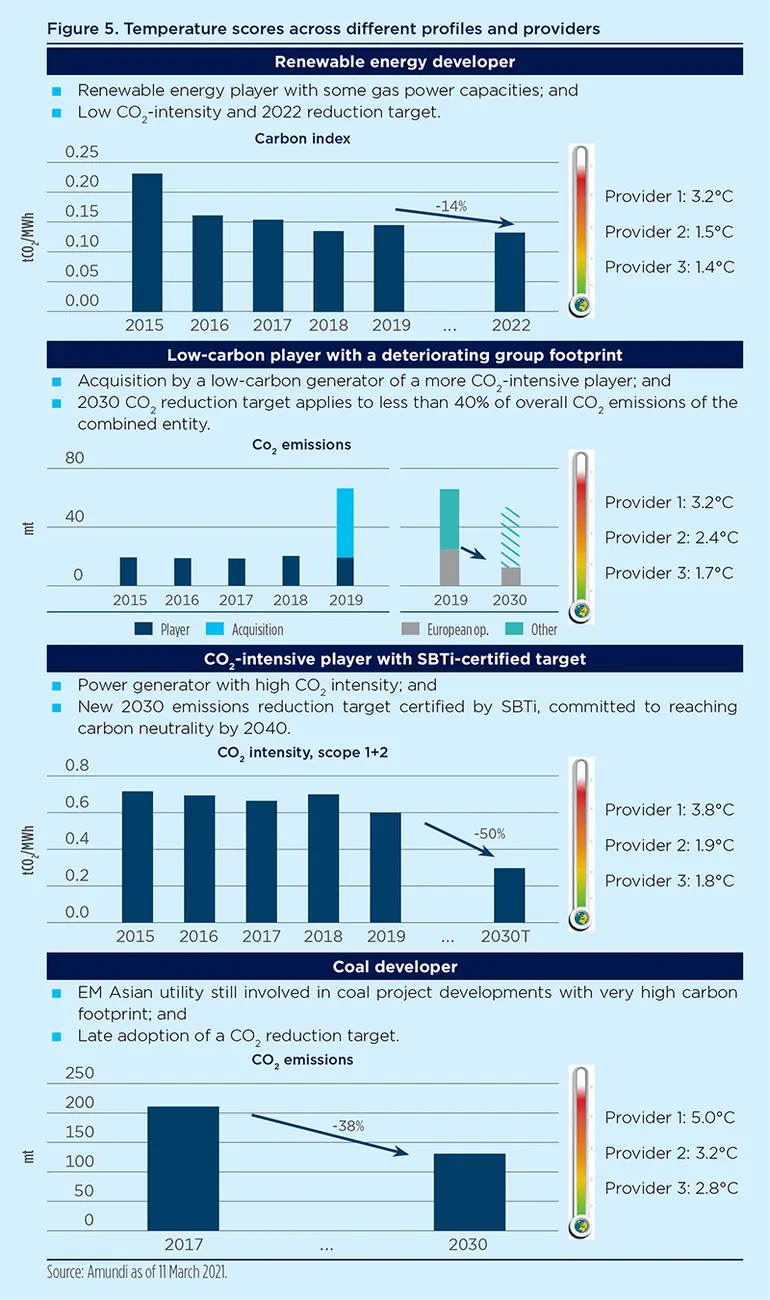
To compare the outcome from various approaches, we look at four corporates in the electricity sector, chosen for their distinctive energy transition profiles:
- Renewable energy developer, with very low CO2 intensity and a short-term CO2 reduction target at a group level.
- Deteriorating profile, with historically low CO2 intensity but whose group’s carbon footprint has deteriorated following the acquisition of a more carbon-intensive peer. The group has set a CO2 reduction target covering less than 40% of its emissions.
- Improver profile, with historically high CO2 intensity but which has adopted a new ambition certified by the SBTi as being aligned with the ‘well-below 2°C’ target.
- Laggard, with very high CO2 footprint involved in coal development projects which has opted for a reduction target for its group’s absolute CO2 emissions.
The temperature ratings attributed by the different providers can show significant gaps:
- The renewable developer profile is well captured by two providers thanks to their ‘carbon budget’ approach that recognises the already low CO2 footprint, whereas the absence of mid- to long-term target weighs negatively for the 3rd provider.
- The deterioration case gets a 1.7°C rating by one provider. While the M&A move deteriorated the group’s carbon footprint, this does not correspond to incremental carbon emissions in the real economy. However, with a reduction target applying to less than 40% of the group’s carbon emissions, such temperature rating does not appear deserved in our view.
- For the improver case, the ‘well-below 2°C’ target may not be recognised by providers applying a carbon budget approach as the starting point weighs negatively.
- The laggard profile generally receives poor ratings. However, for one provider, the company gets a better rating than the improver profile and the top-down default rating applied to non-CO2 intensive sectors.
Definitions
- ACT: Assessing low carbon transition.
- Carbon index: Carbon intensity of electricity production.
- GEVA: Greenhouse gas emissions per unit of value added.
- Mt: Million tonnes.
- NGO: Non-governmental organisation.
- SBT: Science-based target.
- SDA: Sectoral decarbonisation approach.
- tCO2/MWh: Tonnes of CO2 per megawatt-hour produced.
___________________________________
1 Global Carbon Project (December 2020) “Temporary reduction in daily global CO2 emissions during the Covid-19 forced confinement”.
2 IPCC Special Report (2018) “Global Warming of 1.5 ºC”.
3 Paris Agreement (2016).
4 See p. 12 for a comparison of data providers’ methodologies.


Authors