
Summary
Gold’s performance has been boosted by factors such as geopolitics, central banks purchases, and expectations of Fed’s rate cuts. Looking ahead, we see the metal as a structural call linked to its hedging features, even if there is some volatility in the short term.
Monetary easing, fears about global investors’ moving away from the dollar and the Fed’s independence are underpinning gold demand, in our view.
Markets will look at upcoming US data for confirmation of the US economy’s slowdown and, hence, of Fed rate cut expectations.
Overall, the precious metal may offer good diversification1 benefits and stability from geopolitics tensions in the long term.
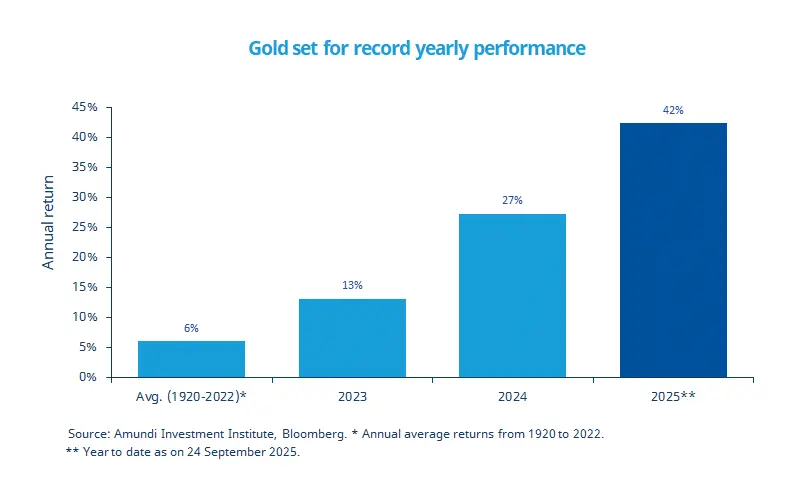
Gold prices set new record highs recently above $3,700 per ounce and are on track to deliver returns above 40% this year, the strongest yearly performance since 1980. This stellar performance follows already strong gains in 2023 and 2024, and compares with the long-term average annual return of around 6.0%. While geopolitical risks were the main driver in the first half of this year, monetary easing expectations have been the primary driver in the second half so far, coupled with expectations of dollar weakness in a context of diversification1 of global portfolios. Looking ahead, rising fiscal deficits (excess of government expenditure over revenues) - both in the US and Europe - and high debt could support demand for the metal as a safe-haven asset. However, high valuations mean we might see a pullback and volatility. In any case, we see the metal as a long-term call that could provide investors with stability from fiscal risks, geopolitical tensions, and a Fed inclined to cut policy rates.
This week at a glance
Equity markets were mixed last week, as investors pondered the Fed’s rate cut path following strong US data. Government bond yields were mostly on the rise. In commodity markets, gold set a new all-time high above $3,800 per ounce, boosted by a weaker dollar.
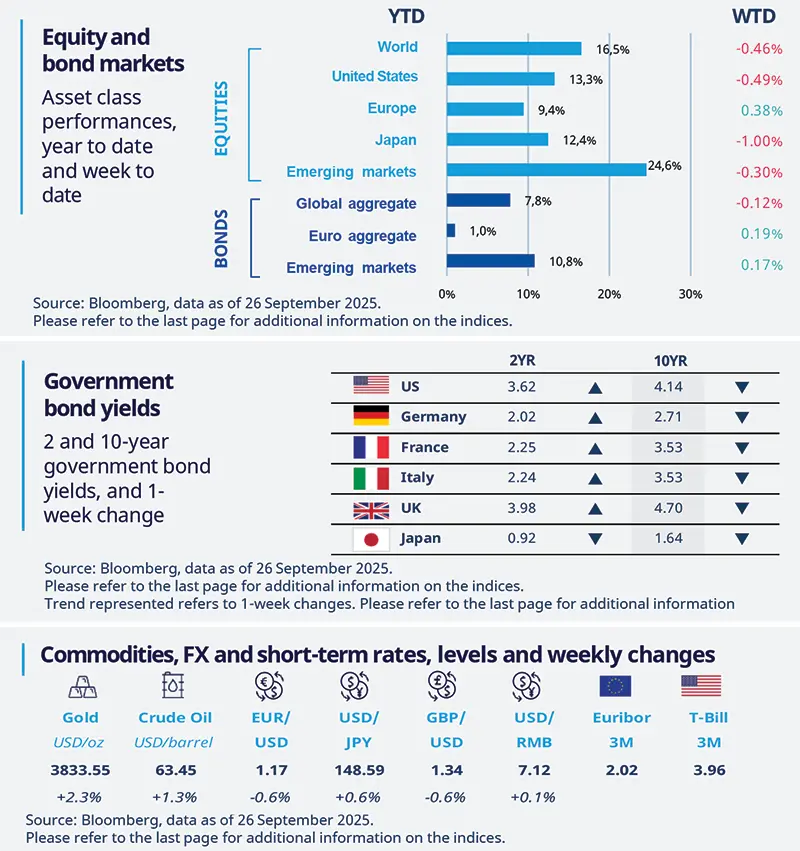
Equity and bond markets (chart)
Source: Bloomberg. Markets are represented by the following indices: World Equities = MSCI AC World Index (USD) United States = S&P 500 (USD), Europe = Europe Stoxx 600 (EUR), Japan = TOPIX (YEN), Emerging Markets = MSCI Emerging (USD), Global Aggregate = Bloomberg Global Aggregate USD Euro Aggregate = Bloomberg Euro Aggregate (EUR), Emerging = JPM EMBI Global Diversified (USD).
All indices are calculated on spot prices and are gross of fees and taxation.
Government bond yields (table), Commodities, FX and short-term rates.
Source: Bloomberg, data as of 26 September 2025. The chart shows gold’s average annual return since 1920.
1Diversification does not guarantee a profit or protect against a loss.
Amundi Investment Institute Macro Focus
Americas
US GDP revisions show stronger past growth
This week, revisions to GDP - spanning from 2020 to 2025 - showed a non-negligible upgrade to domestic demand in 2025, with consumer spending and domestic demand stronger than previously estimated. Real GDP was revised up to 3.8% from 3.3% in the second quarter of 2025. The update amplifies the divergence between activity (better than expected) and employment signals, which have been softening.
Europe
Resilient EZ PMIs amid manufacturing weakness
The EZ composite index increased to a 16-month high at 51.2, adding to the area’s upbeat growth outlook, particularly with the fiscal stimulus ahead. However, the picture was mixed across countries, with Germany’s composite PMI leading the advance. On the other hand, France’s index fell below the 50 expansionary threshold. Across sectors, the manufacturing indices deteriorated, feeling the brunt of US tariffs.
Asia
Pharma tariffs carry limited impact bite for Asia
Starting 1st October 2025, the US will impose a 100% tariff on branded or patented pharmaceutical products unless companies build manufacturing plants in America. Although Singapore, China, and India are major pharma exporters in Asia, most of their exports fall under the exempted non-patented category, reducing the tariff’s overall impact. Hence, despite the high tariff rate, its narrower coverage means it may have less effect than the headline suggests.
Key dates
30 Sep China manufacturing and non-manufacturing PMIs |
1 Oct EZ inflation, US ISM manufacturing PMI, Japan Tankan index | 3 Oct US non-farm payrolls, unemployment rate, and ISM services PMI |


Authors