
Summary
We are in a regime of higher yields for longer across the globe. Bond volatility is likely to stay higher than in the past decade, but yields are becoming increasingly attractive.
In US markets, after the 10- and 30- year yields, the 5-year maturity also moved above the of 5% threshold, the highest level in two decades.
The move is global. German bonds also rose, with the 10-year reaching 3.6%, its highest level since 2009, while the Japanese 10-year climbed above 3%.
Interest rate levels are becoming increasingly attractive, creating opportunities to add portfolio income through a diversified and dynamic approach.
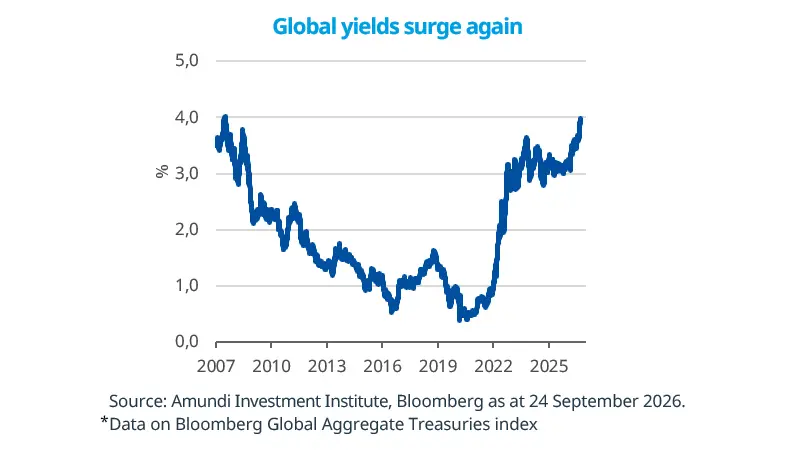
Bond yields moved higher again, pushing the average yield on global government debt* close to 4%, the highest level since 2007. The latest move was driven by strong US activity indicators (PMIs), in both manufacturing and services, which confirmed the resilience of the US economy, as recently highlighted by Fed Chair Warsh. Higher oil prices, with Brent rising above $105 a barrel, and a weaker US debt auction have also added pressure. Markets also continue to factor in a more hawkish Fed and heavy government and corporate borrowing.
Taken together, these factors are consistent with the view that the investment cycle and elevated funding needs are keeping yields structurally high, while Fed repricing and oil uncertainty are better explaining the recent moves, with inflation expectations well anchored over the long term.
This week at a glance
Global equities were supported by news of successful AI product launches and strong business sentiment indicators. In the fixed income markets, long-term yields rose to their highest levels in a decade. Pressure on bonds intensified as energy prices surged and business sentiment data beat expectations. Brent Oil prices rose during the week before falling at the end on prospects of a US-Iran agreement. Gold fell amid high real yields and a firmer US dollar.
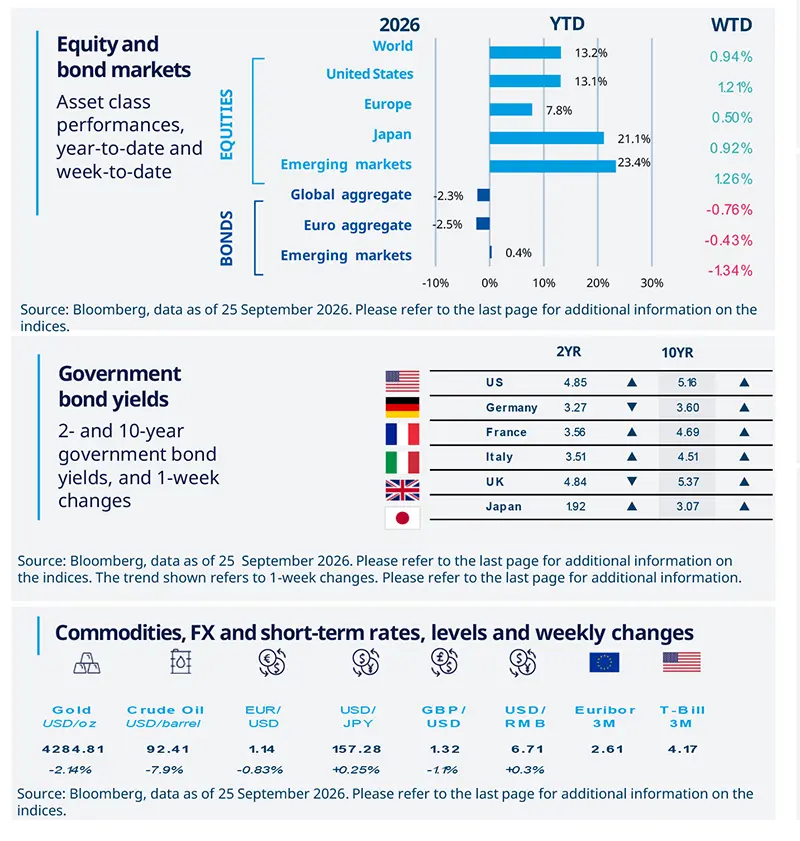
Equity and bond markets (chart)
Source: Bloomberg. Markets are represented by the following indices: World Equities = MSCI AC World Index (USD) United States = S&P 500 (USD), Europe = Europe Stoxx 600 (EUR), Japan = TOPIX (YEN), Emerging Markets = MSCI Emerging (USD), Global Aggregate = Bloomberg Global Aggregate USD Euro Aggregate = Bloomberg Euro Aggregate (EUR), Emerging = JPM EMBI Global Diversified (USD).
All indices are calculated on spot prices and are gross of fees and taxation.
Government bond yields (table), Commodities, FX and short-term rates.
Source: Bloomberg, data as of 25 September 2026. The chart shows the price of gold.
Diversification does not guarantee a profit or protect against a loss.
Amundi Investment Institute Macro Focus
Americas
Strong US business activity surveys
A closely watched US PMI survey, covering both manufacturing and services, rose to its highest level since mid-2021 in September and came in well above expectations. Manufacturing led the improvement, while hiring picked up at the fastest pace in more than four years both in service and manufacturing. The reading points to an economy that is still holding up well despite higher borrowing costs, and it contributed to the rise in bond yields.
Europe
Euro Area business activity stronger than expected
The Euro Area business survey beat expectations in September. The composite reading rose to 53.1, suggesting the economy is holding up better than expected. The sectoral breakdown showed strength in services, while the manufacturing figure remain unchanged. Input costs and output prices re-accelerated. The European Central Bank’s chief economist warned that higher oil and gas prices could keep inflation elevated for longer.
Asia
Bank Indonesia on hold
The Indonesian central bank left policy rates unchanged at the September meeting. The statement focused mainly on measures that have been implemented and expanded to support stability in the Indonesian rupiah, which remains an important driver of future inflation. Despite the Fed’s hikes, Bank Indonesia is expected to continue using all available tools to support currency stability before resuming rate hikes, following its most recent mini-cycle of 100 bps between May and June.
Key dates
China PMI, JP Industrial Production, US ADP Employment Report and PCE Price Index |
Japan Tankan, EZ Manufacturing PMI, US ISM Manufacturing |
Japan CPI, EZ CPI, US Non-Farm Payrolls and Durable Goods Orders |


Authors