
Summary
The AI trade is facing greater scrutiny as the path for rates remains uncertain and IPO supply rises,
underscoring the case for diversification and selectivity.
AI’s reality check reinforces diversification
South Korea has experienced strong market swings in recent weeks, as the AI trade has come under pressure at a global level.
Markets are questioning whether AI’s high valuations are still justified as the interest-rate environment remains uncertain and IPO supply increases.
As the AI theme comes under scrutiny, investors should stay cautious and continue to favour diversification away from concentration risk.
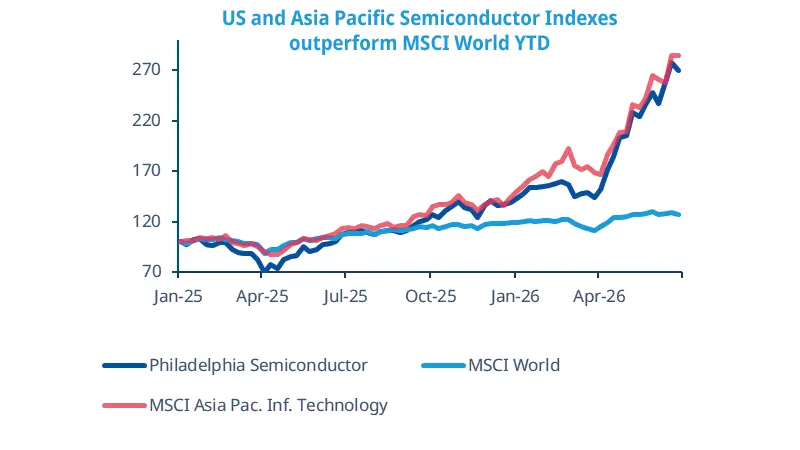
Source: Amundi Investment Institute, Bloomberg, as at 26 June 2026. Indices rebased to 100.
AI-related stocks have come under scrutiny, as central banks have adopted a more hawkish stance, prompting markets to reassess the sustainability of the AI trade’s valuations. This has led to some rotation into less crowded parts of the market.
The sharp rally in the heavily concentrated South Korean market since the start of the year has come under scrutiny lately, with surging market volatility amplified by erratic flows from speculative, leveraged and retail accounts.
We expect questions around the monetisation of AI investment, as well as valuations and concentration risks, to remain in focus. The melt-up in the market has been most evident among memory-chip makers, where supply bottlenecks are created by surging demand. However, scarcity will not last forever as innovation is advancing rapidly. While cash flows are very strong today, their medium-term outlook remains uncertain — these factors reinforce the need for diversification.
This week at a glance
Technology stocks pulled global indices lower, largely due to selling in semiconductor manufacturers. European indices closed marginally higher, as they are less exposed to shifting sentiment around technology. Oil prices moved back towards pre-war levels as Gulf flows gradually picked up. Bonds reacted positively as inflation fears receded. Meanwhile, the US dollar gained.
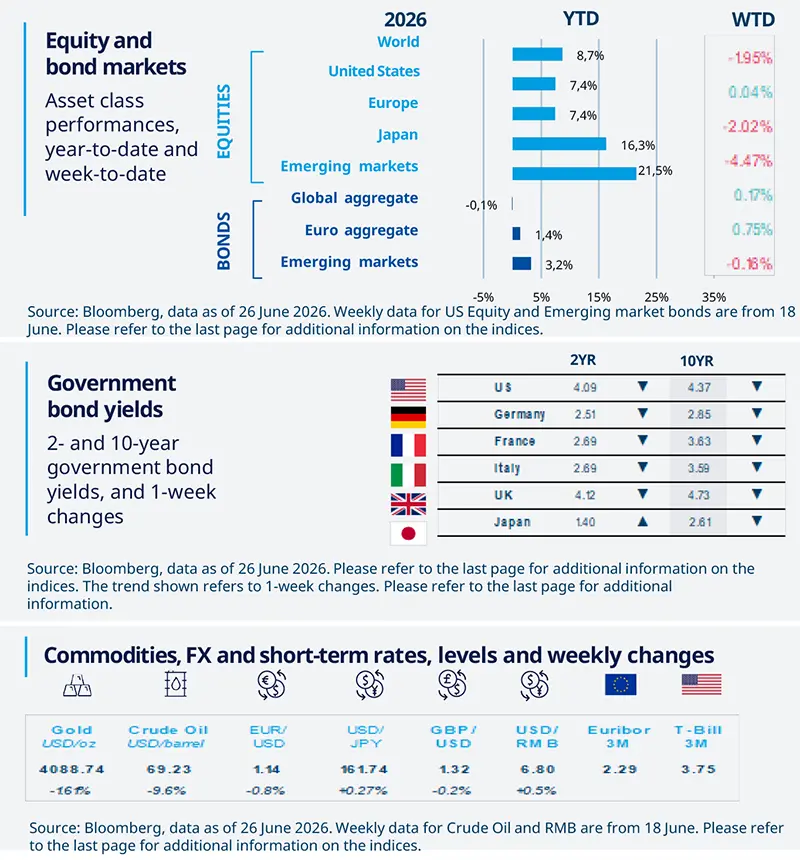
Equity and bond markets (chart)
Source: Bloomberg. Markets are represented by the following indices: World Equities = MSCI AC World Index (USD) United States = S&P 500 (USD), Europe = Europe Stoxx 600 (EUR), Japan = TOPIX (YEN), Emerging Markets = MSCI Emerging (USD), Global Aggregate = Bloomberg Global Aggregate USD Euro Aggregate = Bloomberg Euro Aggregate (EUR), Emerging = JPM EMBI Global Diversified (USD).
All indices are calculated on spot prices and are gross of fees and taxation.
Government bond yields (table), Commodities, FX and short-term rates.
Source: Bloomberg, data as of 26 June 2026. The chart shows the price of gold.
Diversification does not guarantee a profit or protect against a loss.
Amundi Investment Institute Macro Focus
Americas
US consumption remains resilient
Personal spending rose 0.7% M0M in May, above consensus expectations, reflecting broad-based strength in both goods and services. The increase was supported by a 0.7% rise in nominal personal income. In real terms, spending rose 0.3%, suggesting somewhat firmer underlying consumption, particularly in goods. The personal saving rate held steady at 3.0% after April’s figure was revised higher. The low savings rate remains consistent with elevated tax refunds and supportive wealth effects, which are likely limiting households’ need for precautionary saving.
Europe
Eurozone activity cools, services lead the weakness
In the Eurozone, the composite PMI survey suggests that economic growth somewhat decelerated in Q2, with activity weakening — though not collapsing — under the drag of high commodity prices, despite June’s monthly reading improving slightly. In fact, the Q2 average is 48.9, below Q1’s 51.3, signalling weaker momentum. The country breakdown suggests that activity is weak across the region, while the sectoral breakdown shows that services remain the main source of weakness. Although still in expansion territory, the manufacturing index also moderated.
Asia
Asia’s semiconductor upswing continues
Data from Asia confirm that the AI-led semiconductor cycle remains firmly intact. In Taiwan, export orders growth picked up to 48.6% YoY in the first two months of Q2, up from 44.4% in Q1. Imports of capital goods, a close proxy for capex, are tracking close to 20% annualised growth. Meanwhile, Korea’s exports in the first 20 days of June accelerated to 60.4% YoY, from an average of 50.5% in Q1. For EM Asia earnings, the AI demand impulse now appears sufficiently robust to offset the oil drag stemming from the Iran conflict in Q2.
Key Dates
China PMI, US consumer confidence and JOLTS data, Japan industrial production |
Japan Tankan, EZ CPI and PMI, US ISM Manufacturing, Indonesia CPI |
South Korea CPI, US Nonfarm payrolls and durable goods order |

Authors