
Summary
Executive summary
As the investment landscape evolves, the integration of artificial intelligence (AI) technologies with human cognitive processes emerges as the next frontier in investments.
The applications of AI in investments are extensive, ranging from research and responsible investment integration to data enhancement and investment communication. For example, machine learning models can enhance data management by reducing noise, ensuring that extensive data is not only usable but also relevant to investment processes1. Moreover, AI technologies can mitigate decision-making biases and highlight hidden risks.
A further benefit of this transformative technology is its potential to foster creativity. For example, within the research function, large language models (e.g., ChatGPT) can help create new sources of data, generate proprietary insights and inspire new research in fields, such as geopolitics, economic cycles and responsible investment. Ultimately, AI may enhance the overall investment expertise, paving the way for more informed investment decisions.
This new frontier demands that asset managers develop a distinct AI identity. To do so, it is critical that they cultivate engagement across their organisations to ensure a full understanding of the technology's capabilities, and its potential to enhance both investment decision-making and the client experience. The expected benefits of AI can be summarised as follows:
Improving data management: Unlocks previously unmanageable data and reduces noise.
Cultivating AI identity: A deep engagement from all teams can generate a competitive advantage.
Enhancing investment expertise: Enables faster response to changing markets.
Sharing knowledge: Unifies knowledge and encourages collaboration across teams.
Transforming research and insight experience: AI is inspiring new research processes and insights.
We at Amundi are focused on building an infrastructure that is tailored to our needs, working with knowledge developed internally while using AI to promote innovation, especially in the research field. However, on a cautious note, deep AI integration requires a high level of attention to data quality, potential manipulations and herd behaviours that could lead to systemic risk if many market participants use the same approaches and data. Thus, it is both unlikely and undesirable for AI to replace human-led final investment decisions.
Overall, we believe that the integration of AI will present a transformative opportunity to enhance knowledge management and develop actionable insights, enabling clients to navigate the complexities of financial markets more effectively as AI capabilities increase.
AI is opening up new possibilities. For investors, fostering their own AI identity is essential to empower human creativity and adapt to evolving market conditions
| VINCENT MORTIER Group CIO, Amundi | MONICA DEFEND Head of Amundi Investment Institute |
AI in research and investment
While there are various areas of AI application in asset management, this paper focuses mainly on data analysis and research, which are key areas where we have begun to see AI has a significant impact.
Within the investment research function, AI not only reduces data noise but also aids the analysis of unstructured data sources that were previously inaccessible, such as news articles, social media and satellite imagery. This inspires new areas of research in different fields such as geopolitics, macroeconomics, asset allocation and responsible investments.
However, integrating AI comes with challenges. Historical patterns may not reliably predict future market behaviour, algorithms can overlook critical factors, and machines can find spurious relationships that are just aberrations. Therefore, human oversight is essential when AI technologies are used. Furthermore, direct interactions with companies, clients and analysts provide insights that AI cannot capture, making a constructive human-machine feedback loop vital for managing biases and addressing AI limitations.
There are different ways to approach AI integration in investing. In our view, successful integration relies on two key principles:
Firstly, investors should rely on an infrastructure that is tailored to their needs and uses knowledge that they control. As the human–AI collaboration evolves, the bridging of investment expertise across an organisation, from data analysis to the client experience, will be enhanced. This should lead to adaptive investment processes.
Secondly, no single action should lack human supervision. We believe this oversight is necessary to make the most of combining human creativity with value-added input from what can be systematically extracted from large amounts of data.
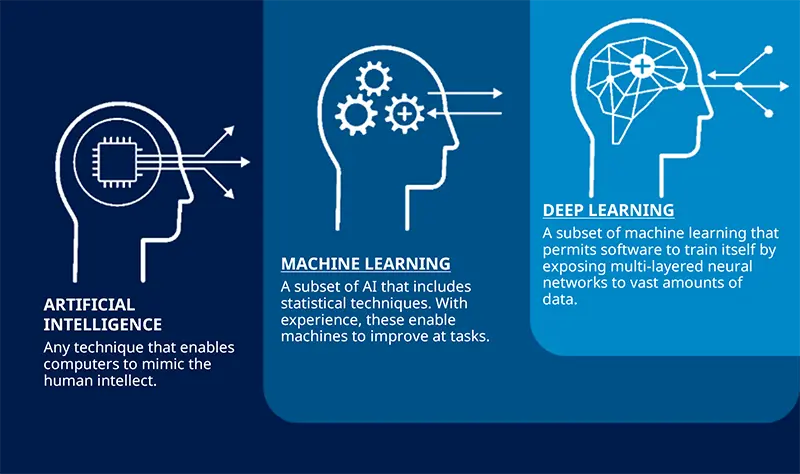
Defining Artificial Intelligence AI technologies, including machine learning and deep learning, enable software applications to forecast outcomes more accurately without being explicitly programmed to do so. Deep learning, a subset of machine learning, uses artificial neural networks structured in layers to learn and make decisions. These technologies analyse data to identify correlations, relying on acquired knowledge and patterns. They are based on cognitive processes such as learning (converting data into information), reasoning (selecting algorithms for tasks), and self-correction (improving algorithms).
|
AI adds value in data analysis
One area where AI can add value is in data analysis. The Amundi Investment Institute and Amundi Technology teams have partnered to build tools that can enhance data analysis in relation to risk factors and macroeconomic variables (factors) to help investors better understand their portfolio’s risk exposure. To identify and incorporate the most relevant factors into a risk model, these teams combined their expertise to develop a machine learning multi-factor correlation model for data sensitivity analysis within portfolios.
This model calculates the sensitivity of a portfolio against a set of different factors (+100 factors). The calculation is done at the stock level. The main goal is to understand which factors are relevant (among those 100+ factors), affecting a portfolio’s risk and performance.
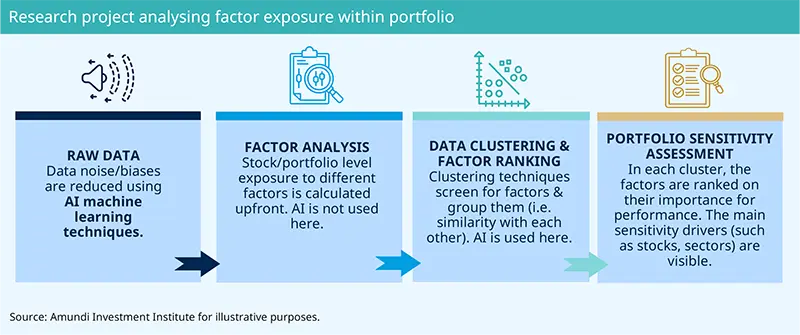
Raw data: The creation of a data warehouse begins with aggregating data sources within the organisation. The algorithm helps reduce data noise and determine the data structure from historical data.
Initial factor analysis: Stock and portfolio level sensitivity to different factors is calculated upfront using the raw data. We derive sensitivity against each factor at a stock level, from which the portfolio sensitivity to that factor is calculated. AI is not used in this part of the process. The clustering technique (next phase) is done using these sensitivity figures.
Data clustering and factor ranking: Using clustering techniques, the similarities between factors are quantified, and the data points are grouped into clusters according to their similarity with each other. For example, in Figure 2, the algorithm shows the clusters in a portfolio. The bigger the bubble, the more relevant this set of factors is for the portfolio.
For example, the most important cluster in this example is number 33. The clusters are not given names, as there can be many factors in a single cluster (hence it would be difficult to select an appropriate name), but the grouping of factors into clusters helps to highlight the main risk drivers within a portfolio. The large bubbles are very visible graphically versus the rest of the small-size clusters which would be considered noise.
Figure 2:
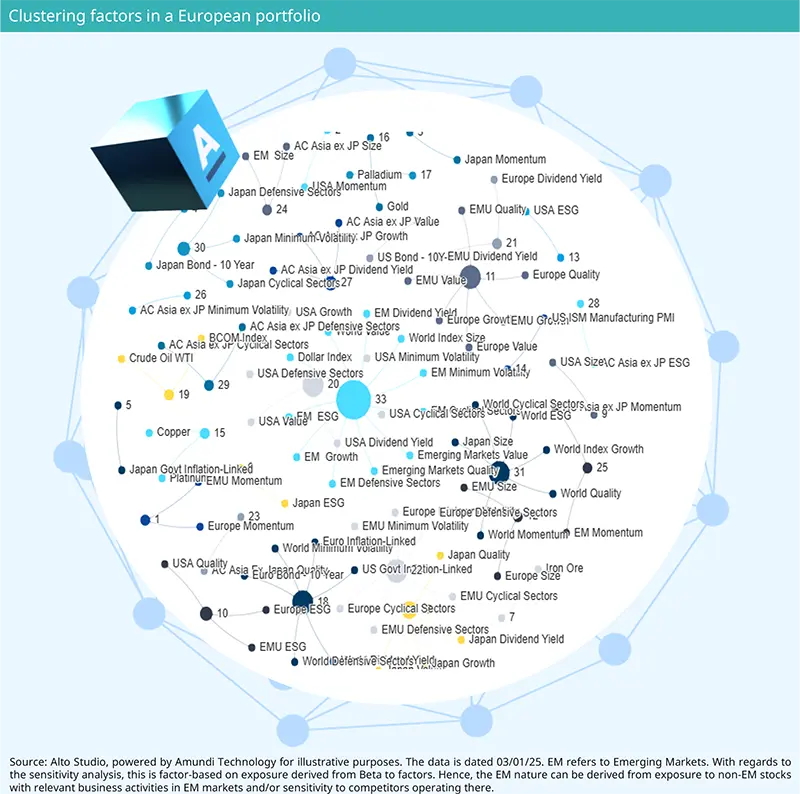
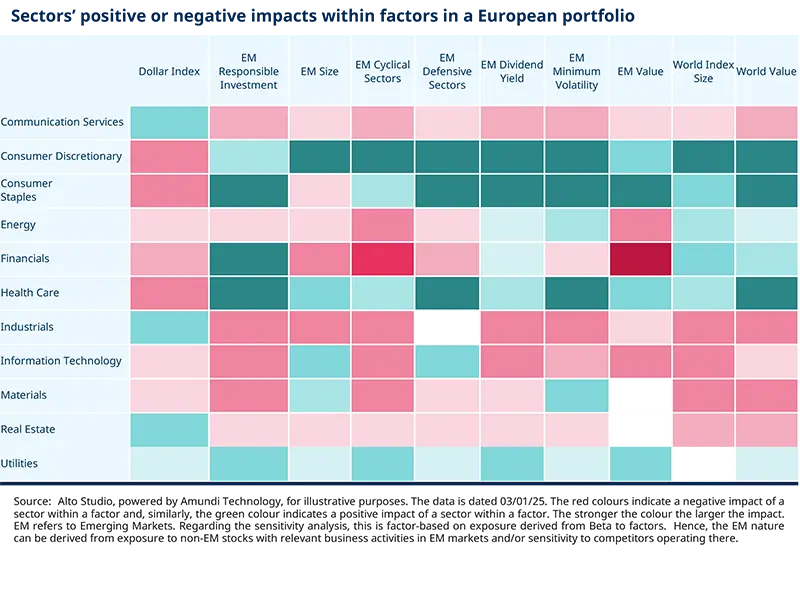
The model allows one to look inside each cluster and see the portfolio’s sensitivity to the factors within. The factors are ranked by the model based on their relevance to the portfolio’s performance, thereby reducing noise in large datasets. Thus, the model highlights what managers need to focus on. Digging deeper into cluster 33, the main positive factor driving this cluster is the EM Defensive Sectors factor. On the negative side, the EM Cyclical Sectors factor is expected to have the largest adverse effect on performance.

Benjamin LUCAS
In an increasingly complex world, technology is becoming a vital enabler of investment management, cutting through and reducing behavioural biases.
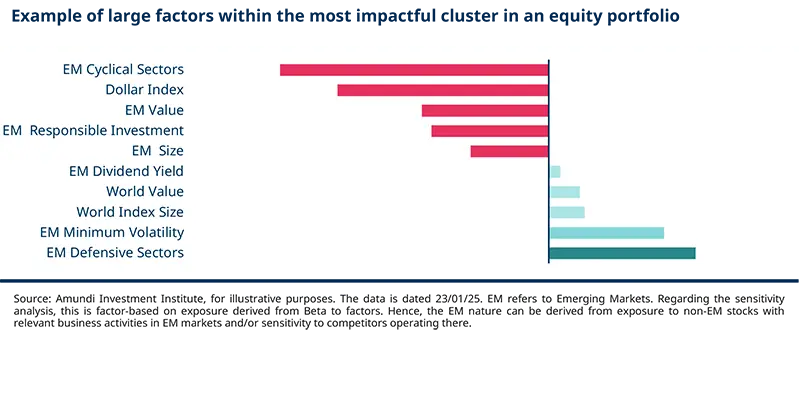
The users can drill down to a sector level and see within a factor (e.g., the EM Cyclical Sectors), which sectors are contributing the most to its positive (green) or negative (red) impact. For example, the financial sector had the largest negative contribution to the EM Cyclical Sectors’ impact.
Portfolio assessment: Due to the clustering technique, the key sensitivity drivers at the stock, sector and portfolio levels are visible. These can be focused on to determine if this exposure (or level of exposure) is actually wanted. In essence, using AI in data analysis helps to reduce errors in decision-making.
Box 1: AI-driven enhancements to raw data
AI enhances data usability in several ways, including:
Broader data sourcing: Multiple datasets are aggregated to build a model that can generate a “variant perspective” on any security or portfolio. For example, it can measure the sensitivity of a sector’s return to a change in a factor (e.g., World Quality).
Improved Data quality: Before using the data in a developed model, it needs to be reworked. The presence of outliers and/or too much volatility can distort an overall trend2. Machine learning techniques are used initially to perform a check on the raw data to ensure that any noise within it is reduced and that it is relevant for particular portfolios.

Takaya SEKINE
By developing a model that cuts through the noise and biases in data, AI helps us search vast datasets to extract significant, value-added insights.

AI can be designed to employ mathematical techniques such as loss functions (e.g., Huber Loss) that measure how well the predictions of a model match the actual data. The Huber Loss function is less sensitive to outliers in the data than more traditional models. The goal of a machine learning algorithm is to minimise the loss function, as a lower loss indicates better model performance (e.g., showing the model has good predictive capabilities). Using these tools can result in estimates that are more stable over time.

Matthieu KEIP
While human judgment is still key, AI is steadily improving our ability to analyse data and discover new investment opportunities. It is an evolving process, and we are learning more every day about how to best combine technology with experience to enable smarter decisions.
AI in cross asset scenario analysis
Interview with LORENZO PORTELLI Head of Cross Asset Research, Amundi Investment Institute |
Do you find that machine learning is a useful methodology in asset allocation decision-making?
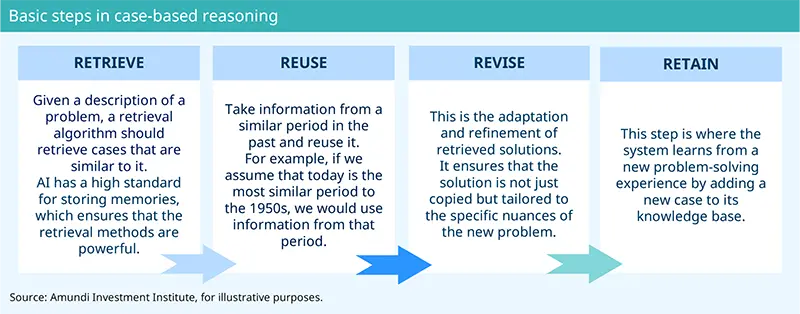
We have been using machine learning since 2009 to make asset allocation decisions. Our approach is based on an AI methodology called case-based reasoning (CBR). This is a problem-solving approach that leverages past experiences to address new situations. It is based on the idea that similar problems often have similar successful solutions which is how humans typically approach solving problems. We leverage several definitions of similarity, as we do not want models that are too rigidly structured on the past. CBR is a type of lazy learning in which most of the computation time is deferred until a query is made. Thus, it is less rigidly structured on the past than other types of machine learning.
What are the basic steps in CBR?
The CBR reasoning is based on the process of the four Rs: Retrieve, Reuse, Revise and Retain.
How do you use CBR to infer what are the most likely financial/economic regimes?
Taking advantage of our multi-year experience in cross-asset modelling, we at the Amundi Investment Institute have leveraged AI to develop an innovative tool called the Advanced Investment Phazer (AIP). This tool embraces the multi-dimensionality of regime determination by encompassing a range of global variables. Its aim is to build the optimal portfolio allocation, with the potential for outperformance and drawdown minimisation through diversification across different asset classes. Regimes are identified by a clustering algorithm applied to a complete set of macro-financial variables. These variables are split into four groups: growth, inflation, monetary policy and financial leverage. There are five phases – Correction, Contraction, Recovery, Late Cycle and Asset Reflation – each with specific reference values. Using CBR, we look at past periods that are similar to the current environment and its possible future changes. To do this, we measure the distance between an array of forecasts for our factors and each regime’s thresholds. This distance determines the likelihood of each phase occurring in the future (i.e., the smaller the difference, the higher the probability).
The resulting optimal portfolio allocation will hinge on the probability distribution of the regimes over the forecasting horizon and the returns that asset classes have delivered historically in each phase. The idea is simple: we can infer that today is somewhat similar to the 1950s and deduce the range of possible expected returns for the S&P 500 Index and other main asset classes. However, today’s markets are more expensive than they were in the 1950s. Therefore, we use this information to revise expectations and build a final optimal allocation.
Does generative AI enable new fields of research that were not possible before?
We already had a framework for asset allocation that used machine learning, but generative AI has added an additional dimension. For example, we can attach an asset allocation to any specific text generated by AI describing a scenario (e.g., geopolitics). It is also possible to use generative AI to include the insights of Amundi’s geopolitical analyst into our modelling.
Finally, using generative AI, we can also generate a scenario that has never happened without any specific assumptions on micro variables or finance. In the past, without generative AI, this was a type of research that was not even possible to address.
Box 2: Inserting a geopolitical perspective into a macro/financial outlook
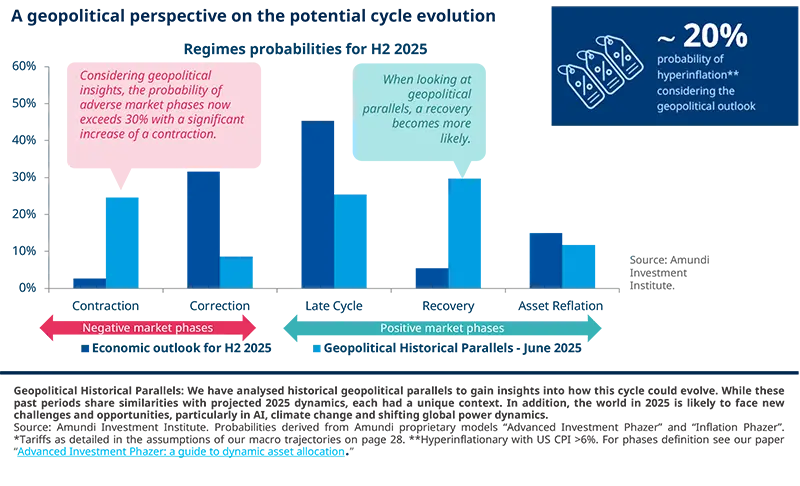
A good example of an application of generative AI in our macro/financial modelling can be found in our latest outlook. Here, we have incorporated the assessment of Amundi’s geopolitical expert regarding the geopolitical scenario for the coming years into our modelling for the H2 2025 Investment Outlook (2025 Mid-Year Outlook).
We analysed historical geopolitical parallels to gain insights into how the economic cycle could evolve. While these past periods share similarities with projected 2025 dynamics, each had a unique context. In addition, we needed to factor in that the world in 2025 is likely to face new challenges and opportunities, particularly in AI, climate change and shifting global power dynamics. The outcome of our work provided probabilities of movement in a particular direction towards a specific regime based on this examination.
Five examples of new research fields
Natural language processing (NLP) tools can extract information from unstructured data sources, such as company reports, news articles, broker research and images. As a result, a large amount of information can be included in financial analysis without manual processing. This can reveal insights that may otherwise have remained out of sight and open new fields of research. Our research team studied the value of NLP tools in building news signals.
Examples of Amundi Investment Institute research with AI
April 2024 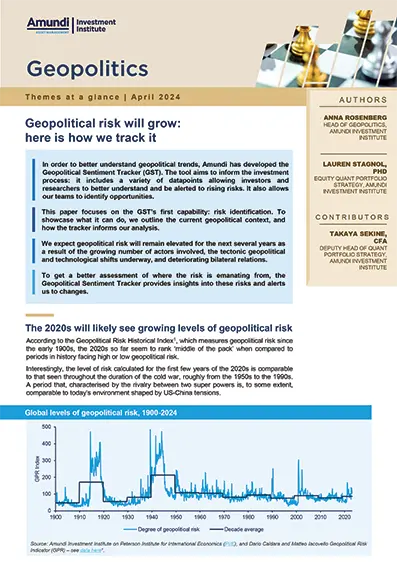
| What was the aim of the research? Amundi’s Investment Institute’s Quant Portfolio Strategy team and Head of Geopolitics developed the Geopolitical Sentiment Tracker (GST) (Geopolitical risk will grow: here is how we track it). The aim was to help our macro research team and portfolio managers better quantify risk in a holistic way. | |
How did AI make it possible? Our tracker looks at political stability. The dataset is derived from GDELT which continuously monitors print, broadcast, and web news media in over 100 languages. The GDELT is open source, but we have built up our data by customising it for our own purposes. We currently cover 63 countries to reflect the MSCI developed and emerging indices. We do not just compare countries on their risk levels but also create sub-indices that measure local political risk and the risk in bilateral relations. What was achieved using AI? Using the GST, we can: compare political risk between countries based on bottom-up fundamental analysis and real-time developments; monitor local political stability; assess the stability of bilateral relations; and help investors understand market sentiment towards countries and bilateral relations. Exemple of outcome 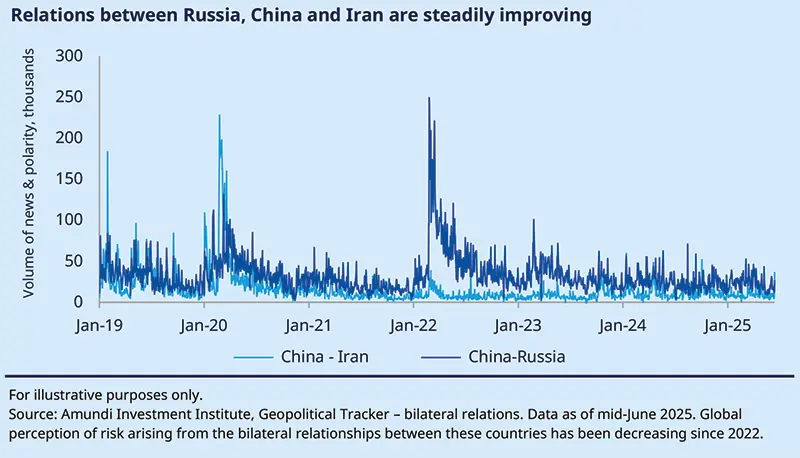
| ||
December 2024 
| What was the aim of the research? The aim of the research paper was to review the use of AI in the responsible investment field. | |
How does AI contribute to responsible investment? Traditional responsible investment rating providers depend on company disclosures and human analysis, raising concerns about the subjectivity involved in selecting responsible investment criteria and reliance on company data. The use of AI involves textual analysis to measure firms’ responsible investment incidents or verify the credibility of companies’ concrete commitments. Also, satellite and sensor data are useful in analysing companies’ environmental impacts, estimating physical risk exposures and providing missing corporate data (e.g., GHG emissions). Lastly, investors can use AI to obtain more accurate information about a company’s supply chain relationships and detect greenwashing. How is the use of AI shaping responsible investing styles? The use of machine learning leads to more accurate predictions of corporate emissions than traditional measures. The rise of responsible investment has also sparked increased interest in thematic investing within this field, with a focus on areas such as energy transition, climate change adaptation and green innovation. NLP techniques have been highlighted as having great potential in this area due to their ability to summarise large amounts of textual data and identify relevant information (AI for sustainable finance: why it may help). | ||
To be published October 2025 What was the aim of the research? The aim of this paper is to revisit the key applications of AI in behavioural finance. Specifically, it highlights the ability of AI technologies to analyse investor profiles and predict investor behaviour as well as provide tools to enhance financial advice and coaching. How does AI contribute to enhancing risk mitigation and advisors’ services? AI technologies, such as deep learning (DL) and ensemble learning (EL), are now being used in credit scoring tasks3. These methods can handle non-linear relationships within data and different data types (e.g., text, images) which has ensured their outperformance of logistic regression in predicting investors’ behaviour. In the non-life insurance industry, AI technologies are enhancing predictive accuracy related to claim patterns, claim approvals and claim severity. Meanwhile, advisors are increasingly using clustering algorithms (unsupervised machine learning) to classify investors, and DL and EL to identify the most informative variables in predicting investors’ behaviour. Finally, recommender systems (RSs), a type of machine learning model, can offer personalised recommendations for portfolio allocation or stock selection. These AI technologies assist in recommending investment options to clients. What can be achieved going forward using AI? We have established that, when used wisely, AI technologies have the potential to enhance retail investors’ engagement, decision-making processes and financial literacy. In particular, by facilitating the development of personalised recommendation systems and coaching tools, AI helps retail investors avoid common mistakes and mitigate cognitive biases. However, we also recognise the need for robust regulatory frameworks and best practices to mitigate risks and ensure that AI deployment benefits both institutions and their clients in a responsible manner. |
February 2024 
| What was the aim of the research? The research paper’s aim is to review the benefits of aggregating financial forecasting strategies. | |
How does AI contribute to making the aggregation possible? In this paper, we apply an online aggregation-based forecasting model that combines several machine learning techniques to build a portfolio that dynamically adapts to market conditions. Thirteen different portfolios are constructed based on various machine learning algorithms, forecasting one-month ahead stock returns from companies’ financial characteristics. The dataset includes 94 characteristics for a large collection of 30,000 stocks over the 1957-2016 period. Ultimately, the aggregation provides a convex combination of the long and short strategies based on individual strategies’ forecasts to build a robust portfolio. What was achieved using AI? Choosing between several algorithms can be challenging, as their estimation accuracy may be unstable over time. AI technologies enable us to show that an aggregation of strategies outperforms individual algorithms, offering a higher portfolio Sharpe ratio and a lower shortfall, with similar turnover. The originality of the approach lies in applying online aggregation directly to strategies, providing an easy way to improve portfolio allocation by combining heterogeneous strategies into a single algorithm. The aggregation is not computationally costly and considers directly the forecasts of the strategies without any assumptions about the data distribution or the strategies’ models. Moreover, the aggregation permits a layer of analysis to understand why certain strategies perform better in given periods and allows for the detection of new market regimes (Expert aggregation for financial forecasting).
“Data science techniques are regularly tested in finance to improve traditional forecasting techniques. Machine learning algorithms address the challenges of high-dimensional data and enable the consideration of a broader class of functions, all of which improves predictions.” MARIE BRIÈRE, Head of Investor Intelligence & Academic Partnership | ||
January 2023 
| What was the aim of the research? Research conducted by the Amundi Investment Institute in stock analysis aimed to capture the tone in company news flow and determine when new information becomes reflected in share prices. | |
How did AI make it possible? The Amundi Investment Institute worked in partnership with Causality Link and the Toulouse School of Economics, using an AI-powered database to collate millions of documents in real time and identify cause-and-effect statements relating indicators and events. Combining textual analysis with predictive analytics provided valuable insights and forecasts for companies and industries that could not be generated with traditional data. Using their algorithm, the team extracted from news statements a company’s Key Performance Indicators (KPIs) and the direction of change of those KPIs (What do we learn from a machine understanding news content? Stock market reaction to news). What was achieved using AI? The research measured the strength of the positive and negative tones in news flow, the popularity and timeline of the news, as well as how and when new information was factored into share prices. Going further than other studies, this research tapped into various data sources to examine share price reactions across different-sized companies and news types | ||
Machine learning is a subset of AI that includes statistical techniques. With experience, these techniques enable machines to improve at tasks.
Outliers are data points that deviate significantly from the rest of the data. They can be due to measurement errors or natural variability.
Machine learning is a subset of AI that includes statistical techniques. With experience, these techniques enable machines to improve at tasks. Deep learning, a subset of machine learning, allows software to train itself by exposing multi-layered neural networks to vast amounts of data. Finally, ensemble learning is a technique that aggregates two or more learners (e.g. regression models, neural networks) to produce better predictions in modelling.


Authors