
Summary
Key takeaways
|
In the 2010s, private equity returns were largely driven by multiple expansion and financial leverage — both of which are likely to be structurally impaired going forward. The 2026–2035 decade requires a return architecture to be built on several pillars: income yield (contractual coupons, regulated returns, rental income), real earnings and cash flow growth (operational value creation, sector tailwinds), and selective illiquidity and complexity premia over liquid equivalents.
Three important considerations are worth highlighting before allocating to private and alternative assets. First, illiquidity budgeting and vintage pacing: elevated target allocations require disciplined vintage diversification and pacing plans to take liquidity management into account. Second, manager selection remains critical. CMA returns are portfolio averages, but net-of-fee returns vary widely across private assets and actual results depend critically on strategy niche, operational capability, and access to quality managers. Third, regional balance matters too. Divergences in valuations, sector composition, and macro trajectories between the US and Europe reinforce the case for deliberate cross-regional diversification within each private asset class.
Private equity divide – Europe pushed by strategic autonomy, US challenged by valuations
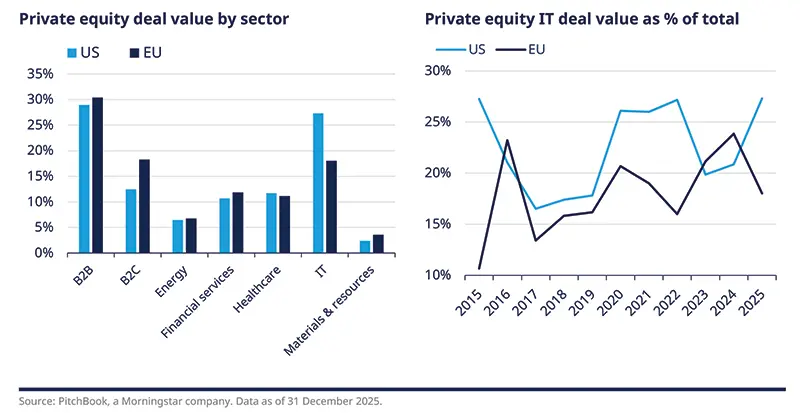
Private equity remains a cornerstone allocation, but the return premium over public equities has become increasingly polarised between the US and Europe. The 2010s convergence — both regions benefitted from cheap leverage and multiple expansion — is giving way to differentiation driven by entry valuation, sector composition, and macro trajectory. The US asset class could benefit from deep capital markets, AI and tech exposure, and more active and mature exit channels. However, elevated entry multiples and higher financing costs compress the value added relative to public equities, which is expected to halve compared to the past. Its European counterpart, by contrast, could benefit from materially lower starting valuations versus the US and sector tilts towards “old economy” businesses (industrials, capital goods, defence) which might be the direct beneficiaries of Europe’s strategic autonomy pivot and defence spending needs. All in all, expectations for European private equity are around 2.5% higher than those for US private equity.
Key risks include the close links between private equity and credit general partners, particularly through exposure to software businesses, as well as a delayed recovery in exit markets, which could extend J-curves and put pressure on Distribution-to-Paid-In-Capital (DPI) metrics.

Nicola ZANETTI
In private equity, the return premium over public equities has become increasingly polarised between the US and Europe.
Infrastructure equity gains momentum from digital and energy shifts
Infrastructure equity is one of the few asset classes where structural demand tailwinds are accelerating. The AI and digital infrastructure theme will drive the volume of physical investment in the data centres and fibre networks needed to support edge computing and the “AI from bytes to bricks” shift. The delayed energy transition still requires trillions in investment in the coming decades under long-term private or public-private regulated frameworks. Additionally, Europe's security pivot drives demand for logistics, communications, and energy independence infrastructure. Finally, the potential disruption caused by geopolitical events affecting commodities might require investors to increase exposure to inflation-linked assets such as indexed infrastructure contracts.
Private credit’s rise calls for discipline
Private credit assets under management are expected to double, if not triple, in size as banks retrench from leveraged lending. This asset class has attracted many market participants and is now facing a credibility issue, particularly in the US. Investors should focus on the carry this asset class can generate but be aware of the risks that come with it (liquidity, defaults and valuations). Selectivity will be key going forward: the margin for error is narrower and the return distribution is more asymmetric.
US direct lending stands out in terms of expected returns due to the elevated base rates, which create a structurally high starting yield, and to the leverage implemented at fund level, which could amplify the advantages (but also the risks), while deep sponsor relationships and stronger creditor protections support recovery rates. Themes to watch include deal exposure to software potentially becoming obsolete due to AI disruption, mispriced collateral, and funds’ leverage at the US level. In Europe, we expect banks’ retrenchment from mid-market lending to sustain structural deal flow for senior debt deals. Furthermore, different sector exposure and the lower penetration of private debt into retail investors’ portfolios could prevent the European market from experiencing potential disruption ahead. Overall, EU private credit shows an appealing risk-adjusted profile.

Viviana GISIMUNDO
In private credit, selectivity will be key going forward: the margin for error is narrower and the return distribution is more asymmetric.
Global real estate equity: an income recovery story
After a repricing in cap rates between 2022 and 2024, real estate has shifted from a valuation story to an income recovery story. Higher starting net rental yields are the primary return driver; limited near-term capital appreciation is expected. The US all-property spreads are at more expensive levels than in Europe. However, over the long-term, when valuation drivers dissipate, the expected returns of US real estate will overtake those of its European counterpart, guided by higher income yields and faster rental growth. Sector selection dominates all other allocation decisions. Logistics and industrial properties may be favoured in the US, but the picture is slightly different in Europe where hospitality, prime retail, prime office, residential and healthcare properties are more attractive for investors. More challenged sectors include traditional office and non-prime retail, reflecting structural work-from-home habits and the continued penetration of e-commerce.
Hedge funds set to benefit in an era of high dispersion
The "controlled disorder" backdrop — elevated dispersion, policy volatility and unstable correlations — is precisely the environment where hedge funds have historically added most value. Three structural features of the current regime stand out: elevated cross-sectional dispersion, policy uncertainty generating macro-opportunities, and low correlation to equities and bonds.
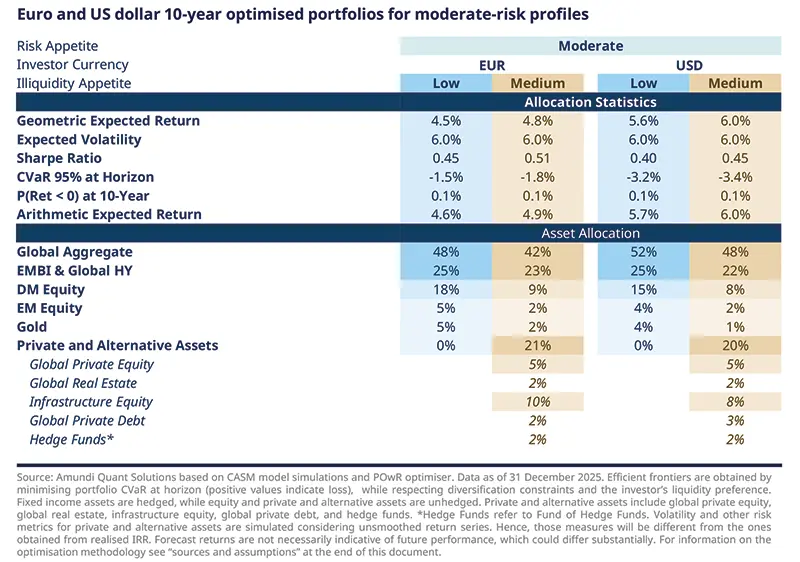
Strategic asset allocation for a moderate-risk investor
Euro-based investors with a moderate risk profile (with a 6% volatility target) can expect annual returns of about 4.5% over the next decade, increasing to 4.8% when private and alternative assets are included, while a dollar-based investor with the same profile can expect annual returns in the 5.6%-6.0% range. Compared with last year, expected return levels are broadly unchanged, but the underlying portfolio logic has become clearer. Bonds remain the portfolio anchor, equity risk becomes more selective, and private assets continue to enhance returns, although less mechanically than in the past.
Global aggregate bonds remain the SAA’s principal pillar, representing roughly 42%-48% of the euro investor’s portfolio and 48%-52% of the USD investor’s allocation. Their weight is slightly lower than last year, creating room for a measured allocation to gold, while the exposure to opportunistic fixed income — global high yield and EMBI — remains broadly stable at around 22%-25% across investor bases. For moderate-risk investors, this confirms that fixed income once again provides the core mix of income, resilience, and diversification.
Equity allocations have declined relative to last year, with a larger reduction in developed markets. This reflects our preference for emerging markets over developed markets when expected returns are considered alongside currency effects. In the USD portfolio, listed equity exposure falls to around 19%, partly because hedged foreign fixed income offers an advantage through positive carry.
Adding private and alternative assets for investors with a medium liquidity preference lifts expected returns by around 30-40 bps. In this profile, exposure to private and alternative assets rises to around 20%, with the main priorities remaining infrastructure, private equity and private debt. Private equity remains the main growth enhancer, while income-oriented alternatives such as private debt and infrastructure improve the overall risk-return profile. Regionally, EUR allocations show a stronger preference for infrastructure and private equity, while USD allocations show relatively more interest in private debt, reflecting the appeal of carry.
Gold also has a role in the moderate portfolio, but a measured one. Its weight remains around 5% or below, and becomes less important when private and alternative assets are included, since part of the diversification function is already provided elsewhere. Even so, EUR investors retain a somewhat stronger preference for gold, reflecting its role as a resilience asset in a more fragmented world.
Overall, the moderate-risk portfolio remains built around a simple logic: bonds first, selective risk second, private assets as enhancers, and gold as a complementary source of resilience.
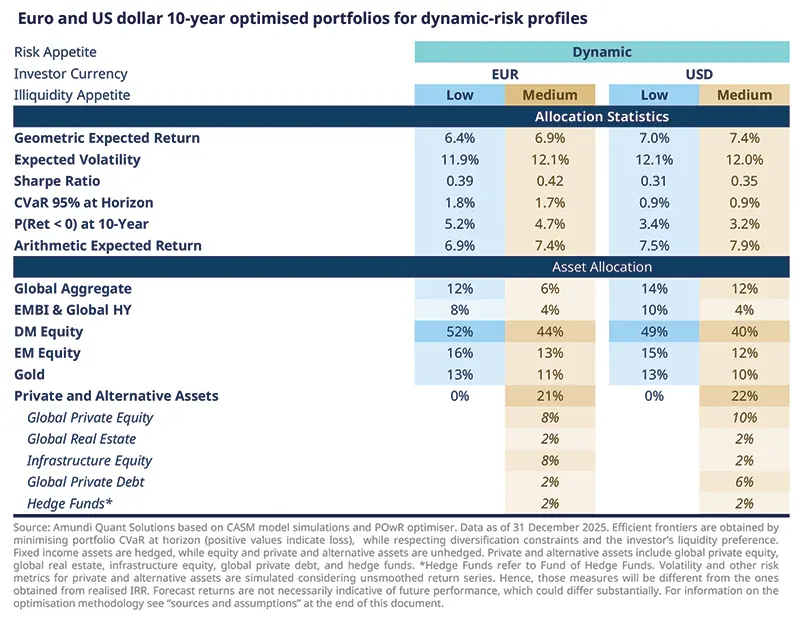
Strategic asset allocation for a dynamic-risk investor
Compared with a moderate-risk profile, return expectations for dynamic investors increase materially. For EUR investors, the expected return range rises to 6.4%-6.9%, close to 200 bps above the moderate profile. For USD investors, the range moves to 7.0%-7.4%, around 150 bps higher. Relative to last year, the improvement is more visible for EUR investors, with expected returns rising by around 70-80 bps, while the uplift for USD investors remains limited to around 10 bps.
For a dynamic investor targeting a volatility level of roughly 12%, the portfolio mix changes significantly. The overall bond allocation is reduced significantly, with opportunistic fixed income being the most affected segment. That released risk budget is redeployed into equities and gold, which take on a more prominent role in the portfolio. At this level of risk, the allocation is no longer simply an extension of the moderate profile; it becomes a different portfolio construction altogether, built around a broader set of return drivers.
Gold rises to around 10%-13% of the portfolio, highlighting that, in a higher-volatility regime, it serves not only as a diversifier but as a strategic allocation tool that strengthens resilience while preserving return potential. Private and alternative assets account for around 21%-22% of the portfolio, slightly above the moderate profile and above last year’s allocation. Within that bucket, the preference remains tilted towards private equity as the main growth engine, followed by infrastructure for EUR investors and private debt for USD investors. This mix also helps explain why the expected return improvement from adding private assets rises to around 40-50 bps for dynamic investors.
The regional allocation is also more explicit at this risk level. DM equity remains the largest listed-equity bucket, but EM equity still plays an important role, especially where stronger structural growth and diversification benefits justify the additional risk. The result is a portfolio that relies less on fixed income carry alone and more on a combination of equities for growth, gold for resilience, and private assets for selective return enhancement.
Overall, private and alternative assets continue to contribute positively to the portfolio’s Sharpe ratio and help keep tail risk under control. But their role should not be treated mechanically. At this risk level, implementation matters more: manager selection, liquidity budgeting, commitment pacing, vintage diversification, and governance discipline all become integral parts of the allocation decision.
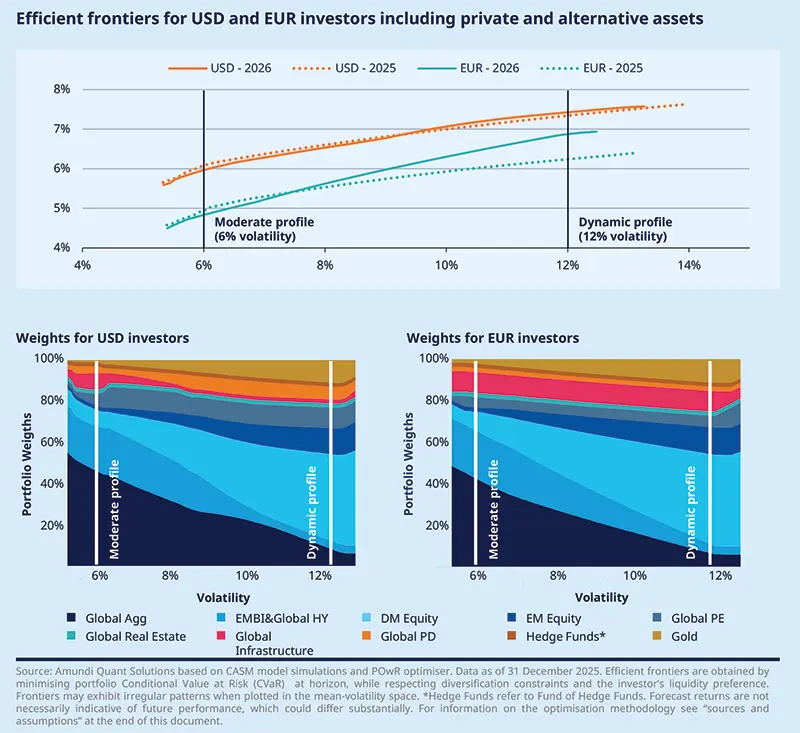
Asset allocation shifts along the efficient frontier in EUR and USD portfolios
The efficient frontiers that include private and alternative assets remain broadly consistent with last year’s results. The main change is that they now point to higher potential returns for EUR investors once portfolios move above the moderate-risk range, particularly for portfolios with simulated volatility above 8%, while the USD frontier remains broadly similar to last year’s.
The evolution of weights along the frontier shows that, as portfolios move toward higher risk profiles, bond allocations — notably global aggregate and EMBI & global HY — decline in favour of riskier liquid assets, gold and private assets. This is the key portfolio shift: at higher volatility levels, expected returns depend less on fixed income carry alone and more on a broader combination of growth, resilience, and illiquidity premia.
The charts also show that the private-asset mix differs across different risk profiles. At higher risk levels, USD allocations tend to favour private debt and private equity, reflecting the stronger role of carry and income generation, while EUR-based portfolios show a greater preference for infrastructure and private equity, where resilience, inflation linkage and regional opportunity sets are more supportive.
Overall, moderate profiles remain bond-anchored, while dynamic profiles rely increasingly on equities, gold and selective private assets. At this stage, composition matters more than broad market exposure, and base currency becomes an increasingly important driver of strategic allocation choices.
Sources and assumptions
Macroeconomic Assumptions are from Amundi Investment Institute and are based on internal models, Shared Socioeconomic Pathways and climate scenarios from The Network of Central Banks and Supervisors for Greening the Financial System. Economic forecasts are subject to change at any time. Forecasts are as of 31 March 2026. Long-term data beyond 2050 are equilibrium levels.
Sources of CMA: Amundi Asset Management CASM Model, Amundi Asset Management Quant Solutions and Amundi Investment Institute Teams. Macro figures as of the last release. The starting simulation date is 31 December 2025. Equity returns based on MSCI indices. Reference durations are average figures. Returns on credit assets are comprehensive of default losses. If not otherwise specified, expected returns are geometric annualised average total returns at the specific horizon. EM debt HC, EM-GBI, global infrastructure and hedge funds are in USD, all other indices are in local currency. Returns are nominal and gross of fees, except private and alternative assets which are net of management and admin fees. US direct lending considers leverage on the fund. Real estate refers to all property unlevered real estate. Hedge Funds refer to fund of Hedge funds. The expected returns consider the market beta and the alternative assets risk premium. The alpha return component generated by portfolio management, strategy selection or specific value creation programmes, which can be significant above all for private and alternative assets, is not considered in any form.
The arithmetic average returns are derived using the price generated by our simulation engine. By definition, the arithmetic mean is always greater than or equal to the geometric mean. In particular, the higher volatility of returns and higher frequency of returns and/or a longer time horizon will increase the difference between the two measures. Simulated volatilities are calculated on simulated prices over a 10-year horizon. Simulated volatility for private and alternative assets is derived from unsmoothed return series. Hence, this measure of volatility will be different from the one obtained from realised IRR. Expected returns are calculated using Amundi central scenario assumptions, which include climate transition. Forecast and fair values up to a 3-year horizon are provided by the Amundi Investment Institute Research team (macro, yields, spread and equity). Forecasts for annualised returns are based upon estimates and reflect subjective judgments and assumptions. These results were achieved by means of a mathematical formula and do not reflect the effect of unforeseen economic and market factors on decision-making. The forecast returns are not necessarily indicative of future performance.
Data sources: Bloomberg, Cambridge Associates, Global Financial Data. Edhec Infra, MSCI and MSCI Burgiss, Pitchbook, Preqin.
Indices: Equity indices are MSCI regional indices TR, Credit indices are from BofA Merrill Lynch, Aggregate indices are from Bloomberg Barclays, Govies and EM bonds indices are from JP Morgan.
G10 FX fair valuation models: Academic literature is full of theoretical foundations at the basis of currency fair valuation. Our battery of models leverages two main concepts: 1) Purchasing Power Parity equilibria (which in turn expresses FX equilibria as a function of relative price dynamics across countries) and 2) Behavioural Exchange Rate equilibria (where we focus on short- to long-term fundamental drivers. Purchasing Power Parity models: Standard PPPs rely on CPI differential, we enrich our framework to take into account two additional variations: 1) PPP based on PPI differential (to take into account the differential in the costs of production) and 2) a standard PPP but adjusted for productivity (we proxy with CPI-PPI differentials, following the Balassa-Samuelson framework). Both CPI and PPI induce a negative contribution to the FX (i.e. higher inflation means a depreciation in the long run), while higher productivity (i.e. higher CPI-PPI differential) empirically translates into stronger FX. Behavioural Exchange rate models: Here, we leverage the theoretical findings of Clark and McDonald and estimate FX equilibrium based on short- to medium- and long-term fundamental drivers. On top of inflation (our longest-term driver, given the empirical convergence rate from spot), we do consider 1) interest rate differentials, 2) terms of trade, 3) fiscal spending, 4) productivity (GDP per capita) and 5) the degree of openness of each G10 economy.
Methodology for Strategic Asset Allocation optimisation: Our optimisation framework minimises the 95% CVaR at a 10-year horizon by targeting different levels of expected return, while respecting diversification constraints and the investor’s liquidity preference. The 95% CVaR at horizon is a shortfall risk measure representing the average annualised simulated returns over a 10-year horizon that fall below the 5th percentile. The optimal allocations are presented alongside the average annualised expected returns, in both geometric and arithmetic terms, as well as volatility, Sharpe ratio, and the probability of a negative geometric return at horizon (P(Return < 0) over 10 years). Our allocation framework for private and alternative assets includes a liquidity budget based on illiquidity scores assigned to all assets (more details can be found in Strategic Integration of Private Assets in Multi-Asset Allocations). We considered both a low and a moderate tilt toward less liquid exposures for USD and EUR investors. The low-risk appetite scenario corresponds to an investment universe without private or alternative assets. Compared to last year, we increased the illiquidity score for private debt to reflect its lower marketability and potential disruption which could materialise in the short to medium-term. CM lines and portfolio optimisations are based on fixed income assets, hedge funds, and private debt hedged, equities, gold and other private assets unhedged.
CASM model
We believe capital markets are not always efficient and they deviate from long-term fair values. We follow a disciplined approach to asset allocation that blends quantitative input and qualitative assessment to identify superior asset allocations. Our multivariate approach to modelling assets and liabilities focuses on the complex relationships between risk factors over multiple investment horizons. Simulating asset prices that are consistent with our risk factor models allows us to capture complex market dynamics. Macro and financial risk factors explain asset returns and the correlations between assets.
Cascade Asset Simulation Model (CASM) is a platform developed by Amundi in collaboration with Cambridge University*. CASM combines our short-term financial and economic outlooks. It incorporates medium-term dynamics into long-term dynamic trends, to simulate forward-looking returns for different asset classes over multiple horizons. CASM generates asset price scenarios and underlying economic and financial factors that determine Amundi’s expected returns. It is a valuable tool for strategic asset allocation and asset-liability management analysis. The flexibility of CASM allows us to provide highly customised solutions to our clients.
We estimate model parameters semi-annually to incorporate new market data and our short-term outlook. The process for calibrating models that reflect our view of economic and financial market trends is a close collaborative process between many teams at Amundi. We reach a consensus for the short-to-medium-term outlooks for macro and financial variables for each region under consideration (US, Eurozone (core, semi-core and periphery), UK, Japan, Pacific ex Japan, China, India, EM area). The models are calibrated to be consistent with these outlooks and long-run estimates. At each step in the process, results are analysed against stylised facts and checked for consistency. The estimation process for each region progresses from calibrating macro and financial variables to simulating asset prices, where asset prices are driven by the underlying macro and financial variables.
Price returns are generated using a Monte Carlo simulation. Stochastic generation of risk factors and price scenarios allows us to analyse a wide range of possible outcomes and control the uncertainty surrounding these. We can change starting assumptions and see the effect on possible future asset prices. The platform allows us to simulate consistent scenarios across any instrument in a multi-asset portfolio, a feature that is particularly relevant for institutional investors with long time horizons.
The CASM platform covers macro and financial variables for major regions, in particular the US, UK, Eurozone, Japan, Pacific ex Japan, China, India and Emerging Markets as an aggregate. Models are constructed to capture the main drivers of economic variables that affect asset prices. The definition of the building blocks within the cascade structure has been enhanced to incorporate climate policy actions and their implications.
Cascade Asset Simulation Model (CASM) is a platform developed by Amundi used to simulate forward-looking returns and derive expected returns. We distinguish between macro-economic, financial and pricing models as described in the following chart:
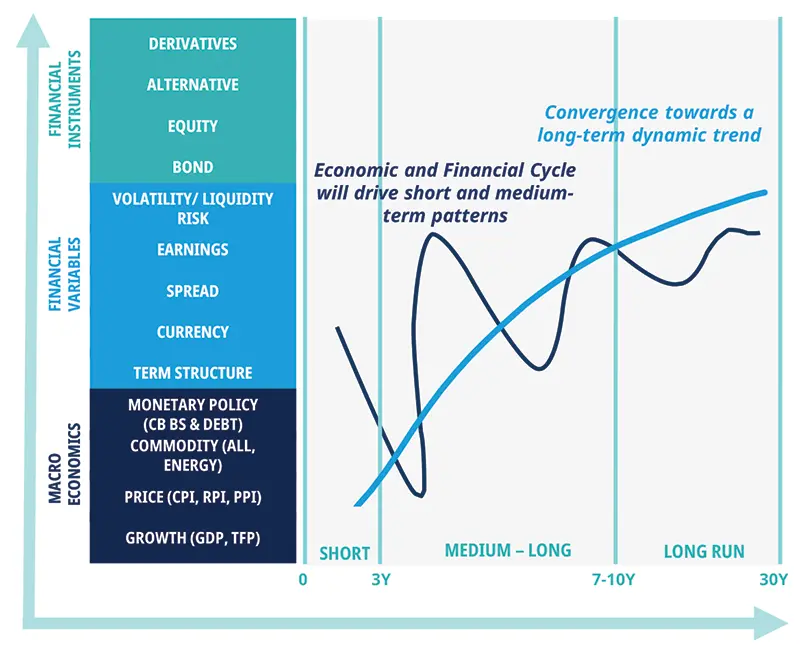
| The architecture of CASM can be described in two dimensions. The first dimension is a “cascade” of models. Asset and liability price models are made up of market risk factor models. Market risk factor models are made up of macroeconomic models. Initially proposed by Wilkie (1984) and further developed by Dempster et al. (2009), this cascade structure is at the root of the platform’s capability to model linear and non-linear relationships between risk factors, asset prices and financial instruments. |
The second dimension is a representation of the future evolution of the aforementioned “cascade” effect. The unique formulation allows us to simulate asset price scenarios that are coherent with the underlying risk factor models. In the short term, CASM blends econometric models and quantitative short-term outlooks from in-house practitioners. In the long term, we assume the market variables are subject to a mean-reverting process, defined formally through structural break analysis and general equilibrium models. The short term evolves into a long-run state through the medium-term dynamic driven by business cycle variables.
Source: Amundi Asset Management – CASM model.
*Dempster, M., Germano, M., Medova, F., Murphy, J., Ryan, D., & Sandrini, F. (2009), Risk Profiling Defined Benefit Pension Schemes. Journal of Portfolio Management, Summer (2009)
A.D. Wilkie. (1984), A stochastic investment model for actuarial use [with discussion]. Transaction of the Faculty of Actuaries, 341-403


Authors