
Summary
Executive summary
The election of President Joe Biden has led to a turn in US government policy. This paper explores income and wealth inequality in the United States and President Biden’s policies aimed at addressing this issue, including his proposal of a corporate tax hike. We assess the likelihood of long-term success and, finally, the potential inflationary consequences. We believe the Fed’s accommodative policies may have had unintended consequences of increasing wealth inequality, especially the top 1%. The rise in income and wealth inequality is not as obvious as it seems, but quite nuanced.
Major crises such as war, disease or poor economic mismanagement often lead to a seismic change in government policy. In the 1970s, stagflation led to Reaganonomics, where President Ronald Reagan shrank the role of government. He pursued policies that led to a period of deregulation, low taxes, limited domestic spending and a belief in free markets. Neoliberalism then took hold and became the main pillar of US economic policymaking that has remained mostly in place until now.
The Covid-19 pandemic has led to strong government activism, drawing parallels with Franklin Delano Roosevelt’s New Deal during the Great Depression and Lyndon Johnson’s Great Society reforms of the 1960s. In the past year alone there has been approximately $5tn in fiscal spending -- potentially only half of the potential stimulus spending -- to help rebuild the US economy and, as Biden promised during the campaign, to rid the nation of income inequality. Biden’s plan to fight inequality also includes the proposal of a hike in corporate taxes, which could help drive inflation up. Even before Biden’s actual and proposed policies, inflationary pressures were already building, driven by rising commodity prices, robust economic growth and high levels of fiscal and monetary stimulus. In the current environment of mostly sticky demand, any supply shock or tax hike could be passed on to consumers, especially for lower-price items and products purchased by low-income households.
Such policies would have profound investment implications. In the US fixed income space, higher inflation pressures are compounded by supply chain and transport disruptions, which show up in rising prices across the economy, including consumer goods, used cars, housing materials, commodities and wages. We believe it is prudent to position for stable spreads, higher rates and a steeper yield curve, as the effects of the transformative policy shift takes hold in the United States.
In addition, a corporate tax hike would impact adversely on sectors such as information technology and healthcare, as these companies tend to have large foreign profits and a relatively low effective tax rate on them. Sectors such as materials and energy would be less affected. More generally, high-yield (HY) issuers would be less affected than investment-grade (IG) ones, as the latter -- especially large multinational corporations -- have been among the main beneficiaries of past corporate tax reforms.
On US equities, Biden’s policy proposals related to income inequality could push inflation higher, accelerating the rotation already underway towards value stocks. Higher taxes are a small negative for US equities, but their potential fallout is weaker than the impact inflation would have on bonds and long-duration (highly priced) stocks.
Rising income and wealth inequality
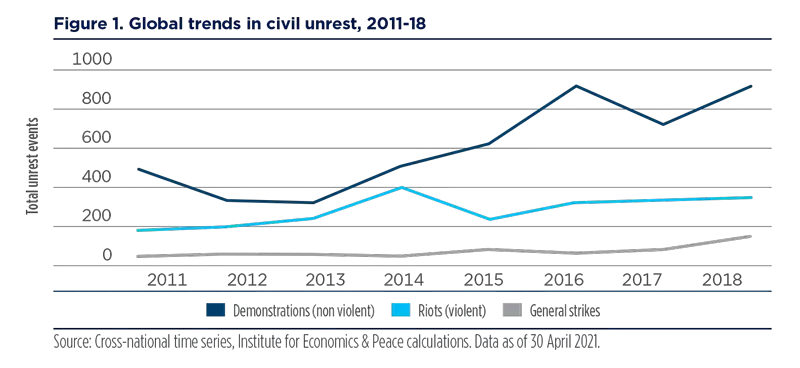
Income inequality has been a growing divide in the United States for decades, and is widely considered to be a factor behind the riots that hit the country during the spring and summer of 2020. Such as in the United States and the Yellow Vests protests in France, riots (violent demonstrations or clashes of more than 100 citizens involving the use of physical force) around the world have increased 282% in the last decade, according to the Global Peace Index. Specifically in the United States, it is hard to refute the trend of growing income and wealth inequality, which was amplified by the Covid-19 crisis.
Over the past 50 years, the highest-earning 20% of US households steadily brought in a larger share of the country’s total income, according to Pew Research. In 2018, households in the top fifth of earners -- with incomes of $130,001 or more -- represented 52% of all US income, more than the lower four-fifths combined. Our analysis of the distribution of household wealth in the United States reveals that the top ten percentile has seen its share of total wealth rise from 60.8% in 1989 to 69.3% in Q3 2020, while the bottom 50% has seen its share decline from 3.7% to just 2.0% over the same period.
Over the past 50 years, the highest-earning 20% of US households steadily brought in a larger share of the country’s total income.

Since the Great Financial Crisis (GFC), we have broadly seen a stability in wealth distribution among the middle class. However, the top 1% continued to see a steady rise (see figure 2). The Fed’s highly accommodative mix of zero interest rate policy, QE, and forward guidance brought about very easy financial conditions that did not lead to robust credit growth but instead boosted asset prices. Inadvertently, the Fed may have been culpable to the rising wealth inequity among the top 1%.
The Gini coefficient is another indicator which measures income inequality, and the United States has among the worst Gini coefficients in the world. The coefficient is a number between 0 and 1, where 0 means income is equally distributed, while 1 signals maximum inequity. Among the 34 OECD countries, the United States ranks 29th, with a Gini coefficient of 0.486, according to OECD analysis.
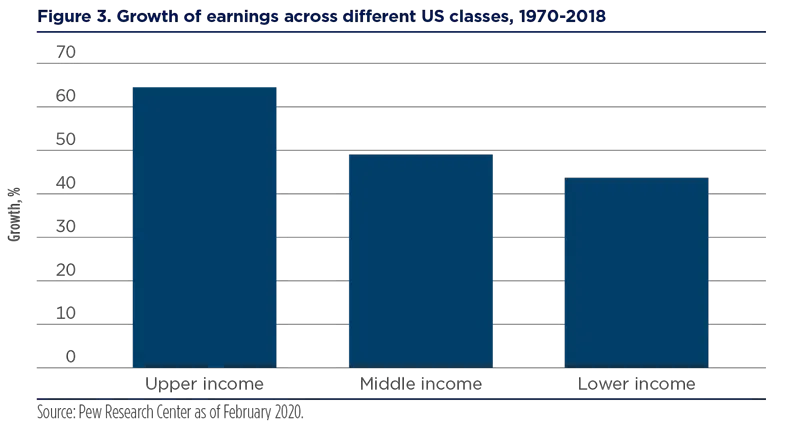
The growing headwinds to moving up the income ladder are highlighted by an academic paper by Michael Carr and Emily Wiemers. Their study identified a worsening trend from the 1980s to the 2000s: middle-class workers remained in the middle class or lower class during the span of their career, and lower-class workers had little likelihood of moving up into the middle- or upper-income class. Earnings growth is demonstrably faster for upper income earners compared with lower- and middle-income earners. Our analysis of Pew Research data suggests upper income earnings surged 64.5% from 1970 to 2018, while middle and lower incomes gained 49.1% and 43.5%, respectively.
An academic study identified a worsening trend from the 1980s to the 2000s: middle-class workers remained in the middle class or lower class during the span of their career, and lower-class workers had little likelihood of moving up into the middle- or upper-income class.
Tackling inequality: policies to stimulate growth and income redistribution
President Biden is taking a two-pronged approach to narrowing the income divide: drive growth and redistribute income. To support growth, Biden leveraged the Democrat’s slim majority to pass The American Rescue Plan (ARP) in March. The $1.9tn stimulus plan is intended to supercharge growth to help facilitate a broad-based recovery in the labour market, while continuing to tackle the pandemic. In addition, Biden will attempt to address income redistribution using two powerful tools to fight the widening income inequalities, which are: unabated government aid and an overhaul of the tax code.
Stimulate growth
During the 2020 campaign, the President laid out a plan called Build Back Better -- a string of federal investments which could cost more than $3tn in areas ranging from infrastructure and climate change, to childcare, healthcare and education -- to be funded partially by higher taxes on the very wealthy and on corporations. Biden’s agenda goes beyond alleviating economic and financial suffering caused by the pandemic and aims to address broader structural issues of income inequality. Here are the main points of this agenda:
- Compensation: Hike the minimum wage to $15 per hour. He would also end the tipped minimum wage -- a low minimum wage allowed for workers who earn tips -- and sub-minimum wage for people with disabilities. Opponents argue that the hike could lead to 1.3 million jobs lost, citing data from the non-partisan Congressional Budget Office (CBO).
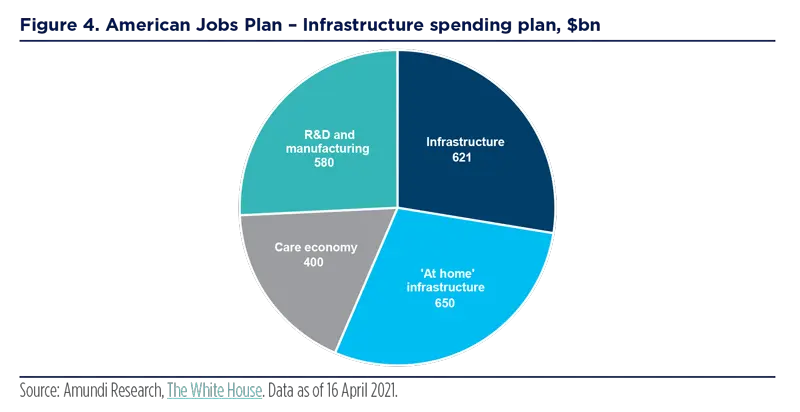
- Infrastructure: Biden’s campaign agenda highlighted a $2tn accelerated investment (see box at the end) to create jobs to build a modern and sustainable infrastructure in black and brown communities. The infrastructure bill includes traditional infrastructure projects such as roads, bridges, clean water and broadband access, as well as clean energy infrastructure, including clean grid and power transmission, clean cars and fuels, green energy incentives, plus a number of non-traditional infrastructure projects, such as schools, childcare, housing, hospitals and postal facilities. Since becoming President, the price tag of Biden’s infrastructure bill has ballooned as high as $4tn with the inclusion of tax incentives to improve energy efficiencies in buildings and credits to help families afford childcare. There is also some discussion of extending the temporary income tax cuts for individuals and families that were implemented during the Trump administration, and which are set to expire in 2025, as a way to help fight poverty. Overall, President Biden is targeting 40% of the overall benefits at minority communities.
During the campaign, the President laid out a plan called ‘Build Back Better’ -- a string of federal investments which could cost more than $3tn in areas ranging from infrastructure and climate change, to childcare, healthcare, and education -- to be funded partially by higher taxes on the very wealthy and on corporations.
- Housing: Biden signed an executive order directing the Department of Housing and Urban Development to examine Trump’s regulatory actions that undermined fair housing policies and laws. During the campaign, Biden proposed creating a new refundable and advanceable tax credit up to $15,000 to help families buy their first home.
- Small businesses: During the campaign, Biden called for the allocation of $10bn from the new Small Business Opportunity Fund to state and local venture capital programmes. Based on past government investments, he believes that this could spur $50bn in new equity investment to empower small business creation and expansion in economically disadvantaged areas, particularly for black, latino, Asian-American, Pacific islander and native American-owned businesses.
- Education opportunities: In addition to proposing student debt forgiveness, Biden also advocates making public colleges and universities tuition-free for all families with incomes below $125,000. He also wants free tuition at two-year community colleges.
- Promote unionisation: Looking to pass the Protecting the Right to Organize (PRO) Act that gives public service and federal government workers the right to unionise to strengthen their bargaining rights. He has committed to using union workers in the infrastructure buildout.
Income redistribution
The $1.9tn American Rescue Plan signed into law by President Biden in March includes several provisions aimed at income transfers:
- An expanded Child Tax Credit (CTC) for low-income earners;
- An expanded Earned Income Tax Credit (EITC) for workers without children; and
- An expansion of the Child and Dependent Care Tax Credit.
These programmes represent a significant increase in household income for lower income earners starting as soon as July 2021. For example, under the new child tax credit law, single earners with annual incomes up to $75,000 and married couples filing jointly with incomes up to $150,000, could begin receiving up to $600 a month per child under 6 and $500 per child under 18 as early as July, according to projections from the House Ways and Means Committee. The expanded credit will be available to millions of families who did not qualify before.
In 2019, the median household income was $5,725 per month, according to US Census data, which means a payment of $550 would increase a family’s income by 9.6%. The 2021 American Recovery Plan (ARP) will raise the EITC. Low paid working adults without children will also receive a nice boost to income. According to the Center on Budget and Policy Priorities (CBPP), ARP will raise the maximum EITC for ‘childless workers’ from about $540 to approximately $1,500, raise the income cap for them to qualify from about $16,000 to at least $21,000, and expand the age range of those eligible to include younger adults aged 19-24 who are not full-time students and those aged 65 and over. The CBPP projects these programmes will provide income support to over 17 million Americans. Two studies indicate that the CTC and the EITC should lead to a historic reduction in child poverty. A Columbia University study from the Center on Poverty and Social Policy found that those measures would almost halve child poverty, from 14.7% in December 2020 to a projected 7.8% in 2022.
The $1.9tn American Rescue Plan signed into law by President Biden in March includes several provisions aimed at income transfers; these programmes represent a significant increase in household income for lower income earners starting as soon as July 2021.
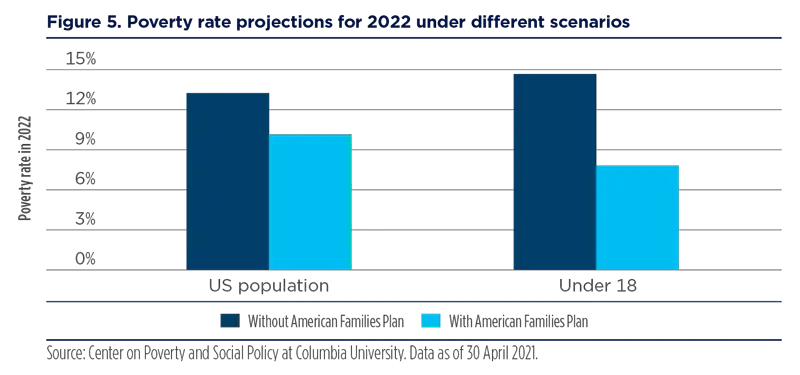
The Center on Poverty and Social Policy estimates that the CTC and EITC would reduce the number of children in poverty by more than 47% and lift 5.2 million children above half the poverty line, referred to as deep poverty.
Biden proposal to overhaul the tax code is centered around the following points:
- Raise the top personal income tax rate back to 39.6% from 37%;
- Raise the top corporate income tax from 21% to 28%;
- Tax capital gains and dividends at ordinary rates for those with annual incomes over $1 million;
- Tax profits earned from foreign subsidiaries of US firms at 21%;
- Impose a 15% minimum tax on book income of large companies (at least $100 million annual net income); and
- Apply social security payroll tax for those earning over $400,000 a year.
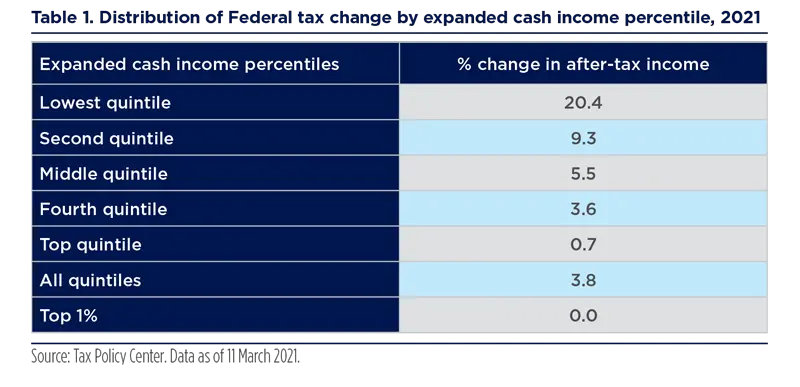
The Biden fiscal plan is aimed at reducing meaningfully income inequality for low-to middle-income households. According to the Tax Policy Center (TPC) analysis of the 2021 American Rescue Plan, a household in the lowest quintile would receive an average tax cut of $2,800 this year, boosting their after-tax income by 20.4% (see table 1). The after-tax income gains for the second and middle quintile is 9.3% and 5.5%, respectively. There are no gains in income for the top five percentiles.
A household in the lowest quintile would receive an average tax cut of $2,800 this year, boosting their after-tax income by 20.4%.
We think there may be an incremental narrowing in income inequality if the Biden tax agenda is implemented mostly in its entirety in 2022. According to the Tax Foundation, taxpayers in the top 1% would see their after-tax incomes decline by 11.3% due to an expected hike in the upper income tax bracket (see figure 6). The top 5% would see a 1.3% reduction in after-tax incomes. However, taxpayers in the lower income quintiles would see a sizeable jump in after-tax incomes, with the lowest quintile seeing a 10.8% boost, while the second quintile sees a 3.6% rise.

Market implications: higher inflation pressures
The Biden ‘going big’ approach is having its intended goal, as the outlook for the US economy is exceptionally buoyant. The markets have not fully priced in the infrastructure plan, so there remains upside risks to growth. The passage of the $1.9tn American Rescue Plan alone has led to a sharp jump in 2021 consensus US GDP forecasts from 4.1% in February to 6.2% in April, and the expected forecast in the unemployment rate by year-end has dropped from 6.2% in Q4 2020 to 4.8%, based on Bloomberg consensus of economists. However, the unintended consequences from the robust growth outlook is an overheating economy and a surge in inflation.
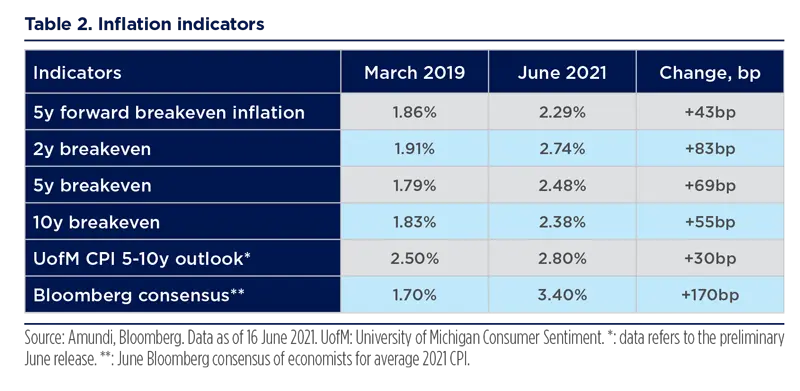
Leading inflation indicators have been on an upward trend for the past two years. We attribute part of that rise to the change in the Fed’s inflation targeting regime, along with Biden’s proposed policies to stimulate the economy and alleviate income inequality, based on our matrix of inflation leading indicators (see table 2). Market measures of inflation have risen sharply since March 2019. For instance, the five-year breakeven rate -- that is the difference between yields of inflation-protected securities and nominal debt of the same maturity -- has climbed from 1.50% in September 2020, when markets were expecting a narrow Trump win, to 2.48% as of 16 June 2021, as markets expect much easier fiscal policy (passage of Biden’s $1.9tn fiscal stimulus deal and expectations of an infrastructure deal). There have also been sharp gains in the two-, five-, and ten-year breakevens. The Fed’s market measure of inflation expectations has surged from 1.86% in March 2019 to 2.29% as of 16 June 2021. The University of Michigan’s consumer measure of inflation expectations has been more stubborn, but in line with Fed expectations, which remain towards cycle highs at 2.8% as of June 2021.
The unintended consequences from the robust growth outlook is an overheating economy and a surge in inflation.
Even before the prospect of a hike in corporate taxes, inflationary pressures were already building, driven by rising commodity prices, robust economic growth and high levels of fiscal and monetary stimulus. Under this potentially frothy backdrop, the proposed hike in corporate taxes from 21% to either 25% or 28% -- still lower than the 35% rate that existed before the 2017 tax law -- to fund the infrastructure plan could have inflationary consequences.
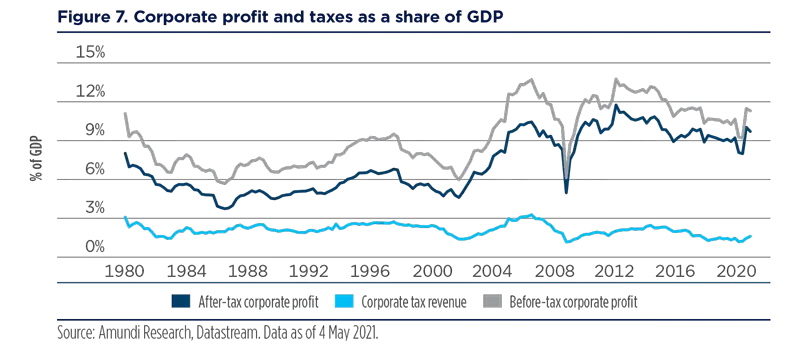
Biden’s proposed corporate tax hike marks a significant shift from his predecessor’s policies, after years during which the revenues from corporate taxation shrunk while corporate profits soared. In fact, corporate tax revenue as a share of GDP has fallen steadily since 1980, although profits have increased, due to incentives created by the tax code for successful multinationals to shift profits overseas to avoid US tax burdens.
Who bears the brunt from a corporate tax hike: the corporation or the consumer? It depends. If supply is elastic or demand is inelastic, corporations will pass on higher prices to the consumer. However, if demand is elastic or supply is inelastic, then corporations will not be able to pass on higher prices and their margins will be squeezed. We believe the current environment favours inelastic demand, where supply shocks will allow corporations to pass on the higher tax to consumers. As a result, a corporate tax hike could make corporations less reluctant to pass on higher prices. A paper by S. Baker, S. Sun, and C. Yannelis, “Corporate Taxes and Retail Prices” finds significant effects of corporate taxes on prices where a 1% hike in the corporate tax rate leads to a net of tax elasticity of 0.17. The paper concludes that the effects are larger for lower-price items and products purchased by low-income households and weaker for high-leverage firms. Therefore, a 4-7% hike in the corporate tax rate could potentially see retail prices rise by 0.7-1.2%, respectively.
We believe the current environment favours inelastic demand, where supply shocks will allow corporations to pass on the higher tax to consumers. As a result, a corporate tax hike could make corporations less reluctant to pass on higher prices.
Investment implications
The Biden administration is implementing fiscal policy that will stimulate growth and potentially reduce income inequality. The administration’s ‘go big’ initiatives represent a substantial policy shift from the decades-long Regan revolution to one more akin to former presidents Franklin Roosevelt and Lyndon Johnson. Credit spreads in US fixed income markets have responded favourably, reaching post-GFC lows in corporate bonds, agencies, securitised credit and municipals; we believe that non-agency residential securitisations stand out as relatively attractive.
We believe it is prudent to position for stable spreads, higher rates and a steeper yield curve, as the effects of the transformative policy shift takes hold in the United States.
US treasury yields remain range bound. While fixed income volatility has picked up since the start of the year, the MOVE index rests around its five-year average. The market appears confident in the Fed’s resolve to anchor interest rates and curb inflation. Furthermore, massive levels of stimulus-driven liquidity are supportive of prices. Corporate and consumer cash and excess savings are staggering: S&P 500 companies are carrying $2tn on their balance sheets, while US consumers have piled up $2.6tn in savings. Should the force of this liquidity be unleashed on investment and spending, rates and inflation could surprise to the upside. Such inflationary pressures are exaggerated by supply chain and transport disruptions, and are appearing in prices across the economy, including consumer goods, used cars, housing materials, commodities and wages. The question is whether the inflationary pressures are sustainable or transient. We believe it is prudent to position for stable spreads, higher rates and a steeper yield curve, as the effects of the transformative policy shift takes hold in the United States.
In addition, a corporate tax hike would unfold its impact on the US fixed income space as well. Such reform would impact adversely mainly on sectors such as information technology and healthcare, as these companies tend to have large foreign profits and a relatively low effective tax rate on them. Sectors such as materials and energy would be less affected.
More generally, HY issuers would be less affected than IG ones, as the latter -- especially large multinational corporations -- have been among the main beneficiaries of past corporate tax reforms.
Biden’s policy proposals related to income inequality, by pushing inflation higher, could accelerate the rotation already underway towards value stocks.

On equities, Biden’s policy proposals related to income inequality, by pushing inflation higher, is likely to accelerate the rotation already underway in favour of value stocks. Higher taxes are a small negative for US equities, but their potential fallout is weaker than what inflation would do to long-duration (highly priced) stocks.
|
Investment implications US investment growth has been buoyant, with capital expenditures (capex) hitting an all-time high in Q1 2021. There has been an ongoing structural change in the composition of capex from the ‘old economy’, such as plant and equipment, to the ‘new economy’ like software and research & development. US long-term growth could receive an added boost from a strong investment policy, both public and private. This is an element in the reduction of social inequalities. Biden’s message is clear: investment is a top priority and should maintain the momentum. The Biden's administration aims to increase public spending via a $2tn plan and to improve economic efficiency through tax reforms. In addition, the change in the Fed’s policy framework is also providing strong support to the US economy. The low interest rate environment has favoured a strong investment rebound for US corporates:
In conclusion, the key priority put by President Biden on investment is, on one side, supportive for economic growth and, on the other, would make corporate America more resilient. |
US long-term growth could be boosted by a strong investment policy -- both public and private -- and the reduction of social inequalities.
Definitions
- Basis points: One basis point is a unit of measure equal to one one-hundredth of one percentage point (0.01%).
- Breakeven inflation: Breakeven inflation is the difference between the nominal yield on a fixed-rate investment and the real yield on an inflation-linked investment of similar maturity and credit quality.
- Curve steepening: A steepening yield curve may be a result of long-term interest rates rising more than short-term interest rates or short-term rates dropping more than long-term rates.
- Duration: A measure of the sensitivity of the price (the value of principal) of a fixed income investment to a change in interest rates, expressed as a number of years.
- Inflation swap: An inflation swap is an over-the-counter and exchange-traded derivative that is used to transfer inflation risk from one counterparty to another.
- MOVE: MOVE Index is the Merrill Lynch Option Volatility Estimate for the US Treasury.
- Value style: It refers to purchasing stocks at relatively low prices, as indicated by low price-to- earnings, price-to-book, and price-to-sales ratios, and high dividend yields. Sectors with dominance of value style: energy, financials, telecom, utilities, real estate.
- Volatility: A statistical measure of the dispersion of returns for a given security or market index. Usually, the higher the volatility, the riskier the security/market.


Authors