
Summary
- Recent geopolitical events and macroeconomic progresses are rising uncertainty on the global outlook and led to some adjustments on the short-term trajectory within our simulation horizon.
- This quarter starts with higher valuation and more uncertainty across the asset universe. We have slightly revised our short-term outlook assumptions factoring in a mild recession in the US in 1H2024 and a faster transition of China towards a slower growth regime.
- Our long-term model assumptions are characterised by a disorderly energy transition that integrates secular trends and uncertainty (see our annual publication “A rocky net zero pathway”), both affecting price patterns and volatility. Interest rates will normalise in the long-run on upward sloping and curves. Equity returns will be characterised by lower earnings growth and lower valuation.
- From a strategic standpoint, high-quality fixed income assets (government bonds and high-grade credit) can deliver attractive returns. This quarter we have reinforced our expectations over a 10-year horizon because of improved starting valuations. Equity expectations were revised upward across the board, especially on developed markets (excluding Japan).
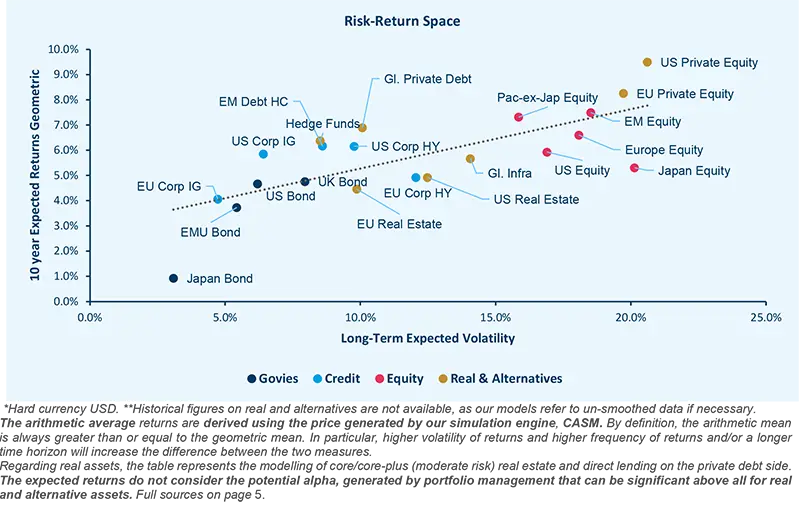
- In the real and alternative assets space, Global Private Debt and Hedge Funds confirm their attractive risk/return trade-off, even when compared to asset classes with similar levels of risk (such as HY Credit and Real Estate).
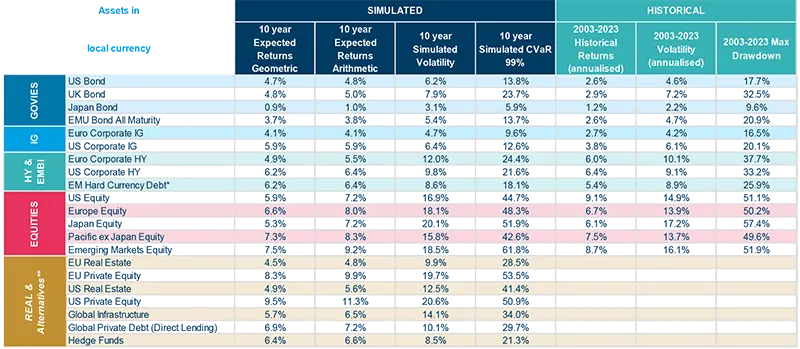
In the table below, we present our simulated forward-looking statistics for a 10-year horizon (expected returns, volatility, and CVaR) compared with historical statistics calculated using a 20-year sample. Here, CVaR and max drawdowns represent the expected and historical shortfalls, respectively. We also provide arithmetic average returns, which are used for portfolio optimisation purposes.
Asset Class Returns Forecasts
Expected returns are calculated using Amundi central scenario assumptions, which include the climate transition. For more detailed information, see: https://research-center.amundi.com/article/rocky-net-zero-pathway.
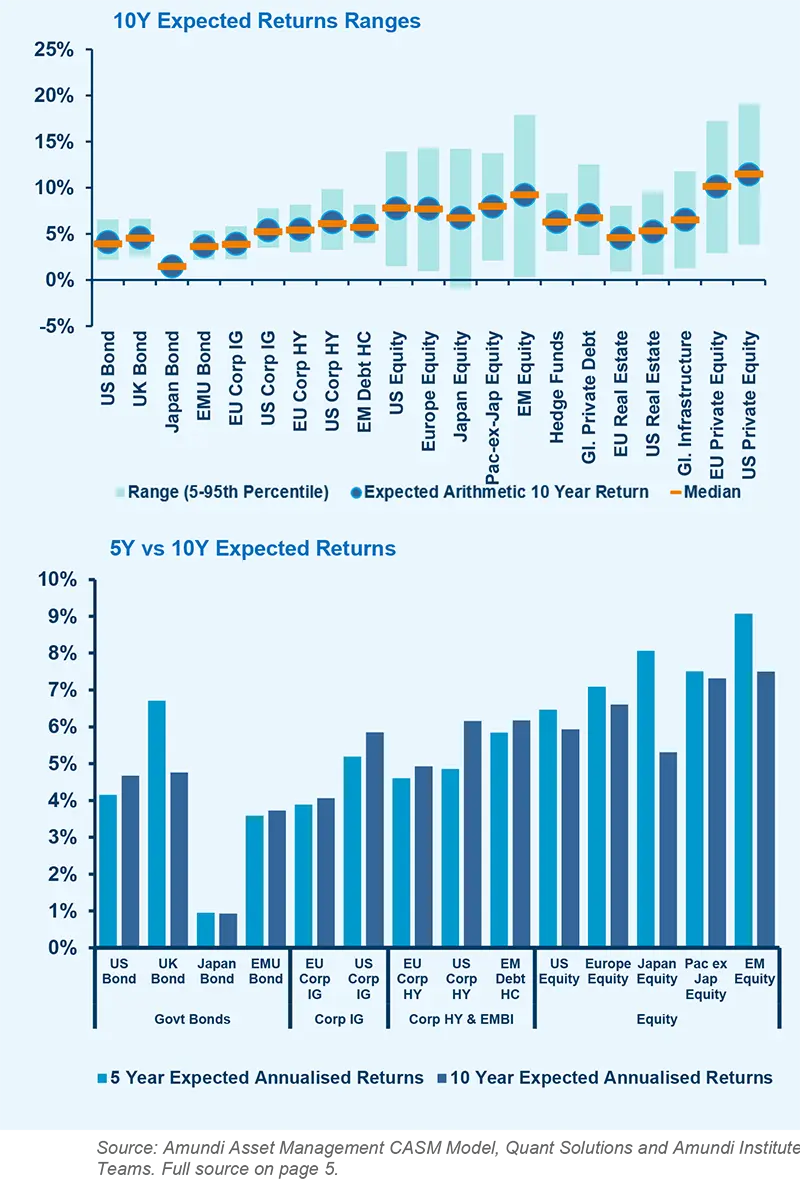
In the chart we present the range of arithmetic expected returns, where we have excluded tail scenarios (worst and best 5%).
Our expectations for government bond returns are still attractive, despite the dispersion around the central scenario. In particular, we emphasise that UK bond expected returns dominate the sovereign bond universe (investors should keep in mind the duration mismatch), and Japanese bonds continue to lag behind their peers.
Credit return forecasts for high-grade assets are almost in line with government bonds. Lowquality assets are expected to marginally outperform higher quality assets, but not from a risk-adjusted return point of view as they could be associated with a larger dispersion due to greater intrinsic volatility and default loss assumptions.
On the equity side, we confirm moderate 10- year expected returns to be between 5% and 7.5%. However, based on our simulations we cannot exclude the possibility of negative returns: there is a 5% chance for equity returns to be below zero over a 10-year horizon. Our assumptions on equity fundamentals have been slightly revised upward as a consequence of the developing macroeconomic backdrop and marginally improved starting valuations.
Equity-like private assets are expected to provide investors with returns close to double digit. Real Estate expectations are in line with high quality credit, although the dispersion around the central scenario is materially larger due to the illiquidity and complexities of this asset. Global Private Debt reveals a competitive expected risk-adjusted return, making this asset a convincing alternative to credit-like instruments.
Compared to our latest quarterly update, our 5-year returns for fixed income are close to the 10-year returns. For the UK, we expect higher 5-year expectations, supported by significant capital gains linked to the high duration and forecasts for yield mitigation. We still expect equity to provide higher returns, ranging between 6.5% and 9% over 5-years, even if the gap is scaling down.
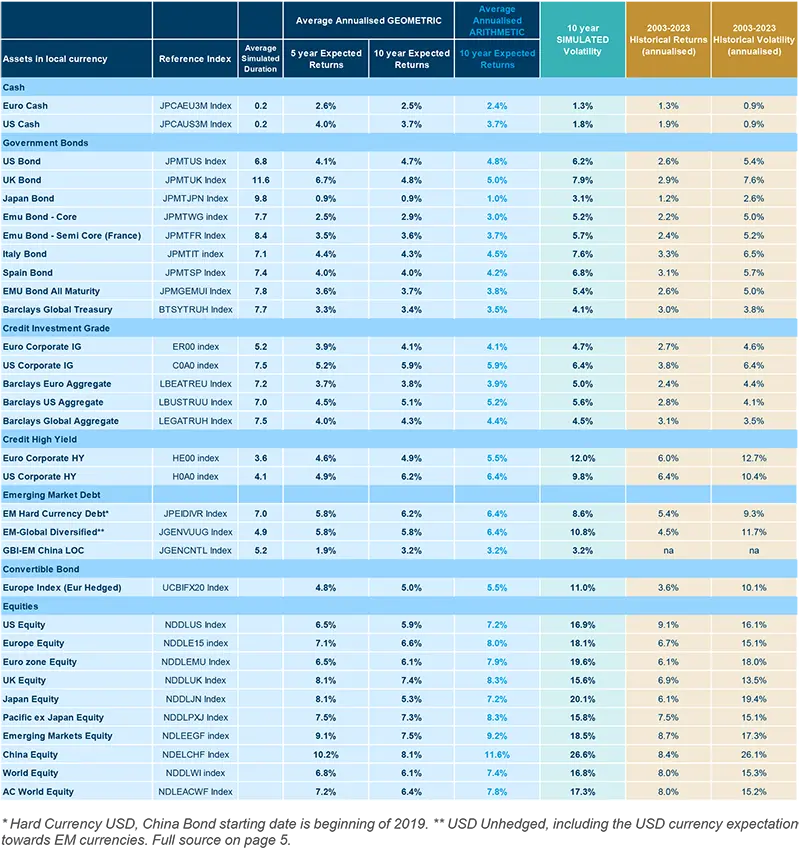
In the following table, we present our annualised return forecasts across different asset classes, calculated as the average of simulated returns over different forward-looking horizons (five- and ten-years). We also report historical figures for annualised returns and volatility calculated over the last 20 years, a sample that includes the two big crises (GFC and Covid-19).
Cascade Asset Simulation Model (CASM)
This medium- and long-term return forecast report is intended to provide some guidance for investor expectations. The time horizon under consideration is 10 years, a timeframe deemed to be appropriate and during which long-term trend factors and issues can reasonably be expected to play out and, therefore, market returns should accurately reflect this information.
Cascade Asset Simulation Model (CASM) is a platform developed by Amundi in collaboration with Cambridge University. CASM combines our short-term financial and economic outlooks. It incorporates medium-term dynamics into a long-term equilibrium, to simulate forward-looking returns for different asset classes over multiple horizons.
CASM generates asset price scenarios and underlying economic and financial factors that determine Amundi’s expected returns. It is a valuable tool for strategic asset allocation and asset-liability management analysis. We estimate model parameters quarterly to incorporate new market data and our short-term outlook. The process for calibrating models that reflect our view of economic and financial market trends is a collaborative process between many teams at Amundi. We reach a consensus for the short-tomedium term outlooks for macro and financial variables for each region under consideration (US, Eurozone core and periphery, UK, Japan, China). The models are calibrated to be consistent with these outlooks and long-run estimates. At each step in the process, results are analyzed against stylized facts and checked for consistency. Price returns are generated using Monte Carlo simulation. Stochastic generation of risk factors and price scenarios allows us to analyze a wide range of possible outcomes and control the uncertainty surrounding these. We can change starting assumptions and see the effect on possible future asset prices. The CASM platform covers macro and financial variables for major regions, in particular the US, UK, Eurozone, Japan, China and Emerging Markets as an aggregate.
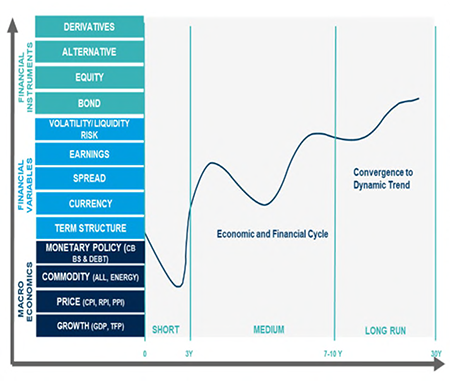
The architecture of CASM can be described in two dimensions. The first dimension is a “cascade” of models. Asset and liability price models are composed of market risk factor models. Market risk factor models are made up of macroeconomic models. Initially proposed by Wilkie (1984) and further developed by Dempster et al. (2009), this cascade structure is at the root of the platform’s capability to model linear and non-linear relationships between risk factors, asset prices and financial instruments. The second dimension is a representation of the future evolution of the aforementioned “cascade” effect. The unique formulation allows us to simulate asset price scenarios that are coherent with the underlying risk factor models. In the short term, CASM blends econometric models and quantitative short-term outlooks from in-house practitioners. In the long term, we assume the market variables are subject to dynamic long-term levels. The short term evolves into a long-run state through the medium-term dynamic driven by business cycle variables.
Sources
Amundi Asset Management CASM Model, Amundi Asset Management Quant Solutions and Amundi Investment Institute Teams, Bloomberg. Finalised on 27 October 2023. Macro figures as of latest release. Starting date is 29 September 2023. Equity returns are based on MSCI indices. Reference duration are average simulated figures.. Returns on credit asset are comprehensive of default losses. If not otherwise specified, expected returns are geometric annualized average total returns at the specific horizon. They are expressed in local currency and gross of fees.
Expected returns are calculated on Amundi central scenario assumptions, which include climate transition. Regarding real assets, the table represents the modelling of core/core-plus (moderate risk) real estate and direct lending on the private debt side. The expected returns do not consider the potential alpha, generated by portfolio management that can be significant above all for real and alternative assets. Forecasts for annualised returns are based on estimates and reflect subjective judgments and assumptions. These results were achieved by means of a mathematical formula and do not reflect the effect of unforeseen economic and market factors on decision-making. The forecast returns are not necessarily indicative of future performance, which could differ substantially.


Authors