
We believe capital markets are not always efficient and they deviate from long-term fair values. We follow a disciplined approach to asset allocation that blends quantitative input and qualitative assessment to identify superior asset allocations. Our multivariate approach to modelling assets and liabilities focuses on complex relationships between risk factors over multiple investment horizons. Simulating asset prices that are consistent with our risk factor models allows us to capture complex market dynamics. Macro and financial risk factors explain asset returns and the correlations between assets.
Cascade Asset Simulation Model (CASM) is a platform developed by Amundi in collaboration with Cambridge University*. CASM combines our short-term financial and economic outlooks. It incorporates medium-term dynamics into long-term dynamic trends, to simulate forward-looking returns for different asset classes over multiple horizons. CASM generates asset price scenarios and underlying economic and financial factors that determine Amundi’s expected returns. It is a valuable tool for strategic asset allocation and asset-liability management analysis. The flexibility of CASM allows us to provide highly customised solutions to our clients. We estimate model parameters quarterly to incorporate new market data and our short-term outlook. The process for calibrating models that reflect our view of economic and financial market trends is a close collaborative process between many teams at Amundi. We reach a consensus for the short-to-medium-term outlooks for macro and financial variables for each region under consideration (US, Eurozone (core, semi-core and periphery), UK, Japan, China, India, EM area). The models are calibrated to be consistent with these outlooks and long-run estimates. At each step in the process, results are analysed against stylised facts and checked for consistency. The estimation process for each region progresses from calibrating macro and financial variables to simulating asset prices, where asset prices are driven by the underlying macro and financial variables.
Price returns are generated using a Monte Carlo simulation. Stochastic generation of risk factors and price scenarios allows us to analyse a wide range of possible outcomes and control the uncertainty surrounding these. We can change starting assumptions and see the effect on possible future asset prices. The platform allows us to simulate consistent scenarios across any instrument in a multi-asset portfolio, a feature that is particularly relevant for institutional investors with long time horizons.
The CASM platform covers macro and financial variables for major regions, in particular the US, UK, Eurozone, Japan, China, India and Emerging Markets as an aggregate. Models are constructed to capture the main drivers of economic variables that affect asset prices. The definition of the building blocks within the cascade structure has been enhanced to incorporate the climate policy actions and their implications.
Cascade Asset Simulation Model (CASM) is a platform developed by Amundi used to simulate forward-looking returns and derive expected returns (see a more detailed description at the end). We distinguish between macro-economic, financial and pricing models as described in the following chart:
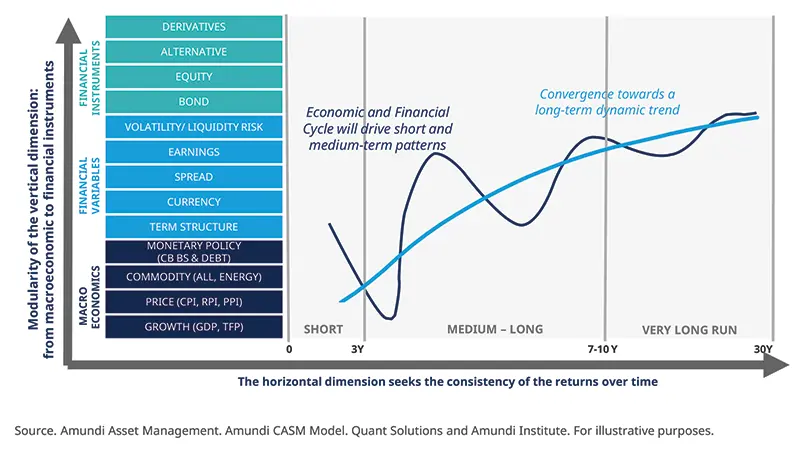
The architecture of CASM can be described in two dimensions. The first dimension is a “cascade” of models. Asset and liability price models are made up of market risk factor models. Market risk factor models are made up of macroeconomic models. Initially proposed by Wilkie (1984) and further developed by Dempster et al. (2009), this cascade structure is at the root of the platform’s capability to model linear and non-linear relationships between risk factors, asset prices and financial instruments. The second dimension is a representation of the future evolution of the aforementioned “cascade” effect. The unique formulation allows us to simulate asset price scenarios that are coherent with the underlying risk factor models. In the short term, CASM blends econometric models and quantitative short-term outlooks from in-house practitioners. In the long term, we assume the market variables are subject to a mean reverting process, defined formally through structural break analysis and general equilibrium models. The short term evolves into a long-run state through the medium-term dynamic driven by business cycle variables.
*A.D. Wilkie. (1984), A stochastic investment model for actuarial use [with discussion]. Transaction of the Faculty of Actuaries, 341-403 Dempster, M., Germano, M., Medova, F., Murphy, J., Ryan, D., & Sandrini, F. (2009), Risk Profiling Defined Benefit Pension Schemes. Journal of Portfolio Management, Summer (2009)
Sources CMA :
Amundi Asset Management CASM Model, Amundi Asset Management Quant Solutions and Amundi Investment Institute Teams. Macro figures as of the last release. Equity returns based on MSCI indices. Reference durations are average figures. Returns on credit assets are comprehensive of default losses. If not otherwise specified, expected returns are geometric annualised average total returns at the specific horizon. EM debt HC, EM-GBI, global infrastructure and hedge funds are in USD, all other indices are in local currency. Returns are nominal and gross of fees, except private and alternative assets which are net of management and admin fees. US direct lending considers leverage on the fund. Real estate refers to all property unlevered real estate. Hedge Funds refer to fund of Hedge funds. The expected returns consider the market beta and the alternative assets risk premium. The alpha return component generated by portfolio management, strategy selection or specific value creation programmes, which can be significant above all for private and alternative assets, is not considered in any form.
The arithmetic average returns are derived using the price generated by our simulation engine. By definition, the arithmetic mean is always greater than or equal to the geometric mean. In particular, the higher volatility of returns and higher frequency of returns and/or a longer time horizon will increase the difference between the two measures. Simulated volatilities are calculated on simulated prices over a 10-year horizon. Simulated volatility for private and alternative assets is derived from unsmoothed return series. Hence, this measure of volatility will be different from the one obtained from realised IRR. Expected returns are calculated using Amundi central scenario assumptions, which include climate transition. Forecast and fair values up to a 3-year horizon are provided by the Amundi Investment Institute Research team (macro, yields, spread and equity). Forecasts for annualised returns are based upon estimates and reflect subjective judgments and assumptions. These results were achieved by means of a mathematical formula and do not reflect the effect of unforeseen economic and market factors on decision-making. The forecast returns are not necessarily indicative of future performance.
Data sources: Bloomberg, Cambridge Associates, Global Financial Data. Edhec Infra, MSCI and MSCI Burgiss, Pitchbook, Preqin.
Indices: Equity indices are MSCI regional indices TR, Credit indices are from BofA Merrill Lynch, Aggregate indices are from Bloomberg Barclays, Govies and EM bonds indices are from JP Morgan.


Author