
Summary
- The effect of the fast-paced Quantitative Tightening (QT) embraced by Developed Market (DM) central banks (CB) is materialising across two fronts: price dynamics and financial stability. All inflation items are indeed trending lower but core measures of price growth show signs of stickiness. This means the price stability battle could remain open. Moreover, multiple rate hikes and reduced liquidity are challenging the banking sector with systemic second-order effects on confidence and financial stability. In fact, the extreme asset price movements registered in March were connected to banking sector turmoil and signs of crippling financial stability.
- The short term is characterised by a weak economic perspective across DM countries, where US developments are mainly driven by banking sector stress and the credit crunch. Central banks, employing a more data-dependent approach, could thus pause their hiking intentions.
- Our assumptions for the long term have not changed materially since last quarter. We still foresee normalised interest rate levels and flatter curves for developed economies due to anaemic real growth compared to the past. The energy transition and geopolitical events remain central for our inflation projections across countries: price growth will remain volatile and above recent historical averages.
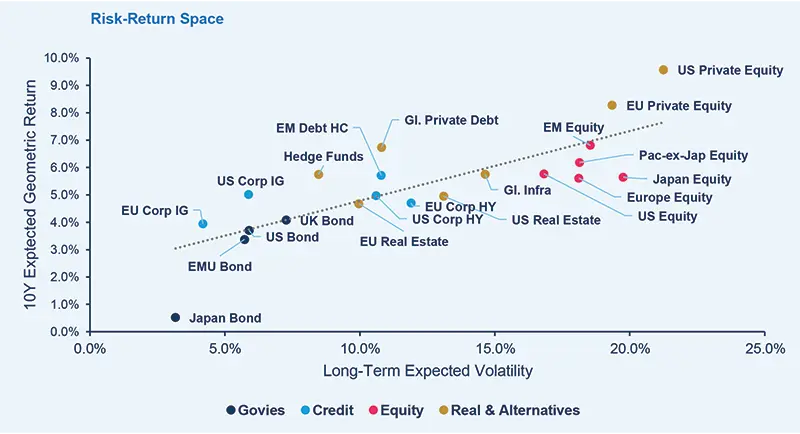
- Long-term expected returns are still attractive for fixed income instruments, even if there is a decline versus last quarter amid lower starting yields. In particular, the risk/return trade-off of high-grade assets looks particularly attractive due to their resiliency in volatile and adverse market contexts. In the equity space, as a consequence of less attractive starting valuations, we only register a marginal reduction in expected returns compared to the previous update. Emerging Markets (EM) equity forecasts still lead the pack, whereas the Eurozone, together with Japanese equity, are laggards.
In the table below, we present our simulated forward-looking statistics over a 10-year horizon (expected returns, volatility and CVaR) compared with historical statistics calculated using a 20-year sample. Here, CVaR and max drawdowns represent the expected and historical shortfalls, respectively. We also provide arithmetic average returns, which are used for portfolio optimisation purposes.
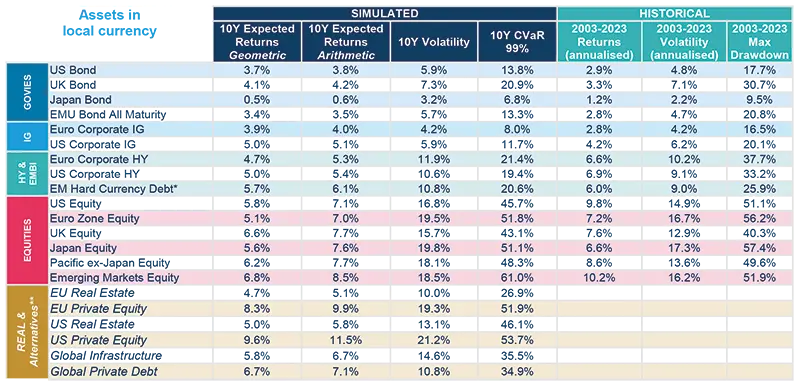
*Hard currency USD, **Historical figures on real and alternatives are not available, as our models refer to un-smoothed data if necessary.
The arithmetic average returns are derived using the price generated by our simulation engine, CASM. By definition, the arithmetic mean is always greater than or equal to the geometric mean. In particular, higher volatility of returns and higher frequency of returns and/or a longer time horizon will increase the difference between the two measures.
Regarding real assets, the table represents the modelling of core/core-plus (moderate risk) real estate and direct lending on the private debt side.
The expected returns do not consider the potential alpha, generated by portfolio management that can be significant above all for real and alternative assets. Full sources on page 4.
Asset Class Return Forecasts
Expected returns are calculated using Amundi central scenario assumptions, which include the climate transition. For more detailed information, see: A rocky net zero pathway.
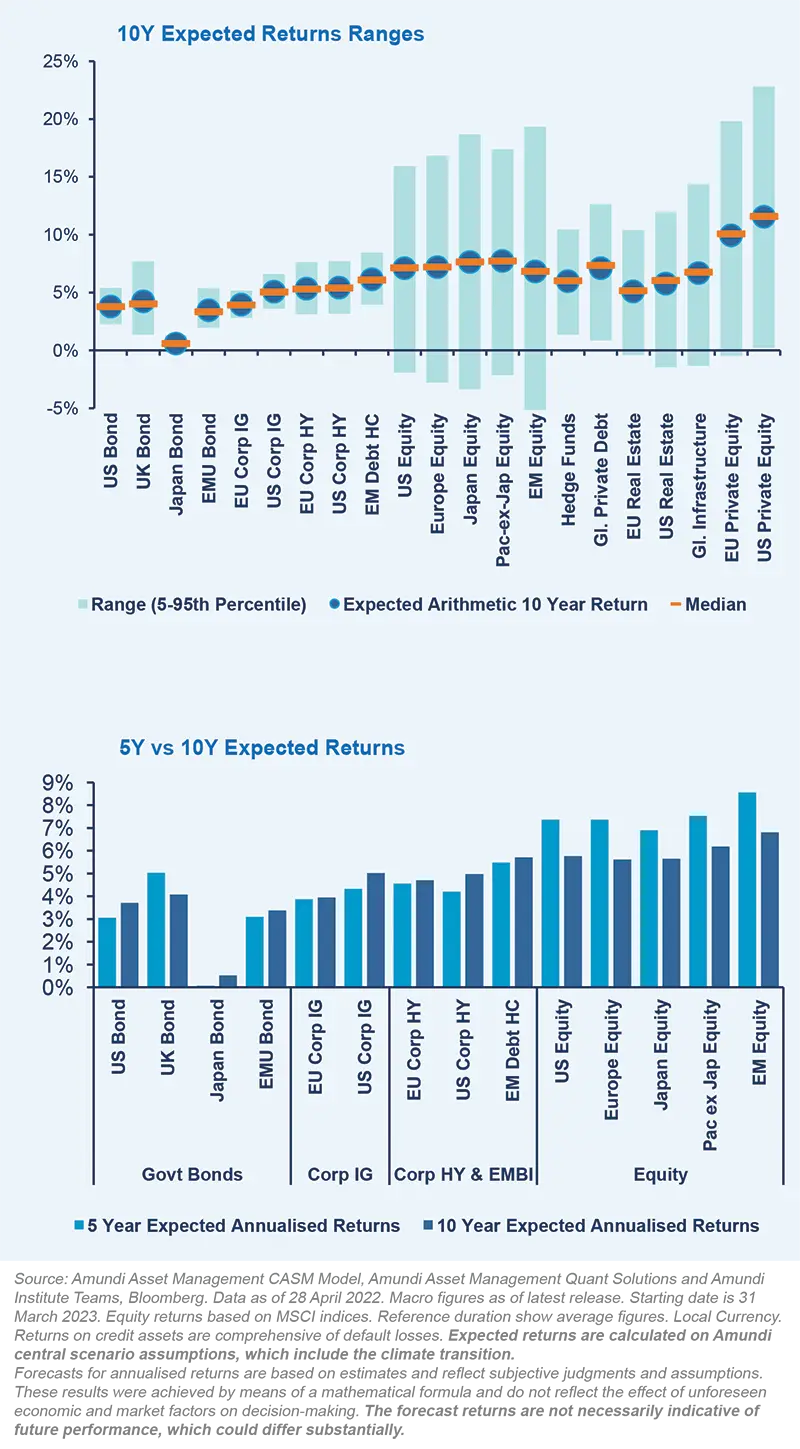
In the chart, we present the range of arithmetic expected returns, where we have excluded tail scenarios.
Government bonds are expected to deliver attractive returns, with the exception of Japanese bonds. The range of possible outcomes is positive for all bonds, UK bonds show the greatest dispersion because of their high duration.
Credit returns are supported by the spread component even if uncertainty for low-quality ranges is enlarged. High Yield credit is also expected to only marginally outperform high-quality assets, with a higher dispersion of returns, due to default losses which may occur.
On the equity side, the upside potential ranges between 15% and 20% across regions. However, we cannot exclude the possibility of negative returns: there is a 5% chance for equity returns to be below zero over a 10-year horizon.
We have registered similar behaviour for equity-like private assets, while hedge funds and private debt reveal a more balanced profile showing expectations ranging significantly but remaining in the positive arena.
Moving to the medium term, government yields have reduced recently as markets expect CBs to halt rate hikes due to financial stability concerns. This manifests itself in our 5-year returns being generally lower than the 10-year ones. Expectations for UK bonds differ as starting yields have not changed significantly.
Credit expectations, particularly for US assets, mimic the pattern described for government bonds.
Equity medium-term returns have reduced amid less attractive starting valuations. Over the long term, equity returns crystallise moderate single-digit expectations.
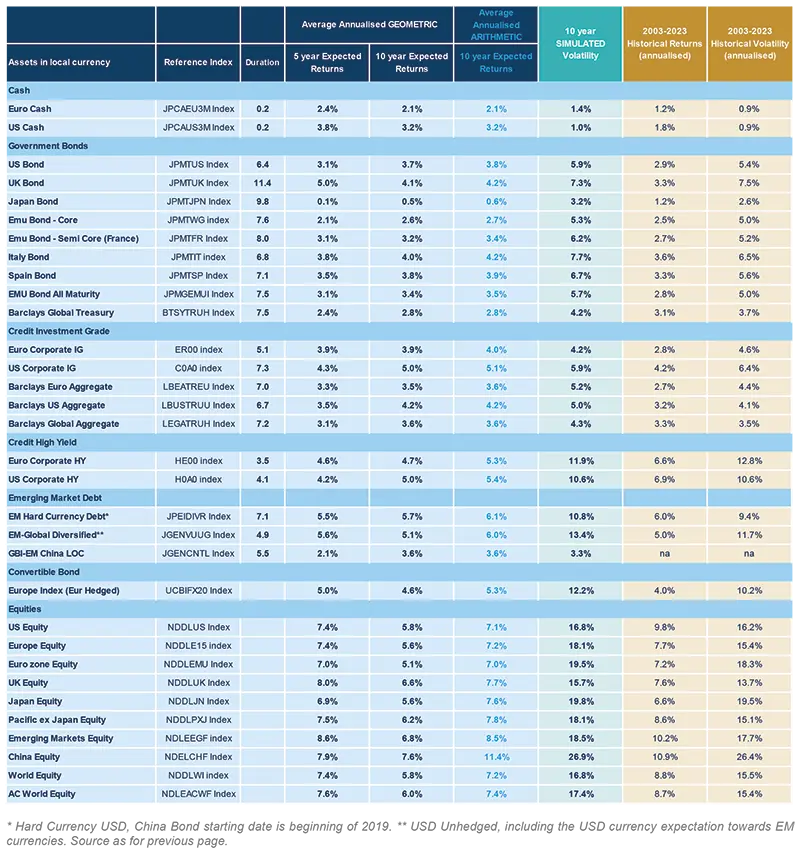
In the following table, we present our annualised return forecasts across different asset classes, calculated as the average of simulated returns over different forward-looking horizons (five- and ten-years). We also report historical figures for annualised returns and volatility calculated over the last 20 years, a sample that includes the two big crises (GFC and Covid-19).
Cascade Asset Simulation Model (CASM)
This medium- and long-term return forecast report is intended to provide some guidance for investor expectations. The time horizon under consideration is 10 years, a timeframe deemed to be appropriate and during which long-term trend factors and issues can reasonably be expected to play out and, therefore, market returns should accurately reflect this information.
Cascade Asset Simulation Model (CASM) is a platform developed by Amundi in collaboration with Cambridge University. CASM combines our short-term financial and economic outlooks. It incorporates medium-term dynamics into a long-term equilibrium, to simulate forward-looking returns for different asset classes over multiple horizons.
CASM generates asset price scenarios and underlying economic and financial factors that determine Amundi’s expected returns. It is a valuable tool for strategic asset allocation and asset-liability management analysis. We estimate model parameters quarterly to incorporate new market data and our short-term outlook. The process for calibrating models that reflect our view of economic and financial market trends is a collaborative process between many teams at Amundi. We reach a consensus for the short-to-medium term outlooks for macro and financial variables for each region under consideration (US, Eurozone (core and periphery), UK, Japan, China). The models are calibrated to be consistent with these outlooks and long-run estimates. At each step in the process, results are analysed against stylised facts and checked for consistency. Price returns are generated using Monte Carlo simulation. Stochastic generation of risk factors and price scenarios allows us to analyse a wide range of possible outcomes and control the uncertainty surrounding these. We can change starting assumptions and see the effect on possible future asset prices. The CASM platform covers macro and financial variables for major regions, in particular the US, UK, Eurozone, Japan, China and Emerging Markets as an aggregate.
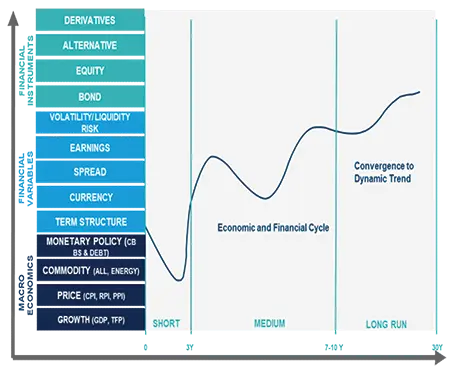
The architecture of CASM can be described in two dimensions. The first dimension is a “cascade” of models. Asset and liability price models are composed of market risk factor models. Market risk factor models are made up of macroeconomic models. Initially proposed by Wilkie (1984) and further developed by Dempster et al. (2009), this cascade structure is at the root of the platform’s capability to model linear and non-linear relationships between risk factors, asset prices and financial instruments. The second dimension is a representation of the future evolution of the aforementioned “cascade” effect.
The unique formulation allows us to simulate asset price scenarios that are coherent with the underlying risk factor models. In the short term, CASM blends econometric models and quantitative short-term outlooks from in-house practitioners. In the long term, we assume the market variables are subject to dynamic long-term levels. The short term evolves into a long-run state through the medium-term dynamic driven by business cycle variables.
Source
Amundi Asset Management CASM Model, Amundi Asset Management Quant Solutions and Amundi Institute Teams, Bloomberg. Data as of 28 April 2023. Macro figures as of latest release. Starting date is 31 March 2023. Figures shown are in local currency.
Returns on credit assets are comprehensive of default losses. Expected returns are calculated on Amundi central scenario assumptions, which include climate transition. Regarding real assets, the table represents the modelling of core/core-plus (moderate risk) real estate and direct lending on the private debt side. The expected returns do not consider the potential alpha, generated by portfolio management that can be significant above all for real and alternative assets. Forecasts for annualised returns are based on estimates and reflect subjective judgments and assumptions. These results were achieved by means of a mathematical formula and do not reflect the effect of unforeseen economic and market factors on decision-making. The forecast returns are not necessarily indicative of future performance, which could differ substantially.


Author