
Summary
Executive summary
We believe Emerging Markets Debt (EMD) should serve as a core allocation in investors’ portfolios. The asset class has traditionally been perceived as a tactical investment opportunity or as an off-benchmark allocation. Instead, we believe a favourable macroeconomic outlook, the growth and transformation of the universe and the diversification benefits it offers means EMD should be a core allocation in investors’ portfolios.
From a macro standpoint, EM countries account for over half of global GDP and they should lead the next recovery as Developed Markets (DM) face a slowdown. These economies have matured over the last three decades and, in recent years, strong growth, improving macro fundamentals and orthodoxy in monetary policy coupled with shifting supply chains have led to a re-rating in their risk profiles.
The EM bond universe has also evolved accordingly given its growing market size, the increasing number of issuers, and the growing green, social, sustainable and sustainability-linked bond market, thereby offering investors a composite asset class with greater liquidity and transparency.
The asset class provides attractive yields, a compelling risk-return profile and a diversified income source compared to traditional fixed income, with the potential for growth from a wide range of regions, countries and companies that exhibit lower correlation to global equities and bonds.
That said, EMD represents not only a plethora of opportunities but also some challenges due to the “work in progress” nature of these economies. The differences between EMs are greater than their similarities; that is why we believe extensive research to identify each country’s economic cycle and solvency risk makes the difference when constructing EMD portfolios.
With a long-term perspective, we believe the current environment offers a supportive backdrop for rethinking the role of EMD in an overall asset allocation. High nominal yields and expectations of rate cuts from the Federal Reserve can offer attractive entry points, especially for active managers who can flexibly navigate the complexity of the universe and the geopolitical realignment that is underway, as well as differentiate between the winners and the losers.
The asset class provides attractive yields, a compelling risk-return profile and a diversified income source compared to traditional fixed income, exhibiting lower correlation to global equities and bonds.
EMD: a larger and more diversified investment universe
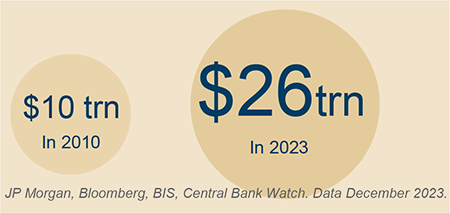
EMD has evolved significantly in the last two decades, given the remarkable growth in the breadth and depth of countries and the number of issuers. Since 2010, the EMD universe has nearly tripled in size, with the asset class expanding to $26 trn from around $10 trn.
Two notable trends have been its rapid growth and expansion, as well as an increased issuance in local currencies from a number of countries.
By sub-asset class, EM local currency debt has experienced the fastest rate of growth due to a shift away from external to local currency-denominated issuance. As a result, countries are less vulnerable than in the past to a depreciation in their exchange rates.
While much of the growth in EM local sovereigns has been driven by China, the number of countries in the index has also increased to 20 from 12 since its inception. Following China’s inclusion in the JPM GBI-EM Global Diversified Index in February 2020, India will be included in the index from June 2024 with a final weight of 10% in April 2025. Given India’s lower correlation to global bonds, the country’s inclusion offers the potential to add diversification to the index and to broader fixed income portfolios.
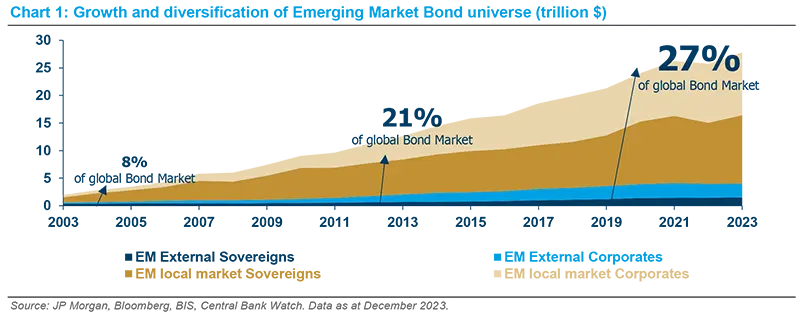
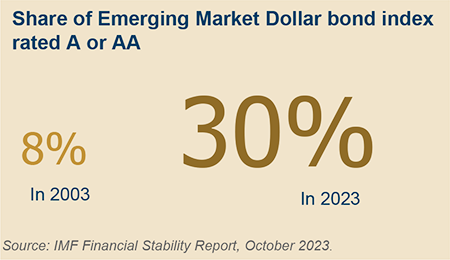
The share of EM in global bond markets has rapidly increased to nearly 30%. However, EM remains underrepresented in global bond indices.
The last decade has also seen the external sovereign hard currency market more than double to $1.4 trn with Gulf Cooperation Council countries being included as well as frontier issuers, many of whom are in subSaharan Africa and/or in the CIS1 . Therefore, nearly 70 are countries represented in the EM Debt Hard Currency Index (see Table 1). The EM corporate universe has also nearly doubled to $2.6 trn with a broadening in the number of sectors and issuers.
As a result of this remarkable growth, the share of EM in global bond markets has rapidly increased to nearly 30% (from 8% in 2003). Despite this, EM remains underrepresented in global bond indices (around 10% of global aggregate indices).
Box 1: Sustainable debt issuance in EM economies has risen exponentially
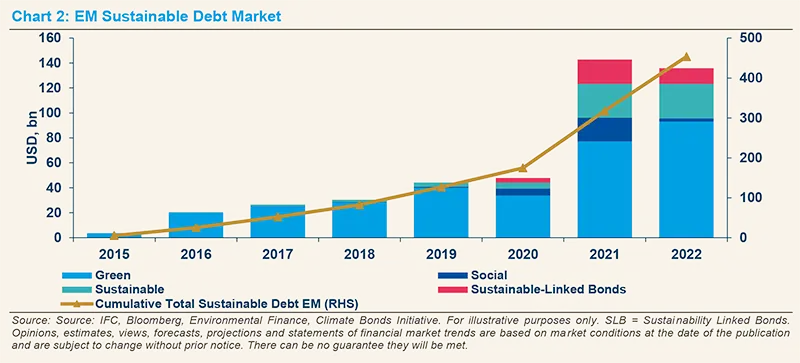
Along with the growth in conventional EMD, there is a rising trend of sustainable debt issuance. The sustainable debt market has gone from being nascent to one that is over $400 bn in size. Sustainable debt includes green2 , social3 , sustainable4 as well as sustainability-linked bonds5. Sustainability-linked bond proceeds are used to finance green or social activities, and/or a combination of both, and are linked to an issuer’s achievement of broad sustainable development goals (SGDs). Although the EM sustainable debt market peaked in 2021, we expect growth to resume as the macro environment improves for global bonds. We also expect the share of sustainable bonds in total EM bond issuance to expand.
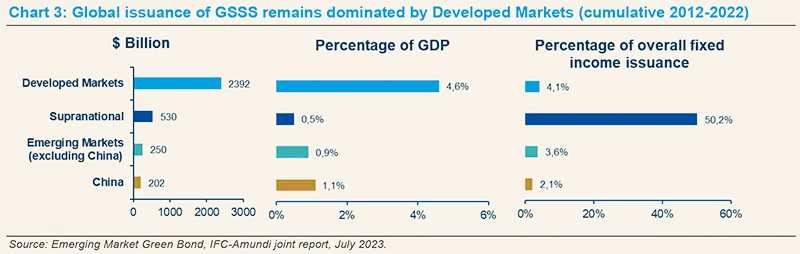
In recent years, there has been a noticeable rise in ESG issuance in emerging economies. However, it is important to acknowledge that there is still a substantial disparity between advanced and emerging economies (see Chart 3). Nevertheless, there is a growing momentum in emerging economies to enhance and broaden their ESG-related practices and financial products. This supports the significant role of emerging markets in promoting sustainability, addressing climate change and encouraging responsible investment. Additionally, these efforts contribute to driving long-term economic growth and development.
EMD Characteristics
Fundamentals – stronger overall, but the universe remains heterogeneous
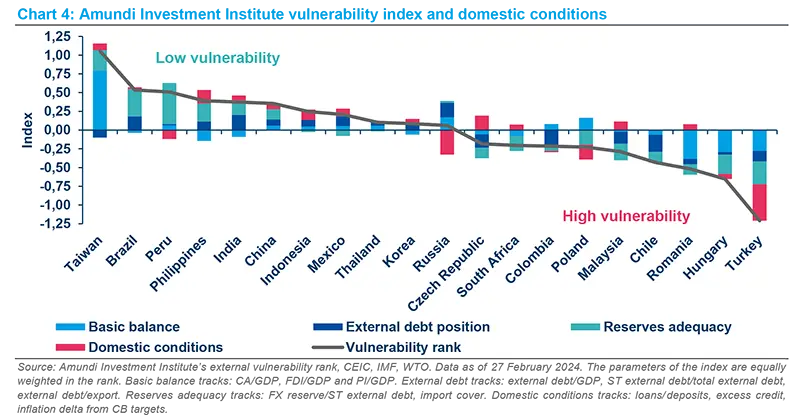
EM country fundamentals improved meaningfully in the last few decades. Macroeconomic stabilisation programmes, often in partnership with the IMF, have led to structural reforms, a move toward floating exchange rates and stronger growth prospects. Since 2000, the EM share of global GDP has expanded from around 25% to nearly 50% today. EM’s share of global financial wealth has also similarly increased as economic models have shifted towards being more domestic-demand driven. As a result, economic fundamentals have improved as inflation has declined and currencies exhibit greater stability than seen in the past.
Over the last 20 years, the move toward floating exchange rates and the trend toward greater local currency issuance has reduced EM’s overall vulnerability to external shocks. There remains significant heterogeneity and dispersion across the universe, however, as fundamentals vary from one country to the next (see Chart 4).
Quality – largely investment grade
It is noteworthy that EMD is largely investment grade – with external sovereigns being the exception. External sovereigns, as represented by the JPM EMBI Global Diversified index, retain a BB+ rating, but the index is almost evenly split between IG/HY issuers. EM external sovereign debt is still compelling relative to other credit markets, particularly given its longer duration while offering a higher yield and rating than US HY. The credit quality of EM external sovereigns has also improved since the 90s from an average B rating.
Liquidity – improved across the board
While liquidity dynamics vary, overall liquidity has improved due to a deepening of local markets and greater investor participation in the asset class. EM FX and local currency sovereigns are the most, followed by external sovereigns and corporates, respectively.

EM defaults are broadly in line with Developed Markets
When considering whether to invest in EMD, investors may be concerned about credit risk given the numerous sovereign crises the universe has experienced. However, as noted previously, EM countries’ credit quality and fundamentals have improved over time.
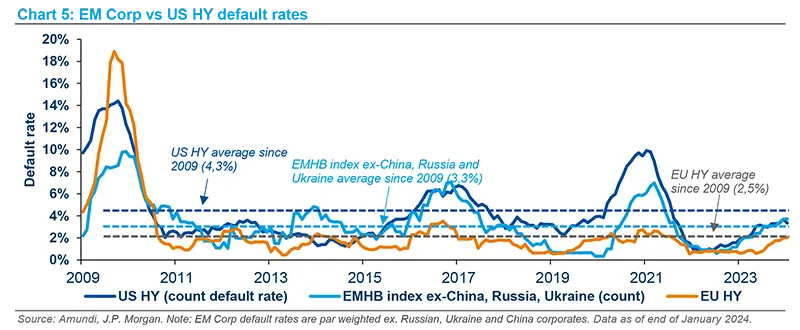
Looking at EM sovereign defaults, they have been at manageable levels historically, averaging around 4% per annum. Default rates increased during the Covid-19 pandemic in 2020 and Russia’s invasion of Ukraine in 2022, whereas in 2023, the sovereign default rate fell to 2%.
A helpful indicator to pinpoint the likely path of defaults is the rating migration trend. Looking at 2023, the number of sovereign rating actions was much more balanced following a more significant level of downgrades during the 2020 to 2022 period. This suggests sovereign defaults are less likely to rise from the levels seen in 2023. Default rates in EM corporate markets are similar to developed markets in that they tend to follow a cyclical pattern consistent with the economic cycle. EM corporate defaults were in line with the US with an average default rate of 3.8% since 2009. Looking at the last 15 years, excluding the turmoil in the Chinese property sector and the Russia-Ukraine war, defaults in EM have largely followed the trends seen in DM.
EMD appeal for global investors
Investors’ allocation to EMD is low at 1-3%
EMD remains underrepresented in global bond indices and, hence, investors’ portfolios according to different ways to measure it.
Various surveys indicate that institutional investors retain a modest allocation to the asset class. For example, only 3% of European institutional investors’ fixed income assets were allocated to actively managed EMD in 20226 while in the US, the allocation was even lower at 1-2% as they invest primarily in domestic bond and equity markets7.
Foreign ownership of EM debt is modest relative to the size of the markets
The foreign share of EM local government bonds is, on average, less than 40%, whereas domestic banks and financial institutions own anywhere between 10% and 70% of local EM debt 8. In EM corporates, according to JP Morgan data, locals own the majority (over 50%) of the asset class. We believe there is scope for interest to resume in EMD as market conditions are more supportive with Federal Reserve (Fed) cuts expected in 2024.
Diversification benefits of investing in EMD: low correlations relative to other asset classes
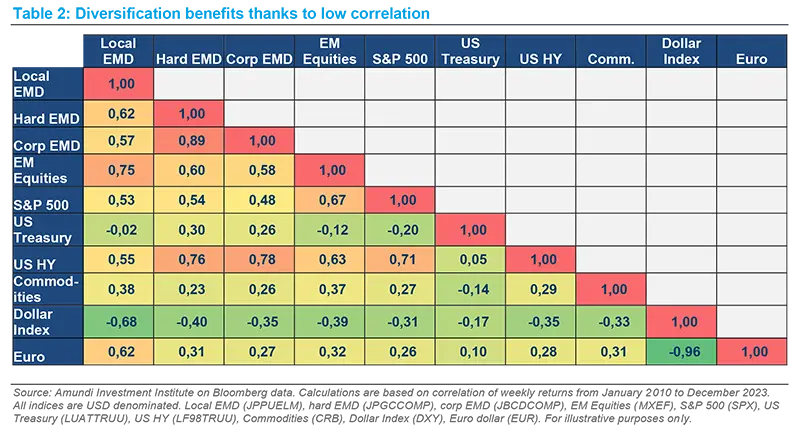
As summarised, most investors are under-invested in EMD, yet the universe provides an attractive source of diversification to broader fixed income and/or equity portfolios. Looking at long-term correlations of EM debt relative to other asset classes, correlations with US Treasuries are low and negative in some cases.
Although the correlations with US high yield are higher, the diversity and varying economic cycles across emerging markets, in our view, allow for greater opportunity to add value beyond mere security selection. These include asset allocation across the EM universe (external sovereigns versus local sovereigns versus corporates), across countries, sectors as well as individual securities.
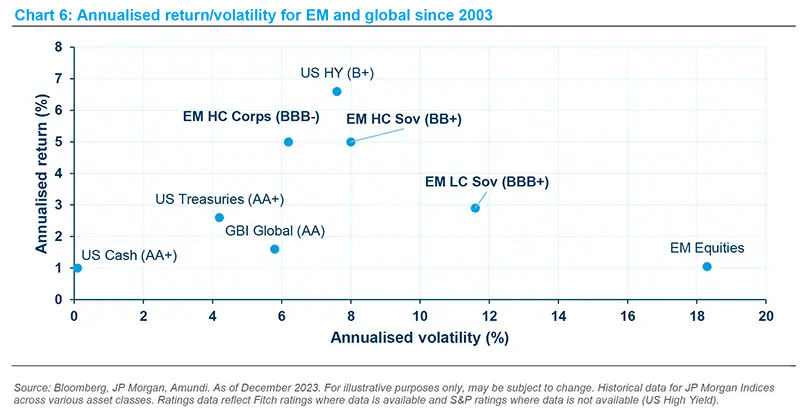
Attractive historical risk-adjusted returns
Looking at the long-term annualised risk-adjusted returns of EM debt versus other asset classes, they are generally equivalent to or better than US Treasuries and global government bonds. EM local sovereigns are the exception due to volatility from the EM FX component. EM corporates tend to have the most attractive historical returns per unit of volatility due to various factors: their lower duration as well as the higher proportion of local investor ownership.
Active management through both top-down asset allocation and bottom-up security selection is crucial in order to identify the most attractive opportunities.
Some may argue that exposure to EM debt can be achieved indirectly by investing in global government bond markets and/or multi-asset credit strategies. We believe however that EM debt should be considered on a stand-alone basis given the heterogenous nature of the universe. EM debt is often seen as a monolithic asset class with minimal differentiation, but this cannot be further from the truth. There are multiple drivers of EM debt performance, including idiosyncratic country factors, political risks, as well exogenous factors such as Fed and European Central Bank rate policy.
In order to identify the most attractive investment opportunities and also avoid the pitfalls, we believe active management through both top-down asset allocation and bottom-up security selection is crucial. There are plenty of opportunities to add value from active asset allocation decisions across the universe. Looking at the annual returns for EM debt, the average dispersion is about 5%, and in some years, much higher.
Why 2024 could be a good year for a core allocation to EMD
Following the stellar performance of EMD last year, 2024 should continue to offer attractive return potential for investors. We believe that now is the time to consider an allocation to EMD as macro conditions are more supportive than they have been for some time. A combination of factors such as potential rate cuts, attractive outright yield levels and low investor ownership, in our view, have the potential to drive compelling return opportunities for the asset class.
Favourable macroeconomic environment: EM-DM growth premium
EM economies have the potential to generate a higher rate of growth compared to developed markets, and this should be confirmed this year as developed market growth is set to decelerate. The growth premium remains in favour of EM led by high-growth countries such as India and Vietnam.
Beyond the cyclical downturn, there are also structural factors at play that are supportive. These factors include incrementally higher global fragmentation which is set to continue. EM offers diversification via countries and companies offering higher growth, higher productivity and opportunities to benefit from shifting global supply chains.

Easing stance reinforced by the disinflation trend
Following significant monetary policy tightening across EM countries over the past two years, they are in an advanced stage of rate cutting cycle compared to DM, and we believe that the disinflation trend should continue. In 2023, some LatAm countries were at the forefront of this trend, such as Brazil, where the Central Bank of Brazil started cutting rates and signalled the possibility of further cuts in the future.
In an environment of a low global growth outlook for 2024, the growth premium in favour of EM versus DM is expected to continue widening. With regard to inflation, disinflation should continue in EM, allowing EM CBs to cut rates further.
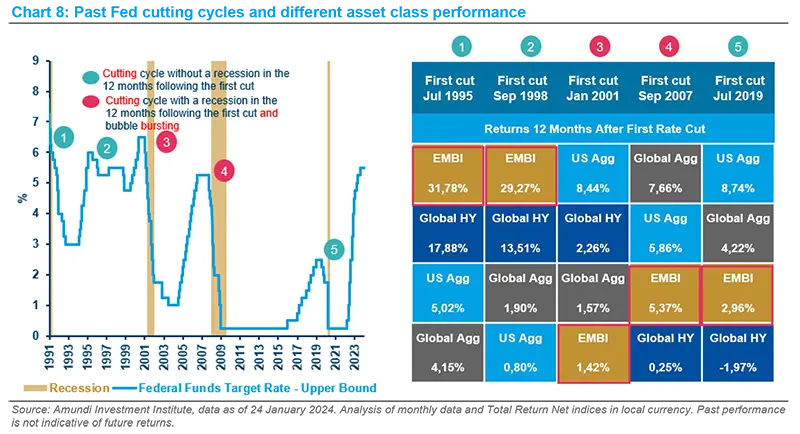
The end of the Fed tightening cycle is a cause for optimism
The expectation of Fed rate cuts in 2024 is promising for the performance of EM debt. EM bonds have historically performed well when the Fed cuts rates as long as the economy does not fall into a deep recession, which is the current macroeconomic scenario. Moreover, a more dovish Fed stance in the second half of the year may improve investor sentiment towards riskier assets. In the last few years, EMD experienced significant outflows at $90 bn in 2022 and $34 bn in 2023, respectively. This is compared to US High Grade bonds which saw net inflows of $239 bn in 20239 . This trend has continued in the firsts two and a half months of 2024 with further outflows of-$8 bn in EM bonds. This is despite the strong performance of the asset class in 2023, as EM debt outperformed most other fixed income asset classes. Improving sentiment may see a quick turnaround in these flows.
The expectation of Fed rate cuts in 2024 is promising for the performance of EM debt. EM bonds have historically performed well when the Fed cuts rates as long as the economy does not fall into a deep recession, which is the current macroeconomic scenario.
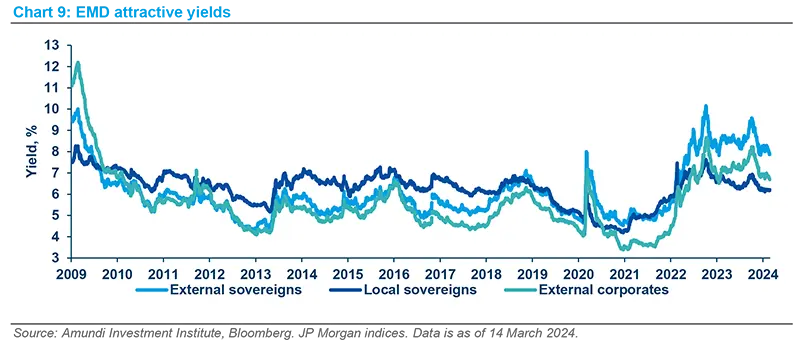
Outright yields are attractive relative to history
Despite the rally seen in EMD, the level of outright yields is still one of the highest seen in the last 15 years. An elevated level of yields should provide a carry cushion should we see further volatility in global bond markets.
Our return expectation for EMD is in the range of 8-10% for the year. Our highest conviction view is in EM HY external sovereign debt given the double-digit yields and attractive spreads it offers, while IG sovereign spreads are near historically tight levels.
Unlike external sovereign debt, which is primarily a view on a country’s creditworthiness, local currency debt is largely driven by the direction of local inflation and interest rates. For EM local currency sovereigns, we expect a solid return of around 8% with room for yields to fall as Central Banks cut rates. Real rates are appealing in select countries, given the disinflation trend, while nominal rates are high. As the EM rate-cutting cycle is likely to be gradual, carry should remain attractive for the asset class. In EM FX, we also have a preference for higher-yielding countries.
An important factor to consider when investing in EM local currency debt is how to treat the underlying FX risk. EM FX has been a source of volatility in the asset class, and until 2023, returns in recent years have been disappointing. For investors that use JP Morgan’s flagship GBI-EM Global Diversified Index, the starting point is 100% unhedged exposure. FX exposure can be fully hedged, partially hedged or unhedged. Although hedging costs have declined in recent years, they can still be significant, so it is important to assess how these costs can impact the return profile of an investment. Hedging costs are predominantly a function of underlying rate differentials and market liquidity.
Therefore, the key takeaway is that active management is crucial in order to navigate the multiple EM currencies, as the universe remains highly fragmented from a performance perspective. There will certainly be periods when it makes sense to hedge the FX exposure, but the tide may be turning, as expectations of lower US rates may diminish support for the USD and drive the search for yield elsewhere. As EM Central Banks were the first to hike rates, short-term rates are high and carry remains attractive, and this should provide a cushion against further EM FX volatility.
Sources and References
1. CIS: Commonwealth of Independent States.
2. Green Bonds: proceeds are used to finance projects or activities with positive environmental impacts. Examples include renewable energy, energy efficiency, green buildings, wastewater management, climate change adaptation and clean transportation.
3. Social Bonds: proceeds are used to finance social projects or activities that achieve positive social outcomes and/or address a social issue. Examples include food and housing security, socio-economic advancement, sustainable food systems, access to essential services and basic infrastructure.
4. Sustainable Bonds: proceeds are used to finance a combination of green and social projects or activities.
5. Sustainability-Linked Bonds (SLBs): structurally linked to the issuer’s achievement of broad SDG goals. Example through a covenant linking the coupon of a bond. In case of progress or lack of progress towards a specific KPI, the coupon could be increased or decreased.
6. Greenwich Associates survey on European investors, released in the first quarter of 2023, covering €5.5 trillion in assets held by over 400 European institutional investors.
7. Data from JP Morgan, “EM as an Asset Class in the Post-pandemic World.” and Brookings Institute, Cross-Border Investment in Emerging Market Bonds, 11 September 2020.
8. Brookings Institute, Cross-Border Investment in Emerging Market Bonds, 11 September 2020.
9. All figures included on the paragraph are from JP Morgan data.


Authors