
Summary
Executive summary
What is the purpose of this paper?
Most institutional investors already have an Investment Policy Statement (IPS) that defines the objectives, investment limits, investment universe and governance of their portfolios. These parameters are not set in stone and must be reviewed periodically given changes in investors’ circumstances, philosophy, long-term expectations and regulations. In this paper we focus on a key tenet of the Investment Policy Statement, the investment objectives, and analyse whether the following questions may lead to their adjustment:
- Should Environmental Social and Governance (ESG) concerns working their way through the entire investment system have implications on institutions’ objectives?
- Faced with the risk of a resurgence in inflation, are absolute return targets dated and should they be replaced with an inflation-linked formula?
- How to ensure that return targets are achievable, and should the persistence of low interest rates lead to a downward adjustment of return expectations?
Who is this paper for?
It is directed towards institutional investors and should be particularly relevant for investment professionals involved in setting strategy or exercising management responsibilities within an investment organisation.
Key messages and recommendations
- While revisiting their Strategic Asset Allocation (SAA) investors should also adjust their investment beliefs, return objectives, risk appetite and constraints to expected long-term evolutions.
- For institutions acting as responsible investors, their preferences for ESG investing will have a marginal effect on their SAA return targets. Climate change will have an impact on returns, but only in aggregate, as its systemic cost ripples through all asset classes’ returns for all investors.
- In a context of higher and uncertain inflation, expressing target returns as an objective above inflation seems especially convenient for those investors with inflation-linked liabilities. In general, as we expect that returns will be lower over the coming decade, we recommend return objectives be lowered as well.
- Alternatively, investors could increase risk to benefit from risk premiums. Portfolio risk should therefore be appropriately monitored via a combination of indicators, prioritizing Conditional Value at Risk (CVaR) to focus on downside return distribution.
What will come next?
This is the first in a series looking to challenge some of the key components of an Investment Policy Statement. In our next publications, we intend to provide practical recommendations to institutional investors on asset allocation, addressing:
- How to articulate the construction of asset allocation over different horizons.
- How to segment the investment universe to optimise the asset allocation process.
Investors should define a dashboard including both absolute and relative risk parameters, and within the former priority should be given to shortfall.
Setting the scene: guide to investors’ strategic allocation
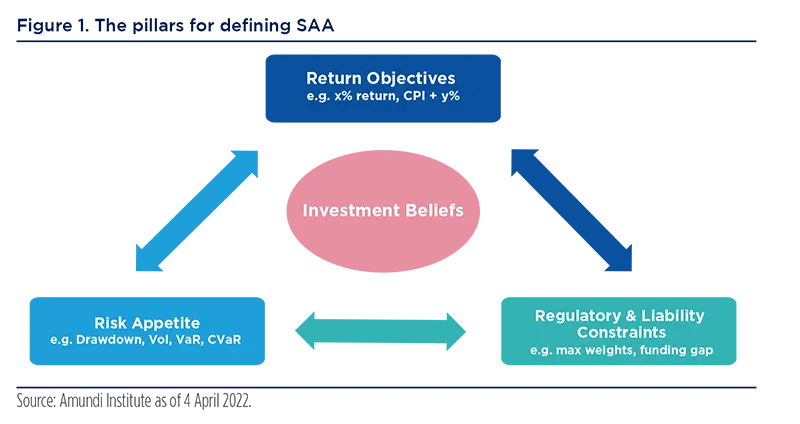
The main pillars on which investors base their Strategic Asset Allocation (SAA), which has widely been recognised as the key driver of portfolio performance, are represented in the image below. These are:
- Return objectives,
- Risk appetite,
- Constraints applying to the institution, whether regulatory, accounting, liability-based or resulting from self-imposed guidelines.
As a backbone of their overall investment approach, institutions should also express the investment beliefs that guide the management of their portfolio. These are core convictions, usually based on theory but also nurtured by the practical experience that should unite all members of an organisation, that relate to the functioning of financial markets and the ways to generate return.
In this article, we will focus on the integration of ESG considerations when setting objectives. We will then provide guidelines on how return objectives should be formulated and discuss whether they should be affected by the low asset return environment that we foresee, and whether risk parameters should be included in the Investment Policy Statement. Regulatory constraints, which are very specific to each type of investor, will not be addressed.
Impact of ESG considerations on an investment objective
An important constraint has recently emerged with the increasing integration of ESG considerations in Investment Policy Statements. It is applied at two different levels:
- In the definition of the governance principles that the institution will apply to the management of its portfolio. This includes an active ownership philosophy or general behavioural rules regarding the interaction with investee companies as well as broader ethics.
- In their role as investors. This can particularly apply to the definition of the investment universe, the choice of benchmarks, the definition of exclusion policies or the criteria for selecting external managers.
Should the willingness to act as responsible investors impact on investment objectives? Some investors believe that it is secondary to their key objective, which is generating returns for stakeholders: quoting a large pension fund we interviewed, “it would be nice to save the world, but this is not our mandate”. We believe that investing in ESG dedicated strategies – ESG-branded benchmarks or investments, such as new energy or hydrogen – are second-order portfolio construction decisions that should not be decided at the SAA level.
Some investors believe that integrating ESG considerations in their strategy is secondary to their key objective, which is generating returns for stakeholders.
Moreover, we recommend that SAA follow a ‘big picture’ approach at the asset class level. ESG compliant investments do not constitute a specific asset class: for example, the risk on green bonds is similar to the risk on traditional bonds. Depending on market appetite, green bonds may offer a premium or discount which is too small to significantly affect portfolio returns, and can therefore be neglected from a strategic standpoint. More generally, the issue of whether ESG ratings will lead to positive or negative excess returns is subject to debate.1
Additionally, the SAA’s investment horizon is usually long. Given this timeframe, the implementation of Net Zero strategies by a large number of investors may lead to significant sector deviations within benchmarks that are difficult to fathom today. Therefore we recommend integrating ESG decisions along a more manageable horizon (3 to 5 years), where allocations are more granular at the sub-asset class level. Investors typically choose their investment benchmark along this horizon.
However, there is an aspect in which ESG considerations may affect any institution’s investment objectives, regardless of its desire to act responsibly. The transition to a Net Zero world entails a significant cost to the overall economy:2 through a combination of lower growth prospects and increased inflation, it should reduce corporate profit margins and degrade investment returns. For example, we find that the cost on 10 year global equity returns is close to 200bp per annum. These effects should be reassessed when the transition costs become clearer, nevertheless, we strive to take them into account today when setting new investment objectives for investors.
Through a combination of lower growth prospects and increased inflation, the implementation cost of climate policies should reduce corporate profit margins and degrade investment returns.
Adopting an inflation-linked return objective
The choice of investment objectives is very much influenced by the specific regulatory and accounting environment that applies to an institution. The following comments are more suited to sovereign funds, pension funds and family offices as well as those insurers, for instance in the health coverage sector, that aim for long-term solvency and are more focused on the economic rather than the accounting income of their portfolios.
Within the insurance sector in particular, European life insurers tend to set annual accounting income as their main objective, mixing income derived from their bond portfolio valued at purchase price with the return generated by their investment portfolio. Life insurers have a very specific framework that deserves to be addressed in another article.
Adopting an inflation-linked objective is sensible, especially for investors whose liabilities are explicitly or implicitly linked to inflation. This is the choice made by the majority of public pension funds when expressing their investment objective.
We observe that these investors formalise their investment objectives in different ways:
- An absolute return objective. This applies to certain sovereign wealth funds that do not have explicit liabilities and can accept a high level of risk, which translates into an ambitious return target (such as 5 or 6% per year). This can also be seen in a major Asian pension fund that sets its return objective in line with its domestic GDP growth forecast, reflecting the need for asset returns to be consistent with underlying economic growth.
- A real return objective. This type of benchmark is favoured by many public pension funds with liabilities linked to inflation: pensions represent a certain proportion of individuals’ salaries, which themselves follow inflation. Japanese pension fund GPIF has actually fully applied this logic when defining its return target in terms of excess return over expected wage inflation, which then translates into an SAA for the next 5 years. As UK pension fund NEST also states in its investment objective, “members need to grow their money in real terms to build a retirement pot”. A real return objective is also quite appropriate for sovereign investors facing implicit liabilities that are indexed to growth in the underlying economy, and for family offices that are willing to preserve the real value of their assets over the long term.
- A composite benchmark, which is typically a bond/equity mix. This approach is actually very similar to the methods detailed above. Such a mix is defined through an implicit return objective, combined with return assumptions for the representative benchmark indices. In order to define it, investors can typically apply a parametric approach, using forward-looking expected returns over an appropriate horizon, combined with historical volatility and correlation, thereby assuming asset returns are normally distributed.
The widespread use of real return objectives among pension funds is illustrated by the results of a survey conducted by the Official Monetary and Financial Institutions Forum (OMFIF) ‘Global Public Investor 2020’, which shows that about 45% of public pension funds have an inflation + x bp type of objective, while 25% use a reference portfolio and less than 20% have a target return in %. Meanwhile, the majority of sovereign funds tend to favour a total return objective.

In summary, adopting an inflation-linked objective is sensible, especially for investors whose liabilities are explicitly or implicitly linked to inflation. This is the choice made by the majority of public pension funds when expressing their investment objective.
Should return objectives be adapted in the current context?
Precise return targets can vary quite significantly across investors. A few investors set very ambitious return targets, close to 6% in real terms for the most dynamic profile offered by one of the Swedish AP Funds. Members of Australian DC pension funds are generally given the option of a range of profiled asset mixes defined along CPI + % objectives, ranging from CPI + 1% or 1.5% for the most conservative to CPI + 5% for the most dynamic, corresponding to the different needs expressed by future pensioners depending on their age and ability to take risk.
We reviewed a selection of very large international public pension funds, and, according to our sample, a real return objective of CPI + 3% is the most common. This is often translated into a reference allocation split between hedging and growth assets. The relative share of these two categories of assets is obviously related to the investor’s return objective, as illustrated in Figure 3. Most funds analysed have set a target return around CPI + 3%, corresponding to a share of about 30% for fixed income and cash allocation, in coherence with the low inflation environment of the past decades, but which could be challenged in a different macroeconomic regime.

The target return and allocation to risky assets should be checked through portfolio simulations based on asset return forecasts and volatility and correlation estimates, taking into account inflation.
The consistency between target return and the scale of allocation to risky assets should be checked through portfolio simulations based on asset return forecasts and volatility and correlation estimates, taking into account the inflation outlook. The interest of such analysis is to provide a most likely range of outcomes: this will help investors that are subject to a minimum return or maximum loss constraint when setting their allocation.
In the case of changes to the macroeconomic environment, long-term asset return expectations need to be modified as well, potentially justifying a revision of return objectives. Figure 4 compares our expected returns for major asset classes over the next 10 years in our central scenario with historical returns. It underlines the challenge investors will face in generating a given return target, such as CPI + 3%. This is due to our expectation that real interest rates will increase compared to the recent past when they have been unusually low or negative as a result of extremely accommodative monetary policies. The expected increase in yields will penalise bond returns, which we forecast to be very modest in major markets over the next decade. As explained earlier, equity returns will also be affected by the cost entailed by climate change over the next 10 years. As an illustration, we estimate that a standard 50% equity / 50% bond allocation could deliver an annualised return of just 3.7%, compared with a return of 10.7% in the past 10 years, leading investors to adjust their return target to the downside.

The Norwegian sovereign wealth fund has done so by revising its long-term objective in 2017 from 4% per year in real terms to 3% per year. Lower interest rates have also led many pension funds to adjust the discount rate they use to estimate their liabilities, leading to a downward revision of their return targets as well. An alternative, wherever possible, will be for investors to increase their allocation to risky assets, to the extent they have the capacity to take more risk. Some may also decide to manage their portfolio more actively, hoping to generate excess return through active allocation and manager or security selection, but such a strategy may not necessarily be successful and presupposes strong active management skill.
In case of changes to the macroeconomic environment, long term asset return expectations need to be modified as well.
Risk parameters: focusing on the downside
There is an obvious link between the definition of a return target and the risk limits associated with it. As investors look for more risk in the context of a low return environment, setting appropriate risk limits is essential. It requires a clear definition of an investor’s risk profile and an analysis of portfolio behaviour in stressed market circumstances.
An institution’s risk appetite is often reflected by a reference portfolio, which is not necessarily used as a performance benchmark. This is the case for GIC, a major sovereign fund, which looks at a 65% global equities / 35% global bonds reference portfolio as an appropriate representation of the risk it is prepared to take in generating good long-term investment returns.
Setting risk limits requires a clear definition of an investor’s risk profile and an analysis of portfolio behaviour in stressed market circumstances.
Looking at absolute risk parameters, investors’ main objective is to have an estimate of the potential loss they may incur. Many methodologies can be used, such as historical and forward-looking simulations, to assess the ultimate risk limits. An ultimate risk limit should be activated when realised performance becomes close to a shortfall or loss, corresponding to an institution’s risk tolerance limit.
Risk budgets can sometimes be defined in terms of an absolute amount expressed in local currency: for example, Danish pension fund ATP’s total risk (the risk consumption) is calibrated using a simulation of its benefits commitments. Others define risk tolerance as maximum shortfall over a certain horizon (for instance 15% for the medium-term asset allocation plan of a major Asian pension fund). A shortfall constraint can be translated into a Value at Risk (VaR) or Conditional Value at Risk (CVaR) constraint, with specific assumptions regarding horizon, frequency, confidence level, etc. CVaR represents the expected return of the distribution below a certain threshold. It is more precise than VaR as it captures the asymmetry of the distribution; our optimisation process at Amundi focuses on CVaR instead of standard volatility / VaR minimisation.
In the institutional world, VaR and CVaR are the most used measures to quantify potential loss, even though investors also typically monitor portfolio volatility and Sharpe ratio, which are then usually measured on an ex-post basis and are not forward-looking constraints.
Risk parameters can also be related to relative risk, and tracking error volatility (or TE), defined on an ex-ante or ex-post basis, is the most used and known indicator for this purpose. TE should be set as a function of the institution’s excess return target, which itself depends on the information ratio it aims to achieve over the long term, as well as on its investment beliefs regarding the potential value added to be generated through active management.3
The tracking-error of active management (including both Tactical Asset Allocation and security / fund selection contributions) relative to institutional investors’ SAA is generally modest. A Mercer survey cites a 2% average tracking-error, with a 0.3 to 0.35 information ratio, corresponding to an expected excess return of 50 to 75 bp.4
These tracking error targets should be viewed as indicative and not as strict limits. They should be monitored over a relatively long period, such as 3 to 5 years, as this is representative of a typical market cycle. Indeed there are times when investment opportunities appear more attractive, justifying devoting a higher risk budget to active strategies than the long-term average for example.
Tracking error targets should be viewed as indicative and not as strict limits. They should be monitored over a relatively long period, representing a typical market cycle.
Our conclusion is therefore that investors should define a dashboard that includes both absolute and relative return risk parameters, and that within the former they should give priority to expected shortfall or CVaR that are often a better reflection of risk tolerance. We also recommend that investors apply a certain flexibility in deciding to act on these indicators and to abstain from automatic stop-loss rules that can be dangerous in highly volatile market environments.
_____________
1 See Elodie Laugel and Thierry Roncalli: “The green risk premium and the performance (s) of ESG investing”, Amundi Shifts § Narratives # 15, March 2022.
2 For an analysis of the impact of climate scenarios on asset returns, please see our recently published “Keeping up with climate change. Asset classes views: medium to long-term scenarios and return forecasts, edition 2022”, Amundi Institute.
3 On this issue please refer to “Setting objectives for your asset allocation”, Amundi Discussion Paper, DP-32-2018.
4 Mercer, “Norwegian Ministry of Finance, Survey on Active Management – Final Report”, December 2009.
Definitions
- Basis points: One basis point is a unit of measure equal to one one-hundredth of one percentage point (0.01%).
- CVaR: Conditional Value at Risk. Also known as the expected shortfall, it is a riskassessment measure that quantifies the amount of tail risk an investment portfolio has. CVaR is derived by taking a weighted average of the extreme losses in the tail of the distribution of possible returns, beyond the VaR cut-off point. Conditional value at risk is used in portfolio optimisation for effective risk management.
- Sharpe ratio: A measure of excess return per unit of risk, as defined by standard deviation. A higher Sharpe ratio suggests better risk-adjusted performance.
- Solvency: Solvency is the ability of a company to meet its long-term debts and financial obligations.
- Tracking error: A measure of how closely a portfolio follows the index to which it is benchmarked.
- Volatility: A statistical measure of the dispersion of returns for a given security or market index. Usually, the higher the volatility, the riskier the security/market.
Authors