
Summary
Stronger-than-expected economic data means that there is no rush for the Fed to start cutting interest rates. We expect the first Fed cut to occur in June.
- Unlike at the end of 2023, global equity and bond markets have diverged since the beginning of 2024.
- While US economic growth remains strong, the pace of disinflation has become more gradual.
- This combination of stronger-than-forecasted growth and inflation has led markets to revise their Fed rate cut expectations.
After moving in the same direction last year, global equity and bond markets have begun to diverge in 2024. Stocks have extended their gains, while bonds have suffered due to stronger economic data, which has increased uncertainty about when the Fed will begin cutting rates
Indeed, US macro data remained strong this week. A 2nd estimate of GDP growth for the last quarter of 2023 showed a marginal downward revision, but still sound consumption. Recent inflation gauges also confirmed that the transition towards lower inflation is decelerating.
As a result, markets have delayed and moderated their expectations for Fed rate cuts. We now expect the Fed to start cutting rates in June 2024.
Actionable ideas
-
In credit favour quality
Strong economic data supports credit markets, but with the Fed on hold, we would favour higher-quality companies less exposed to high costs of refinancing. -
Multi Asset to balance opportunities and risks
A multi asset approach could help to exploit equity opportunities, while also potentially benefiting from the appeal of bonds during a phase of economic slowdown.
This week at a glance
Equity markets fluctuated within a narrow range this week, consolidating after their sharp rise in the previous days. Despite short-term volatility at the time of the US Core PCE figures’ publication, bond yields, the USD and oil prices concluded the week with minimal changes.
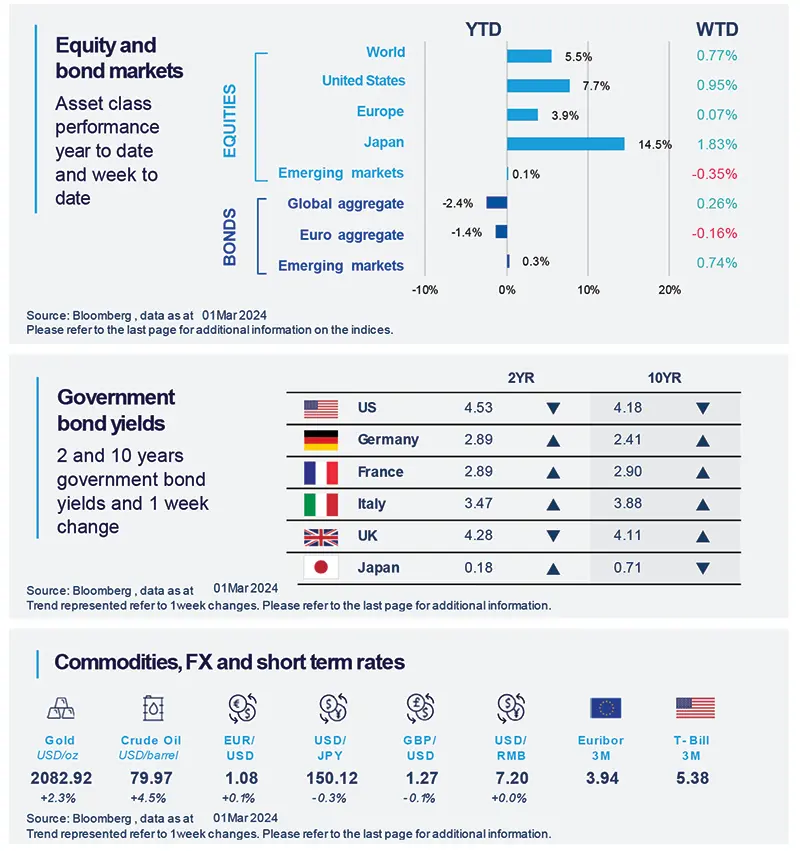
Equity and bond markets (chart)
Source: Bloomberg. Markets are represented by the following indices: World Equities = MSCI AC World Index (USD) United States = S&P 500 (USD), Europe = Europe Stoxx 600 (EUR), Japan = TOPIX (YEN), Emerging Markets = MSCI Emerging (USD), Global Aggregate = Bloomberg Global Aggregate USD Euro Aggregate = Bloomberg Euro Aggregate (EUR), Emerging = JPM EMBI Global Diversified (USD)
All indices are calculated on spot prices and are gross of fees and taxation.
Government bond yields (table), Commodities, FX and short term rates.
Source: Bloomberg, data as at 1 March 2024. The chart shows Global Bonds= Bloomberg Global Aggregate Bond Index, Global Equity = MSCI World. Both indexes are in local currency.
*Diversification does not guarantee a profit or protect against a loss.
Amundi Investment Institute Macro Focus
Americas
As expected, Core PCE inflation in the US reaccelerated on a monthly basis.
As broadly expected after the producer price indices released last week, the Core PCE Deflator eased only marginally in January to 2.8% (2.9% prior), reaccelerating on a monthly basis to 0.4% from 0.1% in December. This is the fastest pace in nearly a year, prompting some worry about inflation reacceleration, which at this stage is not our base case.
Europe
Eurozone inflation surprises slightly on the upside in February.
Eurozone inflation eased somewhat less than expected in February as headline consumer prices decelerated from 2.8% to 2.6% (consensus 2.5%), while core inflation declined from 3.3% to 3.1% (consensus 2.9%), with dips in Germany (2.7% from 3.1%), France (3.1% from 3.4%) and Spain (2.9% from 3.5%), while in Italy inflation was unchanged at 0.9%. We expect the disinflation trend to progress.
Asia
India’s growth more buoyant than expected.
India’s GDP for CY (civil year) Q4 2023 was much stronger than expected at 8.4% YoY (vs 6.6%). Again, domestic demand (notably consumption and investment) is driving growth while net exports have been a drag. In addition, the Statistical Office revised recent years’ GDP: in CY22 at 6.6% from 6.9% and, in 2023, the revisions together with the new data at 7.7% YoY vs. 7% YoY previously expected.
Key Dates
|
5 March Euro area final PMI |
7 March ECB Monetary Policy Committee |
8 March US Employment Situation Report |
GLOSSARY
- Core PCE Deflator: A measure of prices that people living in the United States, or those buying on their behalf, pay for goods and services.
- Disinflation: A temporary slowing of the pace of price inflation.
- GDP: Gross Domestic Product.
- MoM: month over month growth.
- PCE: Personal Consumption Expenditure
- Purchasing Managers' Indices (PMI): PMI Indices are economic indicators derived from monthly surveys of private sector companies.
- Small caps: stock market cap of $250 million to $2 billion.
- QoQ: Quarter on quarter.
- YoY: Year over year growth.
- YTD: Year to date.

Author