
Summary
Key takeaways
The adoption of AI among businesses and households is progressing quickly, although it is still in its initial phases. There is considerable potential for wider implementation. The productivity improvements driven by AI are expected to be substantial.
The macroeconomic impact varies across countries. Generally, advanced economies are readier than emerging ones to adopt AI. However, some emerging economies, such as China and a few Eastern European countries, are among the leaders in AI preparedness.
We expect AI-driven capex to be more broad-based going forward. The United States will be an early winner in the first decade of AI adoption, while DM Europe will follow in the second decade, with a lower contribution to GDP growth (around 0.3pp). Asia currently lags behind in the estimated impact.
Competition and innovation should help broaden the benefits of the new technology across the economy by lowering barriers to entry, accelerating adoption and creating new opportunities.
AI uptake: what have we learnt?
AI uptake by companies and households appears to have increased significantly in recent months. This is one of the factors that will determine whether AI will increase productivity gains significantly. As we will show in this section, a lot of new data and statistics have been published over the past quarters, and related knowledge has improved.
In the United States, since September 2023, the Census Bureau has included questions on the adoption of AI in the fortnightly survey it conducts among a large sample of companies. In December 2024, over 6.0% of US companies in all sectors already indicated that they were using AI in their production process, compared to only 3.7% a year earlier: in a very short period of time – this share has increased significantly. Furthermore, around 9% indicated that they intended to use it within six months (this share is also increasing).
The adoption of AI by companies is rapid and that it is only in its early stages: the potential for diffusion is significant.
US companies using or planning to use AI in producing goods and services

The adoption of generative AI by households is very rapid. A NBER working paper published in 2024 shed some light on the phenomenon and even showed that the adoption of generative AI by households was ahead of that of computers and the internet in their time.
Indeed, its adoption rate among the population aged 18 to 64 is 39.4% two years after its launch, twice as high as the internet at the time. Another interesting point of this study is that roughly the same share of people surveyed indicate they are using it at work and outside of work. The diversity of tasks requested is important.
For people who use it at work, we find in order of relevance it is used for: writing communications, performing administrative tasks, interpreting/translating/summarising, and searching for facts or information. For people using it outside of work, we find in order of importance it is used for: writing communications, interpreting/translating/summarising, personal assistance and research of ideas. This illustrates the potential for the development of the use of generative AI.

The increased focus on the importance of measuring the impact of AI in the economy is testified by the recent increase in data published on the topic.
For instance, the US Census Bureau started publishing the investment breakdown with a special carve-out on data centres, highlighting the increased relevance of private investment in data centres compared with the total.
Also, it recently published a special focus on employment in data centres in its Quarterly Workforce Indicators, showing that employment in US data centres increased more than 60% nationally from 2016 to 2023, with the two most populous US states having the nation’s highest share of data centre employment, at 17% in California and 10% in Texas.
General office vs. data centres

Impacts of AI on sectors and global economy
Empirical studies focusing on a bottom-up and microeconomic perspective show that productivity gains enabled by AI can be spectacular at the sectoral level. Here, numerous studies have been published in 2024. An MIT study is one example. The researcher was allowed to follow the scientific teams of a large US company in the materials engineering sector for several years. This company deployed AI tools in several waves, which made it possible to measure the productivity gains of scientists linked to AI. The paper shows that – all other things being equal – AI-assisted scientists discover 44% more materials. This influx of materials led to a 39% increase in patent filings and, several months later, a 17% rise in product prototypes incorporating the new compounds. Accounting for input costs, the tool boosts R&D efficiency by 13-15%.
The same type of results has been found in the pharmaceutical industry, as increasing numbers of drugs and vaccines have been discovered with AI. The success rates for AI-discovered molecules in Phase I and II trials are roughly twice that of molecules discovered in a conventional way, which would enable companies either to achieve the same output with fewer resources and cost, or to increase the total number of new drugs launched with the same resources.
|
| Productivity gains enabled by AI can be spectacular at the sectoral level. In the pharma industry, for instance, increasing numbers of drugs and vaccines have been discovered thanks to AI. |
Impacts of AI on sectors and global economy
Productivity gains enabled by AI will be significant: annual labour productivity growth should increase by around 1pp in the coming decade. |
|
Empirical studies at the macroeconomic level are less conclusive due to the complexity of productivity measurement on an aggregate scale. A flurry of estimates – several of which are from international institutions like the IMF and the OECD – on the impact of AI on productivity have been published in 2023-24.
They focus on different countries and make different assumptions on key factors, such as: speed of adoption of AI by companies, adequacy of skills for adoption, future progress in AI models, degree of integration with robotisation for the most manual tasks, public policies to promote/slow the adoption of AI, etc.
Thus, it is understandable that they reach very different conclusions on the economic impact. Nevertheless, they all agree that the productivity gains enabled by AI over the coming decades will be significant on the macroeconomic level, with several of them concluding that annual labour productivity growth should increase by around 1pp in the coming decade. While this finding is generally positive and promising, it remains to be seen whether the positive impact of AI will be enough to counteract the negative effect on economic growth of population ageing that is taking place in both developed and emerging economies.
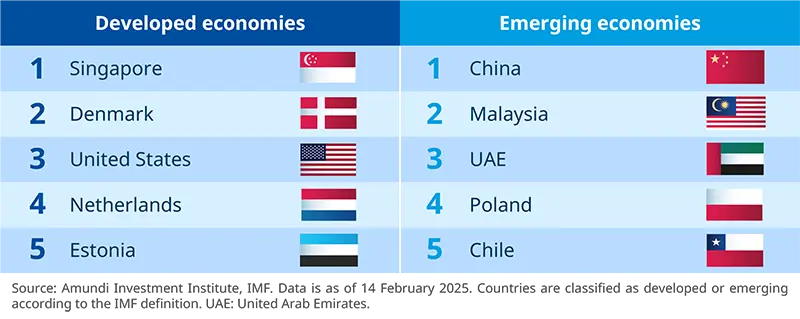
The main message from the above studies is that AI is a theme with broad macroeconomic and financial implications. As such, we are incorporating it explicitly in our long-term Capital Market Assumptions publication and are progressing our analysis by differentiating across economies based on a mix of structural and institutional characteristics that allow us to identify leaders and laggards on productivity-driven AI across both developed and emerging economies. Interestingly, some emerging economies appear well positioned among the leaders in AI preparedness and adoption.
Top five DM and EM economies for AI preparedness
How to estimate the AI impact on productivity and investment
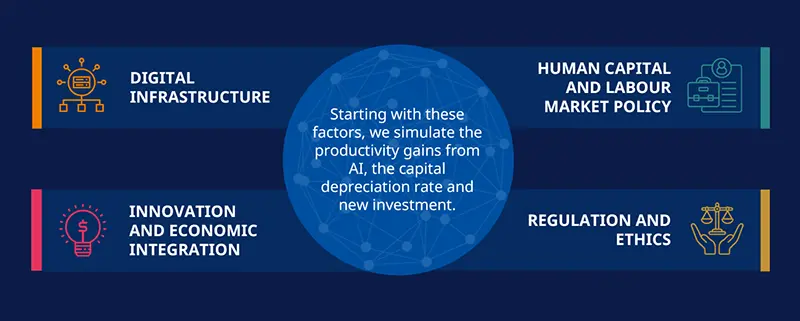
We use the IMF AI Preparedness Index and its sub-components (see box below) to differentiate the starting point across economies, while aspects such as regulation, innovation intensity and capital availability limit the peak and speed of productivity gains over time. According to these factors, productivity, capital investment and capital depreciation are modelled to estimate the impact of productivity on potential GDP growth.
Starting point: We use the AIPI (latest available data as of 2023) as a starting point across economies. This index covers multiple areas for AI readiness and is made up of a selected set of macro-structural indicators deemed to be relevant for AI adoption, organised in four groups: digital infrastructure, innovation and economic integration, human capital and labour market policies, regulation and ethics.
Countries are then ranked accordingly. This is our starting point for simulations: the lower the rank, the smaller the productivity gain.
Productivity: The productivity gain is shaped similarly to the US curve experienced in the 1990-2000s. The peak is modelled to be hit on average 14 years after AI introduction. Yet, according to each country’s readiness, the productivity gain both at peak and along the curve varies across countries based on the AIPI and other parameters representing regulation and likelihood of success. Regulation identifies those countries where red tape makes innovation slower and the economic impact mode gradual. ‘Likelihood of success’ differentiates countries based on the probability of their investment in innovation to translate into widespread gains.
Depreciation rate: This index is also modelled on the US experience in the 1990-2000s period, assuming that, when a new technology is introduced, the existing capital becomes obsolete more quickly than before. Depreciation rates are differentiated across countries based on the AIPI.
Investment and capex: As capital becomes obsolete faster, new investment is required. We assume that the investment side will also react to the technology revolution, with a pickup in capex. However, higher capex may not translate into evident benefits in terms of productivity, especially in the early phases, given high depreciation and the limited likelihood of success.
Considering all the above elements, we expect the United States to be an early winner in the first decade of AI adoption, with an estimated contribution to GDP growth from the AI boost to productivity of about 0.35pp. DM Europe will follow in the second decade, with a lower contribution to GDP growth (around 0.3pp), while Asia lags behind in the estimated impact despite some of its economies currently ranking among the top ones for AI preparedness. For Asia, we see the contribution to GDP growth as only 0.14pp in the second decade of AI adoption. These results can be well explained by looking at the regulation sub-index in the AIPI, which is key in the case of innovation diffusion: it is penalising for Asia compared to Europe, and penalising for Europe compared to North America. The latter has less red tape than the other regions, so it can adopt any innovation more quickly. In the chart above, the peculiar dynamics shown for LatAm – which will peak in the second decade and then the contribution to growth will fall back – could be explained by the lack of investment in LatAm, which prevents AI from supporting GDP growth more forcefully.
The United States should be an early winner in the first decade of AI adoption; DM Europe will follow in the second decade, while Asia lags despite some of its economies currently ranking among the top ones for AI preparedness.
AI tracking in the United States
While AI-related capex is in the spotlight and has grown in relevance supporting broader capex, it still accounts for just 7% of the overall capex. As such, it is not ‘visible’ as a game changer in national accounts. Yet, by monitoring some timely economic data that is already available, it is possible to gauge the speed of adoption in the economy among companies and households. We developed an ad-hoc monitor to help track its impact on a timely basis (e.g., for capex and GDP, we focus on computers and peripheral equipment, tech industrial production, regional Fed tech surveys, and the construction of computer and electronic facilities).
On real capex, it emerges that, as of Q3 2024 data, after an initial surge in R&D and software spending in 2021-22, both trend and momentum have moderated progressively in these categories. Meanwhile, there has been a strong pick-up in computers and peripheral spending that accelerated strongly in 2024, boosted by AI-driven server demand, mirroring rising investment and adoption across businesses and sectors (see chart below).
Real non-residential investments, IPP sub-categories

This trend is also clearly visible in the dynamics of durable goods orders, where new orders for durable goods, computers, and related products have surged dramatically since 2022 and remain on a strong upward trend. This suggests that computer capex will remain supported, as well as industrial production, which reaccelerated in H2 2024. Notably, the industrial production sub-index for high tech has decoupled strongly from the overall index.
|
| New orders for durable goods, computers, and related products have surged dramatically since 2022 and remain on a strong upward trend. |
|
| This suggests that computer capex will remain supported, as well as industrial production, which reaccelerated in H2 2024. |
|
| The industrial production sub-index for high tech has decoupled strongly from the overall index. |
AI tracking in the United States
Conclusion
Recent developments in AI highlight how quickly the tech sector evolves, impacting companies that have built competitive advantages and sparking investor enthusiasm in recent months. For these companies, the arrival of DeepSeek (China’s new entrant in the field of AI) and of more efficient open-source AI models increases uncertainty regarding the future earnings path. However, from a macroeconomic standpoint, we see it as a possible turning point for AI adoption, showing that the AI theme is not over, but is evolving.
In particular, cost efficiency is a key driver of technological diffusion, explained by a key concept for the AI revolution, the Jevons paradox. This states that increased efficiency in a technology can lead to the increased consumption of a certain resource as the technology becomes more affordable; higher efficiency will not necessarily translate into lower investment, but likely the opposite. The AI investment that was unfeasible for many small companies, now becomes affordable. AI investment becomes more broad-based and potentially much higher in compounded terms on the overall economy. Trends in normalisation in AI-related capex among the Magnificent 7 are pointing in this direction, as we expect to move from a phase of concentrated AI capex, to a phase of possible wider adoption. In fact, lower costs for AI models could lead to faster adoption by both corporates and households, higher spending, and aggregate investment for AI, boosting aggregate productivity.
To sum up, we expect the AI trend to drive economic and market outcomes. The latest events align with our view that continued competition and innovation are likely to create winners and losers, and help broaden the benefits of the new technology across the economy by lowering barriers to entry, accelerating adoption, and creating new opportunities.
Magnificent 7 capex trend

Competition and innovation will create winners and losers while broadening technology's benefits by lowering entry barriers and accelerating adoption.
Authors