
Summary
Executive summary
What is the purpose of this paper?
In a previous paper, we addressed the issue of how to set investment objectives. In this paper, we address another key issue in the definition of asset allocation: how to articulate it across different time horizons. More specifically, we aim to answer the following questions:
- What are the typical definitions of strategic and tactical allocation as well as of medium-term asset allocation as an intermediate layer?
- What are the decision drivers across these different horizons?
- How is investment governance organised at these three levels?
- How does one budget risk across them?
Who is this paper for?
It is directed towards institutional investors and should be particularly relevant for investment professionals involved in setting strategy or exercising management responsibilities within an investment organisation.
Key messages and recommendations:
- Strategic Asset Allocation (SAA) is the key decision for all institutions, as it is representative of their risk appetite and return objectives.
- Mid-term Asset Allocation (MTAA) can be a useful for tilting SAA towards certain strategies expected to outperform in the medium term.
- Those investors that believe in the potential benefit of active management can implement Tactical Asset Allocation (TAA). Investors should then make sure that they provide portfolio diversification.
- SAA, MTAA and TAA have different drivers: long-term returns and risk assumptions for SAA, expectations on the economic and monetary cycle for MTAA, and short-term risk and momentum-based indicators for TAA.
- The leeway allowed to TAA strategies depends on the investor belief, but it should be limited in order to avoid any significant modification of the investor portfolio’s risk profile.
- In quantifying such leeway, the use of risk-based indicators such as Value at Risk (VaR) and Conditional Value at Risk (CVaR) looks appropriate.
What next?
This is the second paper in a series looking to challenge some of the key components of an investment policy statement and provide practical recommendations on important asset-allocation-related topics. In our next publications, we intend to address the issue of how to segment asset allocation and define the universe of eligible asset classes.
Strategic Asset Allocation is the key decision for all institutions, as it is representative of their risk appetite and return objectives.
SAA, MTAA, TAA: what do they mean?
Investors are familiar with the idea of SAA and TAA, but precise definitions may vary across institutions depending on what is relevant to decisions over each time horizon. In addition, there is no consensus on which parameters should be analysed before making SAA, MTAA or TAA decisions nor about the governance of these investment decisions. In this paper, we focus on their main drivers while discussing the appropriate governance of these different decision layers before providing elements on how to allocate risk across different investment horizons.
While the decision to allocate risk across different horizons is highly related to investors’ beliefs and areas of expertise, SAA is considered the key step for any institution, as it is representative of their risk appetite and return goals over the long term. This horizon is typically 10 years, and possibly even more for long-term investors such as sovereigns or pension funds, consistent with their investment horizon. SAA is generally defined with the help of a risk-return optimisation, based on the process we defined in our previous paper “Setting your investment objectives: institutional asset allocation practice”.
A number of investors then allow some flexibility around SAA to implement tactical allocation, but some of them have introduced a third layer, generally called MTAA, which they can use as their portfolio benchmark.
Setting an MTAA helps investors define their asset allocation with more granularity by tilting the SAA towards certain asset classes and currencies, geographies, styles or themes based on medium-term views (typically three to five years). Some MTAA parameters may differ by institution, such as the name itself (Dynamic Asset Allocation is also used), or by time horizon, which can be reduced to one to three years. Here are a few examples of MTAA decisions:
- Taking a medium-term position on the US dollar against the institution’s domestic currency, thereby implementing a different hedging level of its exposure to foreign assets than that implied in SAA.
- A pension fund decided to reduce significantly the duration of the fixed-income part of its portfolio in anticipation of a rise in interest rates.
- Likewise, an institution may choose to replace part of a government debt portfolio with exposure to credit in anticipation of a contraction – or at least stability – of credit spreads. Within the equity portfolio, it can mean implementing a medium-term overweight on certain regions or factors, such as a structural overweight on value or quality factors that would be expected to outperform over the medium term.
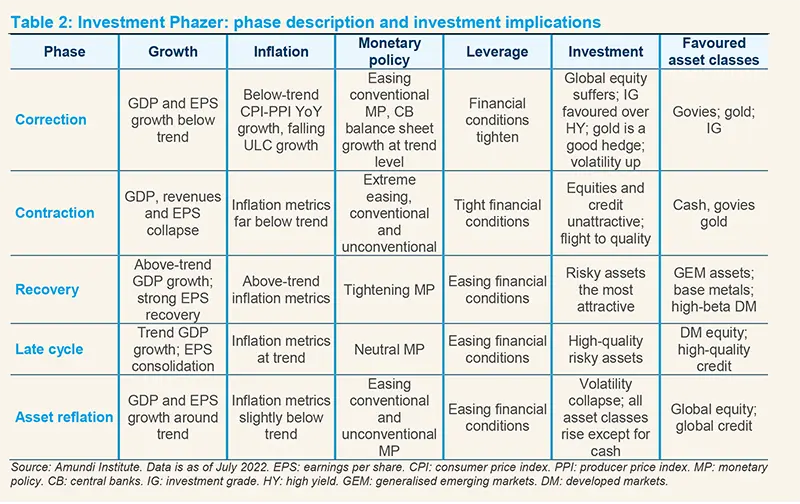
When setting MTAA, investors typically rely on the identification of macroeconomic and financial regimes that are associated with different returns and behaviours for asset classes. A description of the asset return behaviour under the different macroeconomic regimes, based on a methodology developed by the Amundi Institute, is shown in box 1.
Box 1: MTAA is driven by the economic cycle
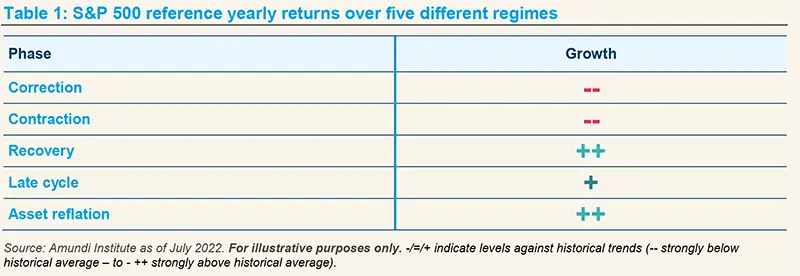
Growth and inflation have historically been the key pillars of macroeconomic regimes. In the current complex world of multiple equilibria, long-term analysis and historical averages are not sufficient to explain returns, volatility and correlations that cannot be considered as governed by mean reversion. This observation led us to explore innovative ways to take into account structural changes in the macrofinancial environment. We have included the unconventional stance of the main central banks’ (CB) monetary policies as well as the high leverage and debt levels into one of our dynamic allocation models: our multi-dimensional framework Advanced Investment Phazer. For this tool, we developed a clustering algorithm and applied it to a set of over 20 select variables for a group of developed and emerging countries. As a result, we identify a fifth regime – asset reflation – in addition to the four classical phases of the economic cycle: slowdown, correction, contraction and recovery.
We use machine learning and clustering algorithms to detect turning points. Earnings and growth dynamics are key discriminants of the different patterns that financial markets display across the business cycle while changes in monetary policy decisions help calibrate the algorithm’s precision. Our analysis confirms that average risk-adjusted returns tend to decrease when moving from economic expansion towards the end of the cycle. Under such circumstances, returns are negative and hit their lowest values when the cycle moves to correction and contraction phases, then rebound sharply when recession ends and an early phase of the cycle (recovery) starts again. A significant feature of the asset reflation phase is strong CB intervention (via rate cuts or direct asset purchases) that can support financial asset returns and depress market volatility. This happens with no extra boost from growth, which remains at trend.
As financial markets are driven by expectations, we use one- to three-year forecasts for the four considered dimensions (growth, inflation, monetary policy and leverage) to simulate the regime sequence. Returns, volatilities and correlations of different assets are calculated and optimal portfolios are built for each of the five cyclical phases based on historical information in order to maximise the risk-adjusted performance. In this process, different allocations corresponding to the different phases are combined and weighted by their estimated probability. Although every business cycle is different, our analysis suggests that a dynamic, cycle-based asset allocation has the potential to outperform and minimise portfolio drawdowns by increasing the diversification in positions. We believe that this approach is particularly suitable to make asset allocation decisions at the MTAA level.
Not all investors have defined MTAA as a step in their asset allocation process. For some, SAA is more similar to what we would rather qualify as MTAA and is explicitly set with a medium-term horizon. Regarding TAA strategies, the differences with MTAA lie in the following:
- Horizon of the active strategies – typically one year or just a few months at most – and the frequency of their review. They should be managed actively, with positions cut more systematically when targets are reached and stop-losses activated when the strategy is not behaving favourably.
- Types of positions: these should be more granular than the MTAA ones and ideally expressed in relative terms compared to MTAA and SAA. They can include relative value strategies as well as detailed country, sector or currency positions.
- Size: tactical positions can be more numerous than MTAA ones and their sizes should be limited in order to limit the active allocation’s tracking error.
- Rationale: they are generally based on short-term economic or momentum considerations rather than on valuation or macroeconomic scenario considerations, as is the case for MTAA strategies.
Investors should be clear about the different types of asset allocation over different horizons and base them on different approaches to ensure appropriate portfolio diversification.
Governance of asset allocation choices
Although it is designed for the very long term and is normally validated by the key decision body within the institution – usually the Board of Directors or its equivalent – SAA needs to be reviewed regularly (ie, every few years or in case of changes in the regulatory or liability constraints). The precise pace of revisions depends on whether it is complemented by MTAA, whose objective is precisely to adapt the investor portfolio to economic and financial conditions expected to unfold over the next few years. As far as MTAA is concerned, given its typical time horizon of three to five years, the normal pace of its revisions can be yearly, with the possibility of more frequent reviews (reviewing does not necessarily mean changing), especially in case of a major event that could derail the central scenario which served as a basis for its setting. In such circumstances, investors should make sure that the key assumptions that served as a basis for their investment decision remain valid. They should also be careful to distinguish between those disruptions that could affect the medium-term scenario (e.g., former ECB President Mario Draghi’s “whatever it takes” speech) from short-term events (e.g., interest rate hikes).
In terms of the decision-making process, since MTAA decisions are highly relevant for an institution, they should be validated at the level of a formal investment committee and grounded on serious rationales. As a result, the investment case for such strategies should be reviewed regularly. Clear targets should also be set and possibly revised once met. In order to make sure that sufficient attention is devoted to these strategies, their number should remain limited and they should represent high convictions for the institution.
TAA decisions are more short term-oriented and largely driven by risk appetite and market momentum considerations. As a result, and in order to be reactive to market trends, portfolio managers should handle them within a well-defined active risk budget. In most cases, these decisions are overseen by an investment committee whose main tasks are:
- Checking that these tactical strategies are based on well-articulated grounds; and
- Reviewing their overall contribution to the portfolio excess return and its active risk.
Investors should also ensure that there is a good degree of complementarity between TAA and MTAA or SAA decisions and avoid adding up on the same types of risks over different horizons, looking at the correlation between the returns of active strategies and those of the strategic portfolio. As an illustration, the main risk of a 50-50 equity-bond portfolio is generated by the equity position. Therefore, investors should be aware that if their active allocation decisions consist of taking on more risk relative to this benchmark, such as overweighting equities or overweighting credit within fixed income, active returns and strategic returns would probably be highly correlated.
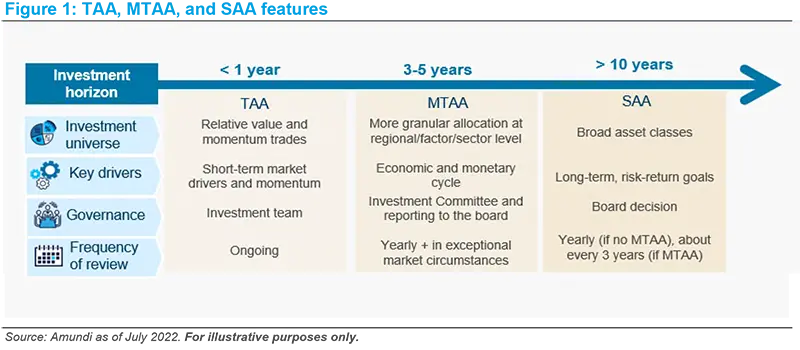
In this respect, it is appropriate to keep MTAA focused on macro-based positions defined on broad asset classes while TAA should rather be related to relative value trades based on market dynamics. Figure 1 summarises the typical features of SAA, MTAA and TAA.
Budgeting risk across horizons
Institutions usually express their risk budgets in terms of expected shortfall, in the form of VaR or preferably CVaR to focus on the left-hand side of the return distribution, and applied to SAA. Regarding MTAA, its risk should also be analysed in terms of VaR or CVaR and its differences with SAA should not lead to a significant change in the risk profile.
Turning to active management leeway, it can be defined in terms of tracking error (of TAA against MTAA or SAA) or of asset-weighting deviations. In the latter case, boundaries typically apply to total equity weightings, portfolio duration range, or maximum currency allocation deviations for the main currencies. There should be consistency in terms of risk generated by setting portfolio weights at the boundaries for different asset classes: a +/-5% leeway for equity positions typically brings the same active risk contribution to a portfolio as a +/-130bps bond duration, according to our own calculations. Institutions should also avoid setting ranges that are too narrow, which would potentially imply very frequent rebalancing, with a risk to conducting too many unwanted moves in periods of high market volatility and increasing transaction costs. Conversely, if ranges are defined too broadly, they can lead to strong deviations from SAA, contrary to the latter’s role as an anchor.
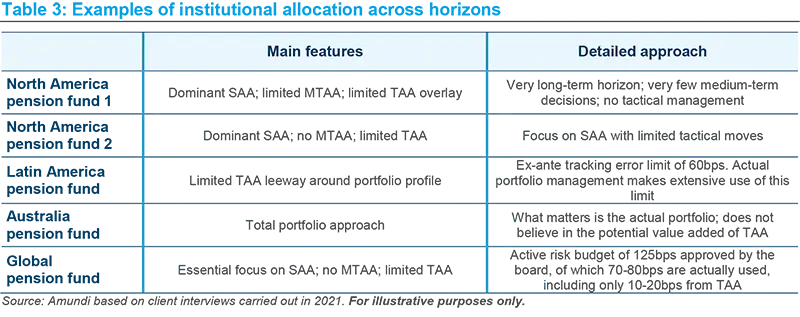
If limits are defined in terms of relative risk, tracking error should be viewed as a target and not a strict limit, and should be analysed over a relatively long period (eg, three to five years as representative of a typical market cycle). Actual tracking error may be above target at certain times, as there are market conditions and types of investor skills that are more favourable than others for excess return generation. According to our observations, the risk budget allowed to TAA by institutional investors is usually limited: the tracking error budget allowed for TAA is often constrained to 150-200bps. Actual tracking error is generally below the target, and some institutions even claim that they do not believe in TAA. Table 3 summarises a few institutional investors’ approaches to risk budgeting across different allocation horizons.
When setting a strategy, the institution should make sure that it can withstand the impact of negative performance from this strategy based on historical drawdowns.
This modest leeway for TAA is logical as, to paraphrase an institution we interviewed, “you do not want to suffer from too much deviation from your strategic benchmark in case things go wrong”. SAA is the most important decision for investors and should be the key driver of their portfolio return while the variability of returns around the long-term trend should remain limited. More precisely, the actual size of the active-to-total risk ratio depends on the institution’s belief in the potential value added of active allocation and its confidence in its capacity to outperform through active allocation decisions. This hinges on the investor’s ability to identify its competitive advantages and concentrate active risk where its resources and track record are meaningful. Then comes the issue of how to define the investment universe of your SAA and how to segment it. This will be the focus of our next article.
Authors