
Summary
The return of inflation is clearly one of the top themes of 2021 and the post-pandemic economic revival. In addition to the temporary effects associated with supply chain bottlenecks (semiconductors, energy, copper, etc.) during a sudden upturn, there is the question of a potential change in the inflation regime. The alignment of monetary and tax policies around the world points to a potential ‘last battle’ to ward off the deflation risks of the previous decade and, in doing so, encourage higher inflation. The ambition of this study is to look at how to adapt equity portfolios in this scenario.1
This structural rise in inflation, if confirmed, harkens back to the period in modern history that spanned the end of World War II to the early 1980s. In reality, we can distinguish between two sub-periods. We have set them apart by naming them after the seasons of spring (1949- 1966) and summer (1966-1982). Each season has strong characteristics, and inflation happens to be one of them.
- Spring (1949-1966) was a period of sustainable growth, with slight but not excessive inflation. As WWII drew to a close, the economy’s productive capacity had to be completely overhauled. Interest rates and wages were at an all-time low. Banks that survived the economic winter had the financial resources to roll out the major innovations of previous years through multiple applications found by their markets (home appliances, automotive, aviation, etc.). A positive spiral took hold (falling unemployment, rising wages). Corporate profits picked up, although margins hit a ceiling. Deflation risk became a thing of the past and inflation risk was moderate.
The world today is similar in many ways: we need to build a low-carbon economy and there are inequalities at play, leading central banks and governments to align their monetary and fiscal policies.2 Similarly, many banks made it through the 2008 financial crisis and their solvency ratios are robust enough to fund new projects centred on climate change, digitisation and biotechnologies. Global competition (especially between the US and China, between historic auto manufacturers and Tesla, etc.) is forcing more and more players to invest just to stay in the race. Ultimately, interest rates, though still very low, are bottoming out.
- Summer (1966-1982) was a period of excess that marked the peak of inflation. Starting in the mid-1960s, new productive capacities were no longer sufficient and wages climbed faster than productivity. A vicious price-wage spiral made price rises the main feature of the period, which ended with a major recession. To be more specific, summer can be broken down into two shorter periods. The 1966-1971 phase ties in with the Vietnam War3, coupled with a tense social climate4 and wage demands backed by powerful unions in a much more industrial, fast-growing economy than the one we have now. 1971 marked the end of the Gold Exchange Standard and the beginning of another sub-period. The steep depreciation of the dollar and two oil shocks sent inflation skyrocketing to new peace-time highs.5
Inflation conditions from the mid-1960s (averaging 4% from 1966 to 1971) were higher than current levels, if we acknowledge the temporary nature of current inflation figures (Amundi estimates: 4.3%, on average, in 2021 in the US, 3.2% in 2022 and 2.7% in 2023). However, the share of wages in value-added, for example, which is currently close to what it was in the early 1950s, is expected to climb and end up having an inflationary impact a few years from now, especially considering politicians and central banks alike are now focused on the matter.
That being the case, we will examine trends in the US equity market, sectors and styles during these two historic economic seasons (spring and summer), and suggest portfolios that would have made sense at the time. Before that, however, we will highlight the mechanisms underlying the equity market’s response to inflation.
1. Inflation has a clear impact on equity valuations and on the correlation between equity and long rates
We have calculated the median level of price/ earnings ratios (PERs) since 1914 and ranked them according to inflation regimes (Figure 1). We note that the highest equilibrium level of the PER occurred when inflation was slightly positive (between 0% and 3%). When inflation got any higher than that, the equilibrium level of the PER declined. From a symmetrical standpoint, deflationary conditions also bring PER levels down. Incidentally, the S&P 500’s PER on 23 March 2020 (the low point for the market during the Covid-19 pandemic) plummeted to 13.7x, indicating deflation risk. The combination of vaccination campaigns, hyper-accommodative monetary policies and very generous budgetary support plans helped wipe out this risk by repositioning the market to align with low-inflation conditions, hence the powerful rebound that followed.
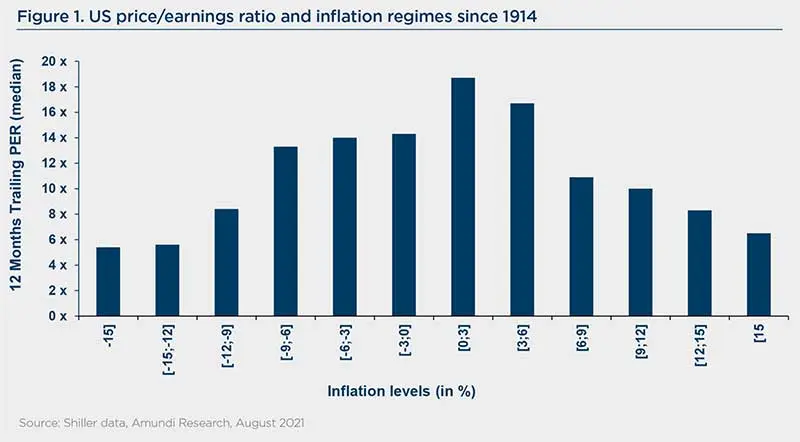
That is why the current debate on inflation is so crucial. If inflation stabilises below 3% by the end of 2022, rising profits should more than offset the likely downturn in PERs over the next 12 to 18 months, paving the way for an ongoing equity bull market. If inflation remains above 3%, however, profit growth will no longer be sufficient and we will be in store for an equity market correction.
Separately, the equity-bond yields correlation (Figure 2) reversed (from negative to positive) once the internet bubble burst; earlier, however, interest rate cuts were all it took to send equities climbing. In a period we will call autumn (1982- 2000), interest rates and inflation declines were structural, having started from a very high level. The 2000 stock market crash marked the transition from autumn to an economic winter (2000-2020?). The breaking point was at about 4-5% in the US 10y bond yield. At that point, the risk was more about deflation than inflation. The 2008 Great Financial Crisis strengthened this perception, and the equity-bond yield correlation has remained positive until now.
We logically expect the phenomenon to once again reverse for an extended period once we cross that same 4-5% threshold, but this time on an uptrend. It is worth remembering what happened in the mid-1960s, on the eve of the economic summer. Furthermore, we cannot rule out that – by way of anticipation – the threshold level for US 10y yields, which may change the market’s perception (from deflation risks to inflation risk), will be a little lower this time around. In our view, however, interest rate levels are still too far from that level for a correlation reversal (from positive to negative) to stick around.

To conclude on the inflation effect on valuation and correlation, we believe that a moderate recovery of inflation would be relatively positive for equities. The shift from deflation risk to a low-inflation environment is extremely supportive for equities. And it will remain supportive if inflation manages to stay below roughly 3%, as was the case during the economic spring (1949-1966).
The higher inflation climbs above that point, however, the worse the impact on equities, primarily for four reasons: (1) a negative impact on corporate margins. Companies are no longer able to pass on higher input costs to consumers; (2) significantly tighter monetary policies, which are necessary to break the inflation spiral but sharply increase the probability of a major recession; (3) uncertainties preventing firms from planning investments or conducting mergers and acquisitions; and (4) the increase in the discount rate weighs on equity valuations, particularly for long-duration stocks (growth stocks). These conditions are reminiscent of the aforementioned economic summer (1966- 1982).
2. Equity trends during a standard short cycle
Each long cycle6 spans four economic seasons (Figure 2), each lasting 10 to 20 years, and each economic season, in turn, includes multiple short cycles that are logically impacted by their position in the long cycle. We highlight sector trends during a standard short cycle (Figure 3), based on our average observations since 19497, and then show how this average is distorted by moderate or strong inflation conditions (spring or summer, respectively).
Economic growth tends to fluctuate around a trend that embodies its potential. When growth exceeds this potential, it becomes more inflationary and central banks tighten their monetary policies (Phase ii) until their interest rates (or balance sheet sizes) are stable at a plateau (Phase iii). Economic growth ends up slowing and correcting (Phase iv), more or less abruptly. Equities begin climbing again in anticipation of the low point in the economic cycle (Phase i).
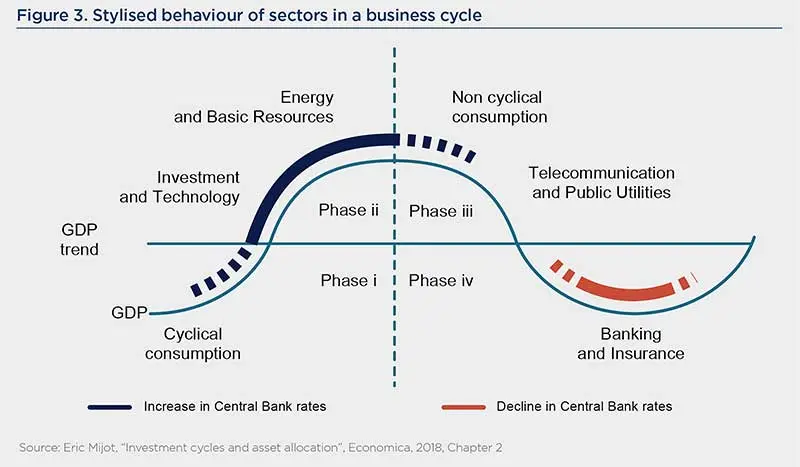
From a sector standpoint, the first two phases are supportive of cyclical stocks. The beginning of the cycle (Phase i) is supportive of financials and consumer cyclicals; the upcoming economic recovery improves the cost of risk for banks, while consumers enjoy very low rates on loans to buy durable goods. Once demand has well and truly picked up again, and economic growth rises above its potential (Phase ii), businesses have an incentive to invest, especially with profits climbing, which instils confidence and reduces volatility. Corporate margins initially absorb price rises, until they get to a point where they can no longer do so. Commodity-related sectors, positioned early in the value-added chain, take the lead in terms of performance.
However, the next two phases are more supportive of defensive stocks. Phase iii takes place at the climax of the economic cycle. Central banks stop tightening their monetary policies for fear of going too far and triggering a recession. Performance gaps between risk and non-risk assets shrink considerably. This ‘wait-and-see’ phase allows defensive stocks to gradually return to the forefront. It can also temporarily set the stage for a bubble to form, but always ends up giving way to a cyclical correction. Phase iv is when that correction happens, driving defensive sectors, especially those most exposed to accelerating interest rate cuts (utilities, telecoms).
This cyclical behaviour that we have just described is influenced by inflation conditions, central bank responses and interest rate trends.
Spring, a season of low inflation, ticks all the boxes for this standard cycle. After a Phase i rebound, equities benefit substantially from Phase ii even though inflation picks up, because inflation remains moderate. Stock markets rally despite higher interest rates, meaning that equities and interest rates are positively correlated. Profit growth more than offsets any PER declines. Consequently, moderate inflation is supportive of cyclical stocks, which take full advantage of profit growth.
Summer, a very high inflation period, sees central banks respond more actively to inflation risks, to the point of bringing down equity markets that no longer benefit from Phase ii, meaning that equities and interest rates are negatively correlated. Rising inflation also weighs heavily on PER levels, with profits no longer strong enough to offset this impact. In such a case, economic cycles are deprived of an expansion phase and transition prematurely to the defensive phase.
We think we are currently in the spring season, with expectations of moderate inflation, rising rates (non-linear) and the equity bond yields correlation remaining broadly positive. However, every cycle has its own peculiarities. The key factors to monitor here are the spread of the Covid-19 variants and the supposed temporary nature of inflation, which will decide whether companies are able to preserve margins and grow earnings.
3. Observation of equity market trends during spring (1949-1966)
During spring, consumer prices fluctuated (Figure 4, LHS), largely spurred on by the Korean War (1950-1953), but stayed below 3% most of the time. The only time Fed rates rose above 4% was in 1966. Long rates furtively topped 4% once at the peak of the short cycle in the late 1950s. That said, it’s important to bear in mind that although long rates hit a ceiling of 2.5% in 1942 during the bid to fund the war effort, this limit was lifted with the 1951 Treasury-Fed Accord. It would take five years from the end of this restriction for them to reach 3% (July 1956) and eight years to hit 4% (April 1959).
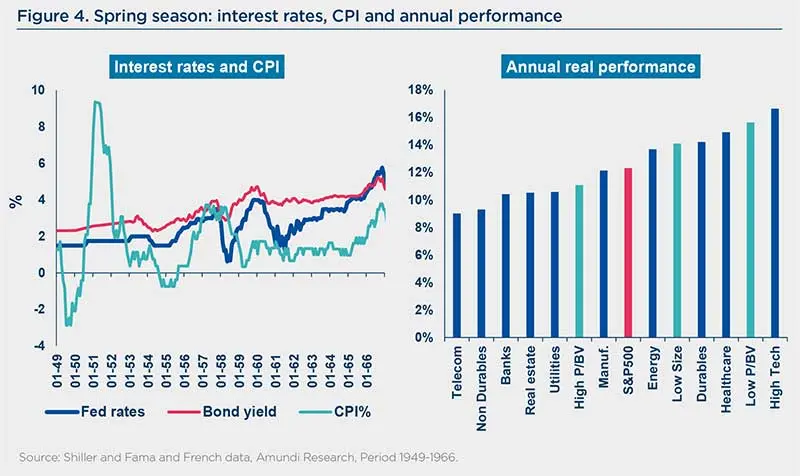
Over the period, the S&P 500 more than protected purchasing power (Figure 4, RHS), recording an average annual performance of 12%.8 Cyclical sectors (technology, durable goods, energy, manufacturing goods) outperformed, or at the very least matched the market, unlike most defensive sectors (telecoms, non-durable goods, utilities). The one outlier was healthcare, usually on the defensive side, which also outperformed. In terms of styles, value and small caps were at the top of the class.
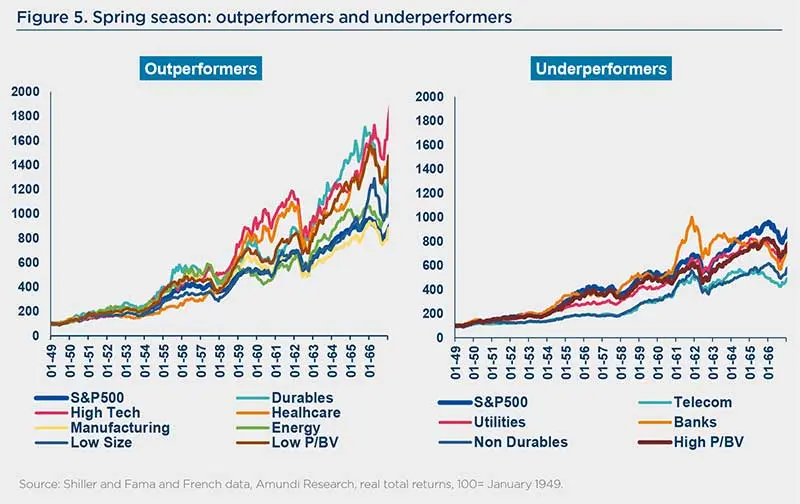
Looking at Figure 5, we can see that expansion phases are longer than contraction phases in each short cycle. Indeed, when the Fed raises its rates, the cycle is not interrupted because inflation risk is contained. This lines up perfectly with our earlier description of Phase ii, which is the most fundamental phase in the cycle, with equity prices driven above all by corporate profits. This phase is, of course, pro-cyclical, which is why cyclical stocks tend to outperform throughout this economic season.
As per Figure 6, the average risk-reward ratio on the S&P 500 over spring comes out to the upper right of a cluster of points stemming from a random draw, whereas an equallyweighted portfolio would sit to the lower left of this cluster. In spring, an index strategy linked to the S&P 500 is therefore, on average, already a good solution for an investor. That said, it would also be possible to do even better by holding a portfolio (cyclicals + value targeted portfolio) assigning equal weights to the cyclical9 and healthcare sectors, as well as the value style, all of which outperformed, on average, over the period. The resulting portfolio would outperform the S&P 500 by an additional 2% annually, without adversely affecting volatility.
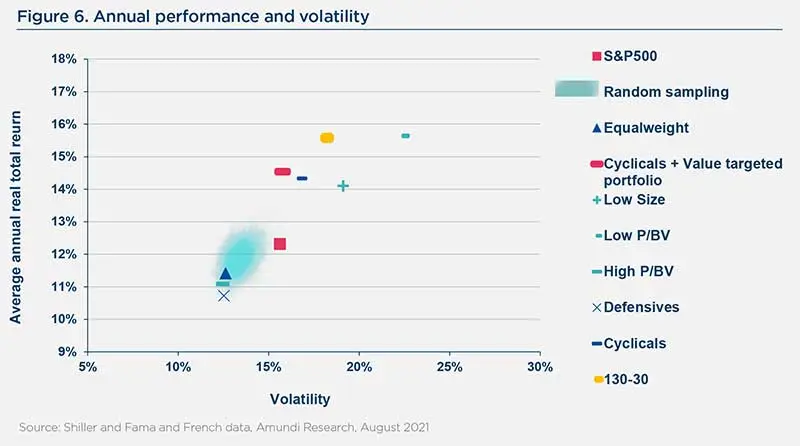
As spring is an equity-supportive economic season, and thus conducive to greater risktaking, we could even aim to further improve this performance, at the cost of a slightly less favourable risk-reward ratio. For example, it might be a good idea to build a 130-30 portfolio, overweighting these same components and shorting defensive sectors (non-durable goods, telecoms and utilities), thus adding another 1% to the annual performance while raising volatility only marginally.
4. Observation of equity market trends during summer (1966-1982)
Consumer prices fluctuated over short cycles, but this time mainly stayed above 3% (Figure 7, LHS). Fed and long rates topped 4% over the entire period.
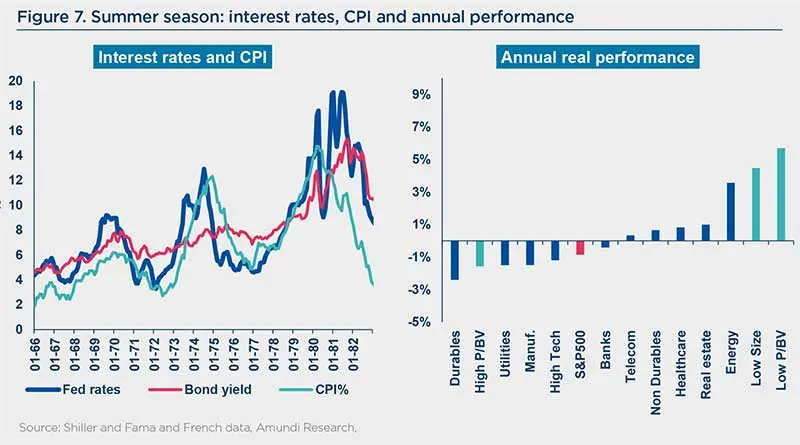
The S&P 500 was no longer able to protect purchasing power (Figure 7, RHS), recording a slightly negative average annual performance. Defensive sectors (healthcare, non-durable goods, telecoms) outperformed marginally. Real estate and energy outperformed more significantly, but at a cost of very high volatility. Real estate primarily came out on top early in the first short cycle, pointing to a fairly conventional overheating cycle. Not surprisingly, energy outperformed, predominantly during the oil shocks. On the style front, value and small caps came out ahead.
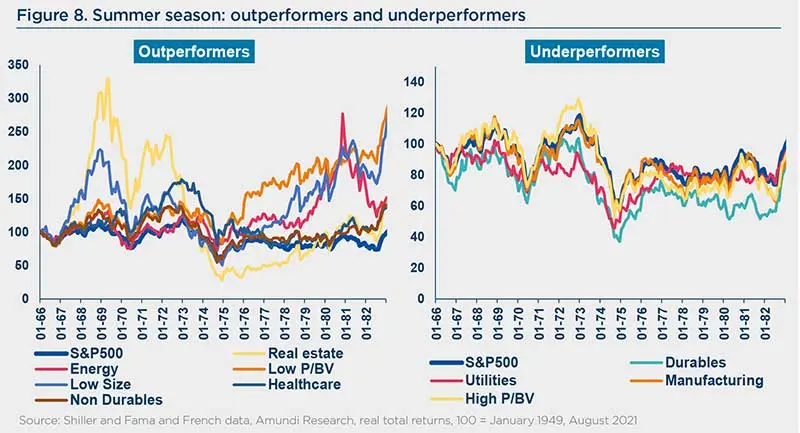
In actuality, expansion and contraction phases during short cycles (Figure 8) are more balanced in terms of time, and correction phases are, on average, even more powerful than expansion phases. Indeed, when the Fed raises its rates, the cycle is interrupted because inflation risk in this case is strong, if not very strong. The pro-cyclical Phase ii is thus short-circuited and prematurely gives way to the subsequent defensive phases. Accordingly, it is logical for defensive sectors to outperform when you run the numbers for the period as a whole from 1966 to 1982. Small caps, which always disproportionately benefit from Phase i, still do fairly well. The value style also holds up well, unlike long-duration stocks (growth stocks), which are hurt by rising interest rates.
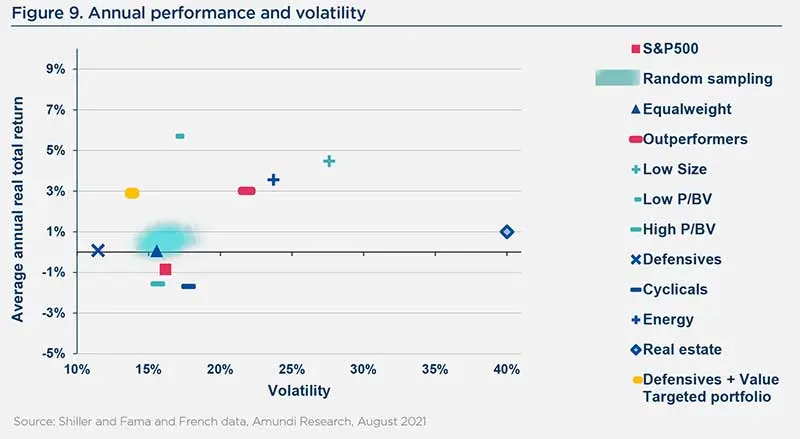
The average risk-reward ratio on the S&P 500 over this entire period (Figure 9) comes out below the cluster of points stemming from a random draw and just below the equally-weighted portfolio on our chart. Consequently, an index strategy linked to the S&P 500 is not an optimum one in summer.
Equally weighting winning sectors over the period (outperformers such as energy, non-durable goods, real estate, small caps and value style) already significantly improves performance (+3% per year above inflation), while at the same time raising volatility. However, a portfolio that equally weights defensives (healthcare, non-durable goods, telecoms and utilities) sharply reduces volatility but lowers performance, to align with inflation. Lastly, the value style does very well, with a performance of about 6% above inflation and volatility that is on par with the S&P 500 but higher than equally-weighted defensives.
Unlike spring, summer is not conducive for equities and is a season for keeping risk under control. Equally weighting the value style and a set of defensive sectors (defensives + value targeted portfolio) is an ideal portfolio in this scenario, generating the same performance as a ‘winning sector’ portfolio (outperformers), while also reducing volatility to below that of the S&P 500.
5. Conclusion
Moderate inflation (positive but less than 3%) is supportive of equities because tighter monetary policies are more than offset by higher profits, and the pressure on corporate margins is more than offset by improved revenues. Expansion phases are longer and keep cyclical sectors outperforming longer. A portfolio made up of cyclical sectors and the value style logically outperforms the S&P 500, on average, over the period.
On the other hand, with inflation persistently above 3%, equities are unable to preserve purchasing power. Tighter monetary policies bring equity markets down, preventing them from capturing the most fundamental part of the cycle. Higher profits no longer offset interest rate and inflation rises, which adversely affects the equilibrium level of PERs. All in all, the cycle is much more balanced between upside and downside phases, and is even biased on the downside. Real estate and energy react very positively in an upside phase, but their volatility means that the exit timing has to be well managed to come out ahead. Defensive sectors are much less volatile over the long term. Because this economic season (summer) above all calls for solid risk management, combining the value style with defensive sectors is an attractive solution to preserve purchasing power, with less risk than an S&P 500-linked index strategy.
The current positioning of the markets, and particularly of sector trends, is consistent with Phase ii of a short cycle. Year to date, profits have taken over for PERs in driving the equity markets. The debate on the impact of inflation is thus becoming a key issue. If the spring logic prevails with a positive-yet-moderate inflation environment, the expansionary phase of the cycle may last, driven also by investment. The implementation of infrastructure plans (in the US, Europe and Asia) could be expected to fuel this globally pro-cyclical narrative.
However, other options are still possible, including a higher-risk option in which inflation hovers for too long above 3% for the markets and potentially puts the Fed in a difficult position in terms of credibility, causing PERs to fall without profits being able to take up the slack, especially if global infrastructure plans are late in getting started. This risk scenario would have all the hallmarks of a premature summer.
_______________________________
1 This study, focused on the equity markets and specifically the US equity market, is an extension of the research we published in 2018. Eric Mijot, “Investment cycles and asset allocation”, Economica, 2018.
2 As opposed, for example, to Donald Trump’s 2016 tax stimulus plan, offset by a Fed rate hike.
3 US military intervention in Vietnam from 1965 to 1973.
4 President Johnson implemented his “Great Society” programme, echoing Roosevelt’s “New Deal” from the 1930s. Social movements became a global phenomenon (May 1968 in France, for example).
5 Double-digit inflation in the US from February 1974 to April 1975 and from March 1979 to October 1981.
6 We can identify four long cycles since the beginning of the industrial era: 1783-1842, 1842-1896, 1896-1949 and 1949-2020?
7 Eric Mijot, “Investment cycles and asset allocation”, Economica, 2018, Chapter 2
8 Calculated using an annual average (calendar year).
9 In the conventional order of a cycle: consumer durables, technology, industry, energy.
Authors