
Summary
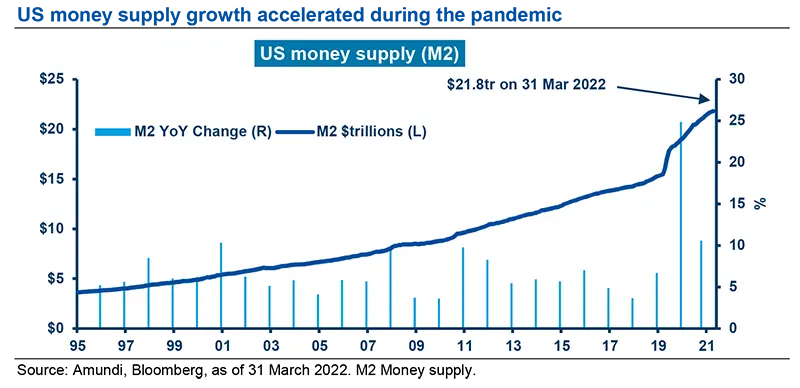
Forty years, that’s how long it has been since The Great Inflation, which lasted from 1965 to 1982 and saw inflation in the US climb as high as 13.5%. According to Michael Bryan of the Federal Reserve Bank of Atlanta, it was the “defining macroeconomic event of the second half of the twentieth century… there were four economic recessions, two severe energy shortages, and the unprecedented implementation of wage and price controls”. We believe the origins of the Great Inflation were Federal Reserve policies that, similar to those of today, supported excessive growth in the money supply.
Inflation is likely to remain above the Federal Reserve Bank’s target
Economists’ forecasts of inflation (charts below) have been above the Fed’s stated target, and when coupled with actual numbers, they suggest sustained inflation over the medium term.
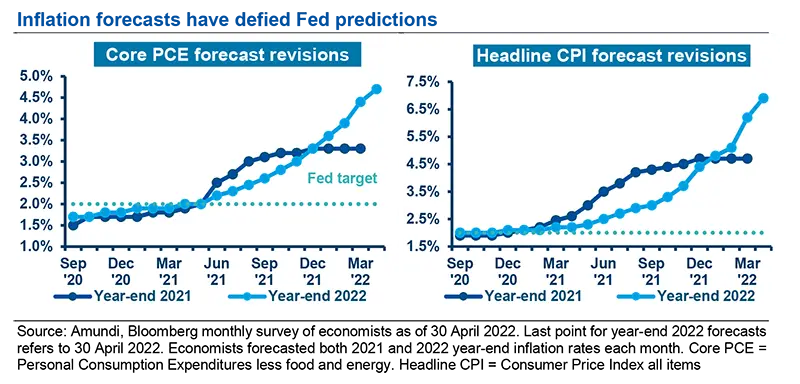
We believe inflation may remain above the Fed’s stated target of 2% for three reasons:
- The US has a labour shortage. A sharp rebound in economic growth, combined with an ageing population and the early retirements taken during the pandemic, have limited the availability of labour. As a result, wages rose 4% last year, the highest increase in two decades.
- There is a renewed global focus on energy security, food security and defence due to the Russia-Ukraine conflict. Germany, for example, announced it would speed up the construction of liquefied natural gas (LNG) terminals to lessen its dependence on Russian natural gas, as well as increase defence spending to 2% of GDP, as per its NATO obligation. Food and fertiliser prices are at all-time highs (source: Bloomberg).
- China is no longer exporting deflation. For years China has been a source of lowcost goods, accounting for 18.6% of US imports in 2020, according to the Office of the US Trade Representative. Due to low birth rates, however, China’s working-age population has peaked, according to Business Insider. We believe that the declining labour force will result in higher export prices to the US. Economic and political tensions may also contribute to a reshoring of manufacturing to North America, potentially adding to the US labour shortage.

There are structural reasons to believe inflation may persist.
Investment implications: fundamentals and valuation come into focus
If inflation persists, and we think it will, the types of stocks that are likely to do well are unlikely to be the ones that have performed well in recent years. We suggest the following path forward in equities:
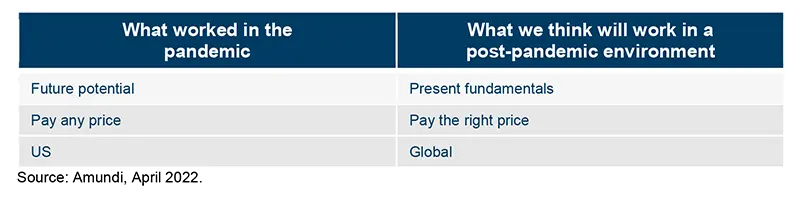
1. From the future to the present
In the first year of the pandemic, the Goldman Sachs Non-Profitable Technology Index quintupled1. Certain social networking companies soared, as people connected largely through social media in a stay-at-home environment. Investors were willing to look past near-term fundamentals (a lack of meaningful revenue or earnings) to future potential. Interest rates plummeted, further supporting gains in long duration assets, which benefitted from a low cost of capital.
What a difference a year makes. An economic recovery, coupled with sharply higher interest rates, has made shorter duration stocks (companies earning money) more attractive and longer duration assets something to avoid (see the decline in the index below in 2022). In this environment, we believe investors could reward companies based more on their current fundamentals rather than on their earnings potential in the distant future.
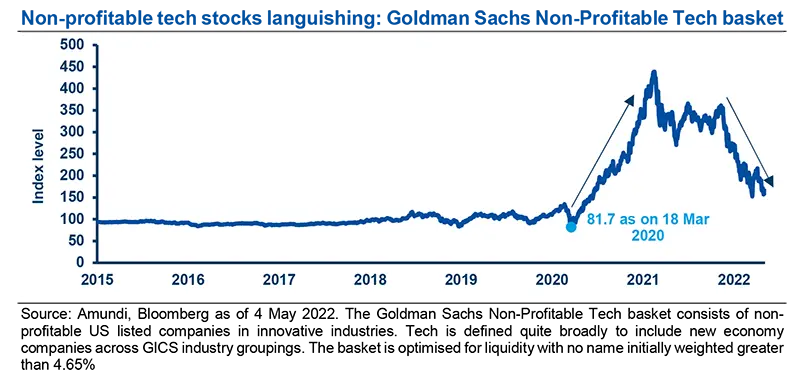
Non-profitable tech stocks are under siege as interest rates rise.
2. From paying any price to paying the right price
As shown below, the highest annualised returns in the S&P 500 for the five-year period ended 31 December 2021 were the stocks in the most expensive P/E quintile (22x P/E and higher). Year-to-date to 3 June, the most expensive P/E quintile stocks have been the worst performers, returning -21.61%. The best performing stocks YTD have been those in the least expensive quintile, which returned 7.09%.
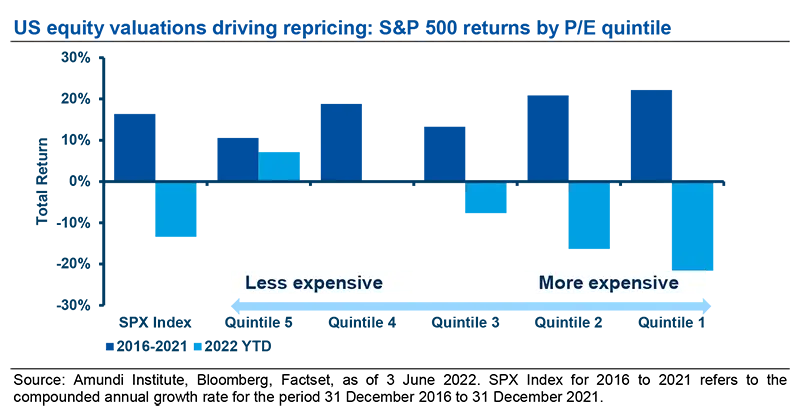
Cheaper stocks have outperformed so far in 2022, reversing a five-year trend.
Value may continue to outperform growth
If investors continue to favour stocks with lower valuations – and we believe they will in a higher interest rate environment – value may continue to outperform growth. As shown below, value stocks currently trade at a higher-than-average price/earnings multiple discount to growth stocks. We believe this discount will narrow.
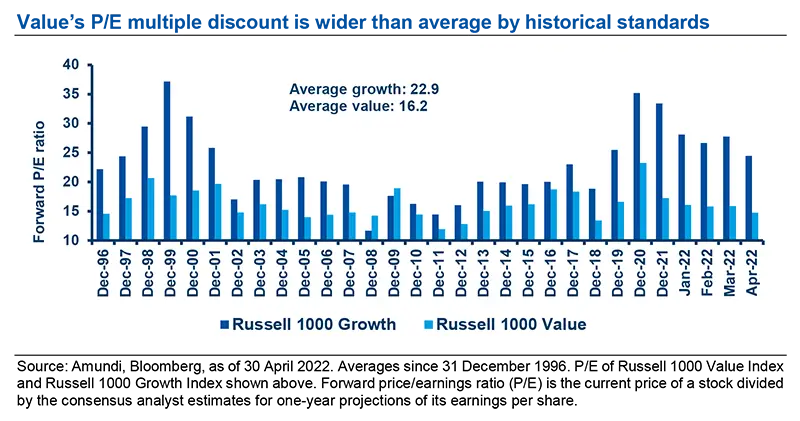
Value stocks trade at a wider-than-normal discount to growth.
3. Concentration risks underscore the need for active management: S&P 500’s recent performance is concentrated in a handful of stocks
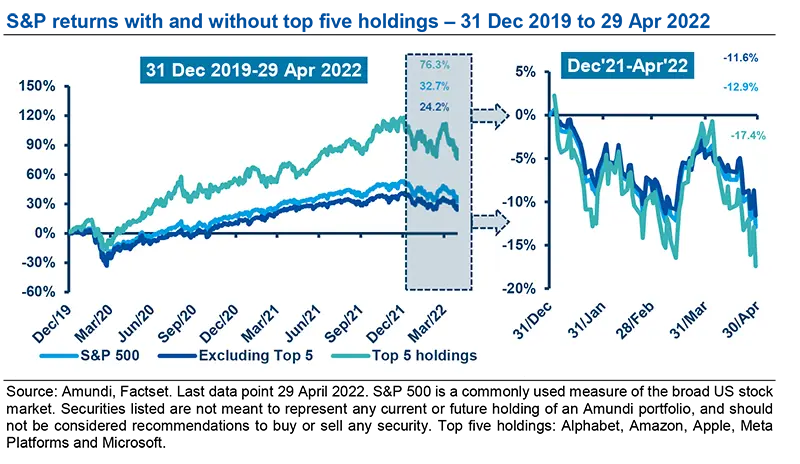
The stay-at-home environment during the pandemic favoured mega-cap technology-related companies, which benefitted from an increase in online purchases and the use of technology. As of year-end 2021, the largest five stocks represented 23% of the S&P 500 Index, which is the highest level of index concentration ever.
The relative performance of these five stocks in 2022, however, has begun to wane. We believe this trend will continue in the coming years as growth for the largest companies matures, regulation increases and investors look elsewhere for returns. Active managers that are underweight the largest stocks in their indices should benefit from this trend. For historical context, the last time the concentration in the S&P 500 Index fell precipitously was after the dot.com bubble burst. The percentage of active managers that outperformed from 2000-2002 was above 60% each year. We believe the next few years may follow a similar pattern, making it perhaps the best time to invest with active managers in more than 15 years.
4. From US to Global
For years, US stock market returns have largely dominated global stock market returns, but this dominance has come with a progressively higher price tag. As of the beginning of May 2022, US equities, as measured by the forward price/earnings ratio of the S&P 500, traded at a 40% premium to international equities (18.2x earnings vs.13.0x earnings, respectively).
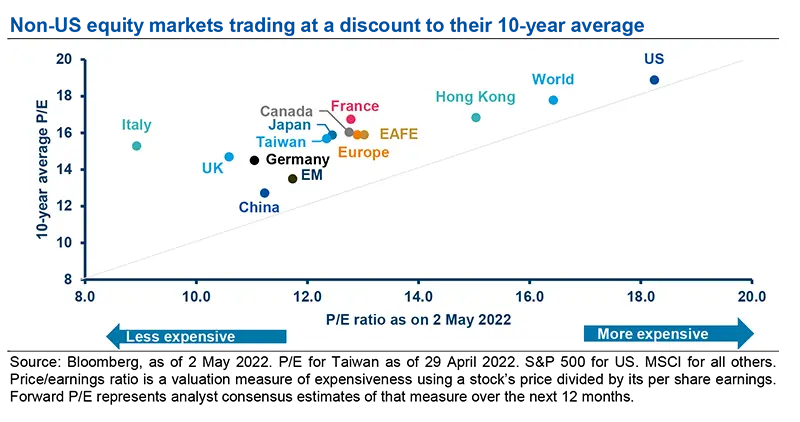
Regional markets outside the US are trading below their long-term P/E averages.
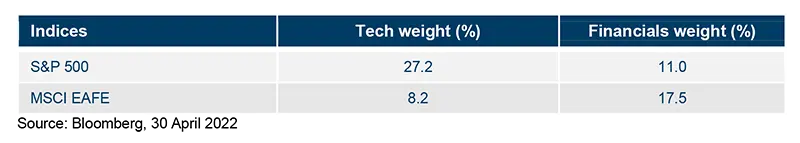
While most non-US countries are trading below their long-term P/E averages, the US is currently very close to its 10-year historical average. In addition to the stark valuation difference between US and non-US markets, there is another potential catalyst for non-US stocks to outperform. The catalyst could be a continuation of the style rotation from growth to value, driven by sustained inflation and higher interest rates. If these conditions persist, the composition of international indices (see table) – which are more heavily weighted towards value sectors such as financials and less towards growth sectors such as information technology – may help them outpace US markets. Maintaining significant exposure to US markets is critical, however, in our view given the relative stability of US earnings streams during periods of economic stress.
Conclusion
We believe inflation will remain above the Fed’s target rate of 2% due to commodity and labour shortages, causing interest rates to remain higher than they have been in recent years. The change in the economic landscape from a non-inflationary to an inflationary one should continue to favour reasonably valued equities of companies that can sustain profitability despite rising input costs. An active approach could help to navigate this environment by seeking the stocks where the risk-reward may be more favourable.
_____________
1 18 March 2020 to 12 February 2021.
Definitions
- Basis points: One basis point is a unit of measure equal to one one-hundredth of one percentage point (0.01%).
- Duration measures a bond's or fixed income portfolio's price sensitivity to interest rate changes.
- Goldman Sachs Non-Profitable Technology Index consists of non-profitable U.S. listed companies in innovative industries.
- MSCI EAFE Index includes Australia, Austria, Belgium, Denmark, Finland, France, Germany, Hong Kong, Ireland, Israel, Italy, Japan, the Netherlands, New Zealand, Norway, Portugal, Singapore, Spain, Sweden, Switzerland and the UK.
- Weighted average cost of capital: It represents a firm's average cost of capital from all sources (common stock, preferred stock, bonds, and other forms of debt). It is a common way to determine required rate of return because it depicts the return that bondholders and shareholders demand.
Authors