
Summary
- Amundi’s 2024 Capital Market Assumptions outlines attractive risk/return profiles for real and alternative assets and confirms the additional performance of these assets versus listed ones, linked to their remuneration for their liquidity risk exposure.
- Over the next 10 years, portfolio expected returns decrease slightly compared to last year for all investor profiles, as the returns of the investment universe are on average revised down. The strategic asset allocation will have to be even more diversified to cope with higher expected volatility in risky assets.
- Real and alternative assets are attractive as they help enhance portfolio risk-adjusted returns. Investors will have to carefully calibrate their liquidity profile. Investors could consider a building block dedicated to Real and alternative assets, separate from the rest of their liquid assets.
Our 2024 CMA outlines the general attractiveness of real and alternative assets compared to listed assets and confirms good opportunities in terms of risk/return profiles. The attractiveness of these assets is linked to the remuneration for the liquidity risk exposure.
- Hedge Funds maintain their role of diversifier in the portfolio showing interesting returns associated with moderate risk.
- Infrastructure is mainly supported by public equity returns and inflation trends.
- Private Debt could benefit from its floating rate profile showing a superior risk-return trade-off.
- Private Equity is confirmed as the asset to look at in the search for more appealing returns even if higher yields could limit return prospects.
- Real Estate could suffer due to expensive valuations and physical risks, even if the expected asset income and rental growth are in line with historical averages.
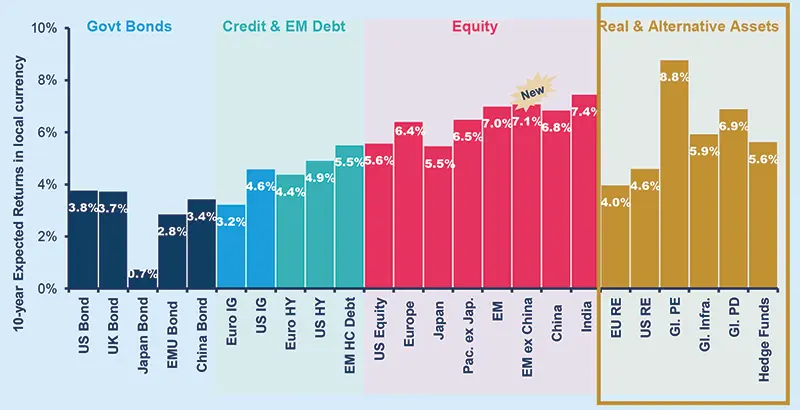
10-year expected returns –Real and Alternative Assets in focus
|
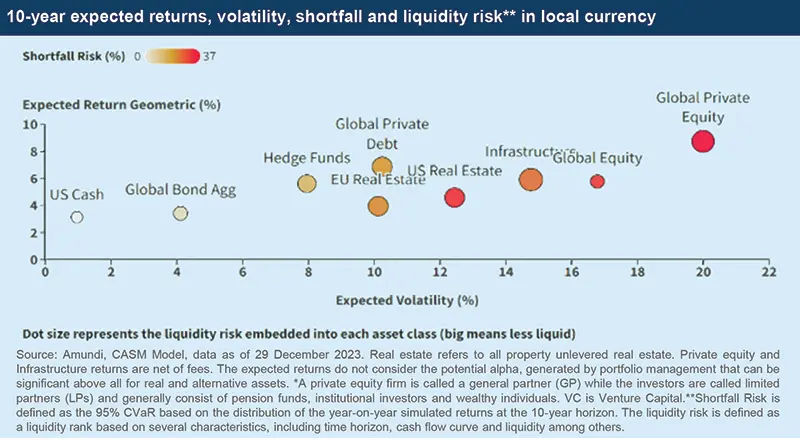
Private Debt and Hedge Funds are among the top diversifiers |
Around 20% is the optimal allocation to real and alternative assets |
|
|---|---|---|
| Rising star asset classes for their favourable risk-return profile and diversification appeal will include Hedge Funds and Private Debt. | Lower expected equity returns will be a challenge for the traditional 60% equity -40% bond allocation. Investors will have to add intod Real Assets to seek returns in the 6% range. |

Real and alternative asset class assumptions
Private Equity is confirmed as the asset to look at in the search for more appealing returns. The higher cost of capital, compared to previous decades could represent an issue for some Private Equity GPs*. In fact, it makes the use of leverage less appealing and forces GPs to focus more on cost rationalisation and margin expansion, making selection in Private Equity even more important than in the past. Strategies that employ high debt levels could have a hard time finding the desired returns compared to Growth and VC strategies. Among the megatrends affecting the asset class there is the use of Artificial Intelligence which could represent a tailwind for both LPs and GPs in screening opportunities, reducing due diligence costs, and generating efficiencies within portfolio companies. Overall, our 10-year expected returns for the Global Private Equity aggregate, mainly represented by Buyout strategies, are reduced due to lower prospects for public equities and to the lower expected value add from these strategies.
Infrastructure returns are mainly driven by public equity returns and inflation trends. However, as shown previously, the former are expected to be below historical norms mainly as a consequence of high starting valuations. And given we expect inflation to remain slightly above CB targets on average, Infrastructure should benefit from indexation mechanisms typical of their contract structure. Physical risk may represent an important factor affecting future returns. On the one hand, extreme climate events with increasing frequency could generate material losses. On the other, significant Capex aimed at climate mitigation and adaptation will be beneficial for the Infrastructure asset outlook.
Hedge Funds’ expected returns model is based on premia on top of a cash contribution. We do not model any alpha contribution (which is unpredictable over the long run) and returns are gross of fees. Cash rates, which have become a key variable for hedge funds, are expected to be little changed compared to last year’s forecasts. The change in hedge funds’ long-term return expectations thus mostly reflects lower expected returns from equity and credit. Hedge funds are still expected to deliver a risk/return profile similar to that of fixed income assets.
Private Debt remains attractive and its risk-adjusted profile stands out when compared to liquid fixed income investments and moderate-risk assets. Our estimates of the illiquidity premium are now in line with the long-term average level. The asset class can benefit from its floating rate structure and an environment of generally high interest rates. assets. Notwithstanding the positive return premium captured by the more illiquid portfolio, every investor must carefully calibrate their respective preferences in terms of the liquidity of assets, cash flow stru
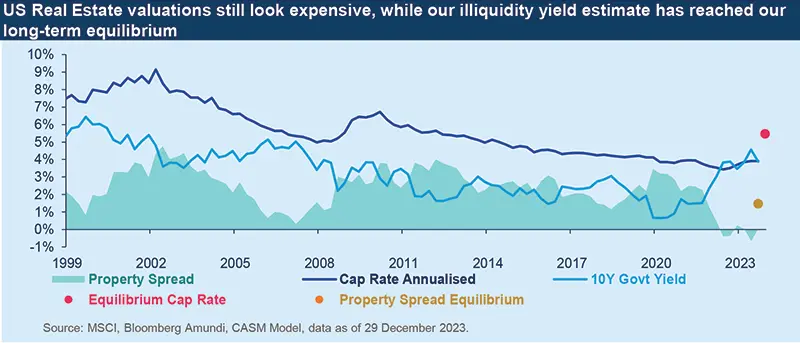
The model for Real Estate is enhanced to account for valuations and fundamental data about properties held in professionally managed portfolios. The purpose of our new approach is being able to establish relationships between Real Estate fundamental value drivers and macro/financial variables.
Based on the latest available information, the US all properties aggregate valuation is currently not attractive as the property spread is significantly below our equilibrium level. In Europe, valuations are still somewhat expensive, however, less so than for the US market. Rental growth staying in line with equilibrium levels and net income reverting to long-term targets are not enough to offset these current expensive valuations, especially in the US. Hence, unlevered Real Estate assets are expected to deliver a return slightly above 4%, below last year’s forecasts and close to high grade corporate bonds. However, we expect levered real estate returns to be marginally better, as leverage is not an attractive option at the moment due to the high cost of debt.
Real Estate Model – Methodology
Real Estate is challenged by expensive valuations, even if the asset class’s expected income and rental growth are in line with historical averages
Our new approach breaks down the asset class total return into building blocks – as we do for other assets – where income, growth and valuation represent the most important ones. The most relevant fundamentals are property rents, capital expenditure (Capex) and the capitalisation rate (cap rate), which is the most common return on investment measure for Real Estate assets*. While future rental growth can relate reasonably well to inflation and economic expansion (i.e., nominal GDP), the cap rate evolution is more challenging to estimate. This rate can also be thought of as a risk premium once it is compared to the 10-year government bond yield to derive the property spread. The lower this spread is relative to an assumed equilibrium level, the higher the current asset class valuation. A similar approach can be applied to equity markets with the well-known Fed Model.
The property spread in equilibrium is derived from our expectations about future corporate spreads and equity returns. The rationale for including corporate spreads in the property valuation model is to link real estate valuations to credit line access for property buyers. While the inclusion of equity capital market movements allows us to capture the positive link between equity prices and property values, which in turn should make property spreads narrower. Combining our interest rate expectations with the property spread, we calculate the equilibrium cap rate.
In addition to estimating growth and valuation return components, we take property income into account, proxied by operating income adjusted for Capex and physical risks as well. The latter will inevitably affect properties even more in the long term due to the increased frequency of extreme climate events.
* Capitalisation rate (or cap rate) is expressed as net operating income divided by the property value, where net operating income is represented by the difference between rental income and the costs for managing the property itself (Opex) and the taxes.
Strategic asset allocation for moderate and dynamic risk investors profiles
In this article, we present the annual update of the strategic asset allocation (SAA) exercise over a 10-year horizon. The global investment universe is unchanged versus last year, it includes fixed income, equity, and real and alternative assets. We assess the SAA from the perspective of US dollar and euro investors. For each base currency, we consider two risk profiles: moderate (around 6% volatility) and dynamic (around 12% volatility). We also consider an illiquidity tolerance which penalises real and alternative assets relative to public ones, in accordance with investor preference.
Before going through the results of the SAA update, it is worth remarking that, as a consequence of broadly lower expected returns across the universe, our CMA line has partially shifted lower. This explains the reduction of our SAA long-term return prospects for the investor types considered.
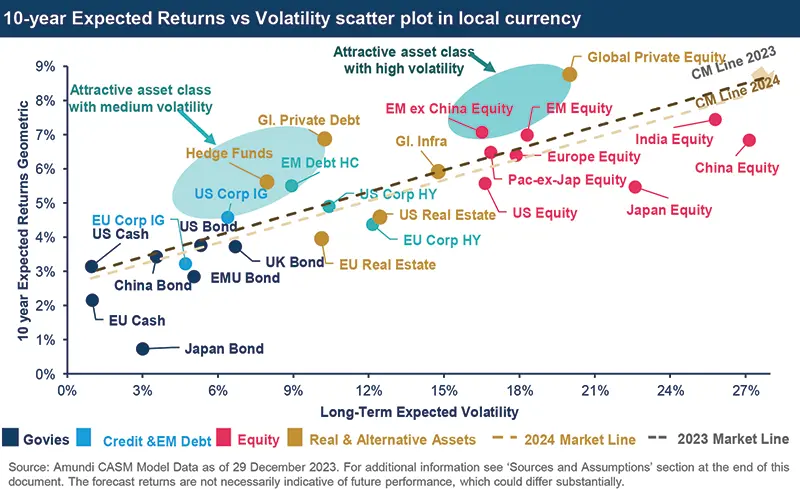
Capital market line: a downwards shift versus last year
Compared to last year, the 2024 capital market line (based on our full asset class coverage including real and alternative assets and EM equity regional markets) has shifted downwards on average and slightly flattened.
Cash and government assets remain a stable anchor to the risk-return trade-off, with Investment Grade credit assets (mostly in the United States), Hedge Funds, Emerging Market Bonds (EMBI) and Global Private Debt offering attractive returns with a commensurate risk profile. Expectations for High
Yield (HY) assets are less favourable from a risk-return perspective versus Investment Grade (IG) assets as well as Real Estate.
Within risky assets, Global Private Equity, EM equity and EM ex China equity stand out as the ones with the most appealing risk-return profile. Whereas, China and Japan equity appear less appealing on a risk-return basis as they lie below the market line. We also note that a diversified approach to EM (or EM ex China) investing is preferable rather than investing in a single country where volatility is much higher.
Strategic asset allocation for a EURO-BASED INVESTOR
Alternative assets will be key to enhancing portfolio risk-adjusted returns.
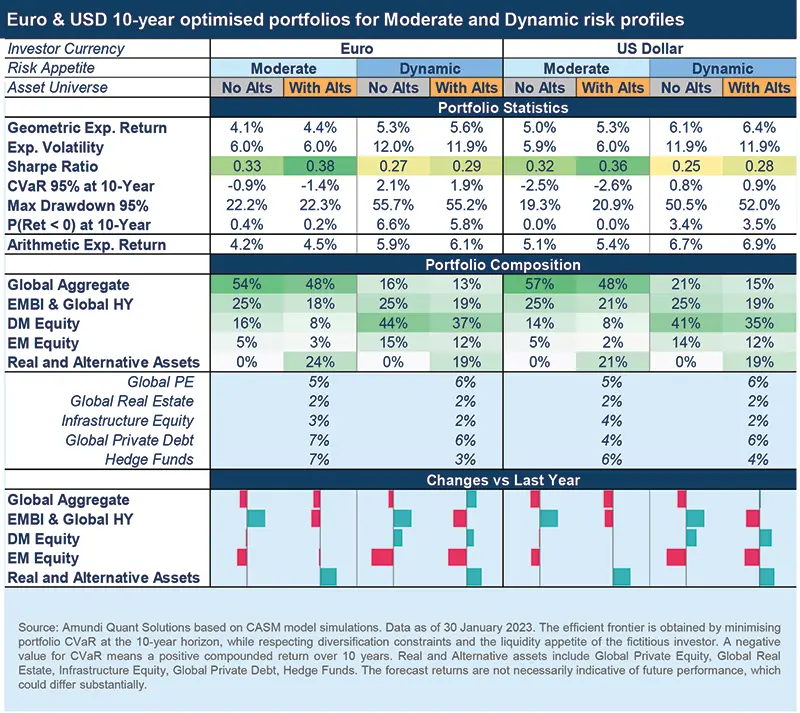
A moderate risk profile for euro investors exhibits an expected return of 4.1% which rises to 4.4% when allowing for investments in real and alternative assets. The most important pillar of the SAA remains the global aggregate space (45-55%), reaffirming the importance of exposure to IG credit and government bonds for investors with a mild risk appetite. The remaining wealth can be distributed across Emerging Market bonds and Global High Yield (around 25% of the portfolio), for which the allocation increases significantly compared to last year’s optimisation. The remaining allocation goes to equities (around 20%, if real assets are not included) with a preference for Developed Markets.
For investors willing to accept some illiquidity risk, a diversified basket of real and alternative assets can partly replace the equity and global aggregate allocations. The addition of these assets improves the portfolio’s expected Sharpe Ratio and marginally reduces the shortfall risk. Within alternatives, Hedge Funds and Private Debt look more attractive compared to Infra, Real Estate and Private Equity for a moderate risk profile allocation.
Moving to a more aggressive risk profile, we see return expectations increasing by around 100 bps, ranging between 5.3% and 5.6%. As expected, exposure to high-quality fixed-income assets decreases significantly compared to the more conservative allocation, in favour of a higher allocation to equities to capture growth opportunities. For this dynamic profile, Private Equity and debt get the lion’s share within alternatives.
Within real and alternative assets, Hedge Funds and Private Debt are favoured for moderate risk profile investors and Private Equity for investors with a dynamic risk profile.
It is interesting to note that the allocation to alternatives is lower for a euro dynamic risk investor compared to the moderate risk one. In fact, for a higher-risk portfolio, the allocation will favour Private Equity as the highest-yielding asset class, but also the most illiquid together with Infrastructure in the investment universe. However, given the liquidity constraints the optimal allocation to alternatives is reduced compared to the moderate portfolio.
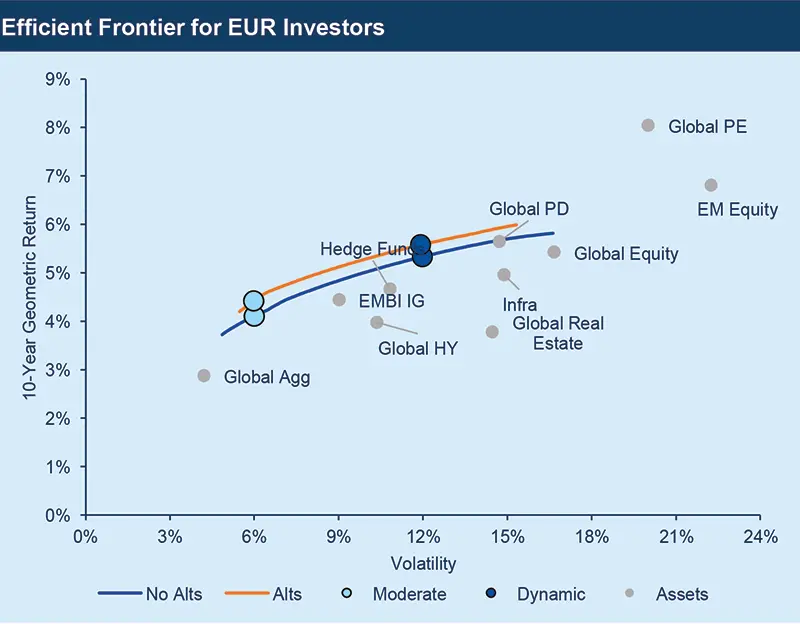
Source: Amundi Quant Solutions based on CASM model simulations. Data as of 30 January 2024 All the efficient frontier are obtained by minimising portfolio CVaR, while respecting diversification constraints and the liquidity appetite of the fictitious investor. When plotting the portfolios in the mean-volatility space, the frontier could exhibit an irregular pattern. The forecast returns are not necessarily indicative of future performance, which could differ substantially.
Strategic asset allocation for a US DOLLAR-BASED INVESTOR
As with the euro investor, the main portfolio building block is the global aggregate.
We expect an annual return of 5% for a US dollar-based investor portfolio with a moderate risk profile. The expected return increases to 5.3% when real and alternative investments are added to the SAA. As with the euro investor, the main portfolio building block is the global aggregate, with a weight mildly larger than for the euro investor due to the asset’s higher expected return hedged to the US dollar. The inclusion of real and alternative assets is financed by a reduction in high-quality fixed income and equity. A combination of Hedge Funds and Private Debt and, to a lesser extent, other strategies, represents the optimal allocation to illiquid assets.
Moving to the dynamic risk profile, return expectations are close to 6.1%, and 6.4% with alternatives. The allocation to the global aggregate accounts for slightly more than a fifth of the total allocation, while equity is the asset class with the highest exposure. An investor willing to gain additional exposure to alternatives will have to reduce the allocation to global aggregate and equity. The addition of the alternatives bucket (similar in composition to the euro dynamic investor) helps improve the Sharpe Ratio, while keeping the tail risk roughly unchanged.
A euro vs US dollar-based investor comparison
Portfolios denominated in euros show lower nominal returns compared to US dollar portfolios, but higher expected Sharpe Ratios due to the lower risk-free rate.
Like last year, a US dollar-denominated investor will benefit from higher returns than a euro investor. However, portfolios denominated in euros show higher expected Sharpe Ratios due to the lower risk-free rate.
- The inclusion of a diversified basket of real and alternative assets is beneficial in terms of portfolio efficiency, demonstrated by a higher Sharpe Ratio and lower shortfall risk.
- The positive effect of having alternatives in the portfolio diminishes for a US dollar-denominated investor, or when the risk profile increases from moderate to dynamic. This first instance is mostly explained by the higher correlations between alternatives and traditional assets for a US dollar investor. While the second is a function of the illiquidity ceiling constraint.
- The dynamic euro portfolio is more tilted towards equity than the US dollar one, with the latter having more exposure to the global aggregate. This can be explained by the higher return profile the US dollar investor can get from fixed income assets.
Amundi methodology for determining strategic asset allocation
The investment universe is global top-down and includes fixed income, equity and real and alternative assets. We consider the SAA from the perspective of US-dollar and euro-based investors. The fixed income assets are fully hedged, while equity and alternatives are unhedged against the investor’s currency. The currency hedging is obtained by applying the expected cash yield differential (local minus foreign) to foreign asset prices. Unhedged expected returns are obtained by incorporating the currency cross’s expected return to foreign asset prices. For each asset class, we simulated 10,000 scenarios over a 10-year horizon using the Amundi CASM model.
The scenarios are consistent with Amundi’s medium and long-term macroeconomic forecasts and climate transition model. The underlying return distributions are modelled with fat tails, tail co-dependence and heteroskedastic volatility, which are important elements when modelling portfolios containing alternative asset classes. Our optimisation framework minimises the Conditional Value at Risk (CVaR) of an expected return distribution to build an efficient frontier. The tail risk, which is peculiar for real and alternative asset classes, motivated our choice of a CVaR minimisation approach.
A liquidity rank is assigned to each asset class. The investor’s liquidity preference is reflected by a linear constraint whereby the total liquidity budget of the optimal portfolios cannot exceed a specified level. Every asset class is given a liquidity rank based on several characteristics, including time horizon, cash flow curve and liquidity among others. The investor’s liquidity preference for this exercise is set to medium; this choice allows careful control of the allocation to alternative asset classes, thereby aligning the SAA to the investor’s market and liquidity risk profile.
Additionally, we have included group constraints to limit the exposure to alternative fixed income (EMBI, global high yield and private debt), as well as to EM, and real and alternative assets. These constraints are equal for euro and US dollar investors and represent a medium-risk appetite. We also included some diversification constraints to balance the real and alternative baskets. The different SAA are simulated assuming a yearly rebalancing rule, selected as a compromise between different rebalancing frequencies according to asset class liquidity. Finally, each return statistic comprises a rebalancing premium ranging from 40 to 60 bps depending on the portfolio.
Building block approach to alternative investing
The appealing risk-return and diversification characteristics of real and alternative asset classes make them a perfect tool for improving portfolio efficiency and explain rising institutional investors’ demand for these assets. However, having an allocation to assets that are not frequently valued and with capital being locked up for many years can provide investors with mark-to-market and rebalancing challenges. Therefore, an investor could decide to manage this portfolio building block separately from the rest of their liquid assets.
We show the result of an optimisation minimising portfolio CVaR over a 10-year horizon for a US dollar-denominated portfolio. To assess how an allocation to an alternative assets building block may evolve when illiquidity and risk tolerance change, we consider two types of investors :
- An Illiquidity-Averse investor could be a family office with a focus on income generation. This investor would most likely need a shorter cash-flow curve, lower extension risk and a more mature secondary market to potentially enable portfolio rebalancing. The Illiquidity Averse portfolio shows a balanced allocation with Private Debt and Hedge Funds, characterised by a higher degree of liquidity, and Infrastructure, thanks to its diversification features.
-
An Illiquidity-Tolerant investor could be a pension fund with long-dated liabilities that favours growth assets. This investor could expect to earn more than 100 bps in extra returns compared to the Illiquidity Averse. However, beyond the incremental illiquidity of the portfolio, this incremental gain comes at a cost in terms of higher volatility and CVaR. The Illiquidity-Tolerant portfolio would favour less liquid and return-seeking assets such as Private Equity, at the expense of Real Estate which does not provide sufficient risk-adjusted returns for its level of illiquidity. Hedge Funds are also less favoured by a growth-oriented investor, due to their low return potential among real and alternative assets. Notwithstanding the positive return premium captured by the more illiquid portfolio, every investor must carefully calibrate their respective preferences in terms of the liquidity of assets, cash flow structure, the efficiency of secondary markets and the opportunity cost of locking in capital for a long horizon.


Authors