Summary
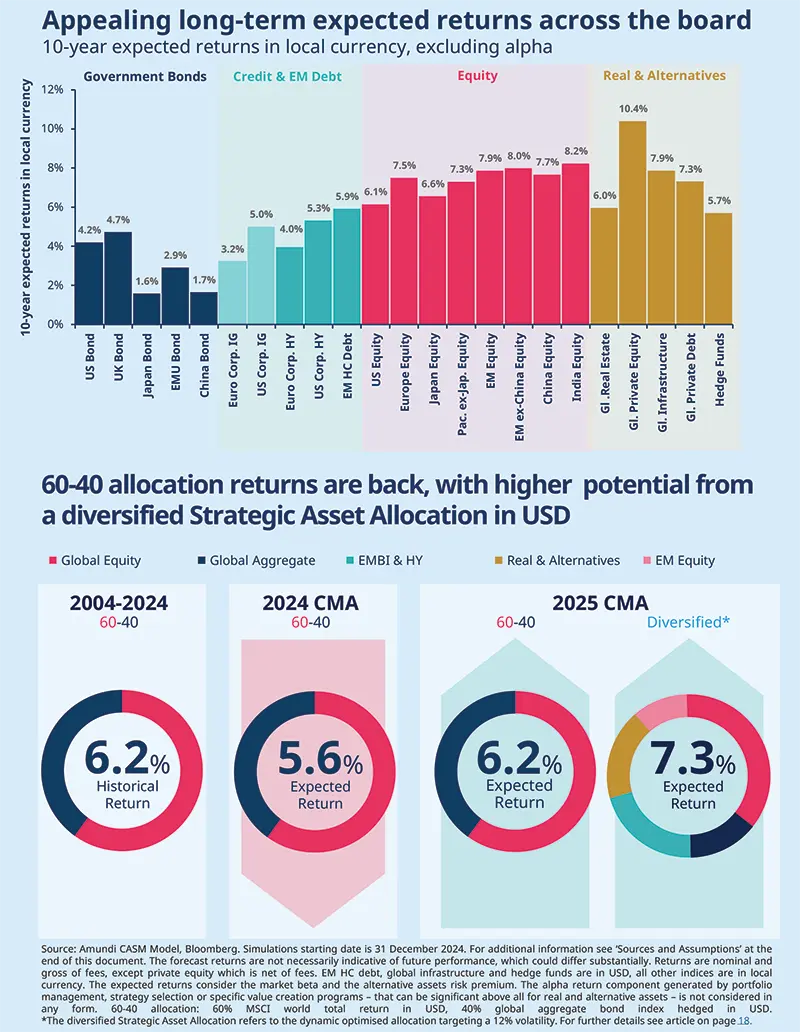
Over the next decade, a more favorable macroeconomic backdrop will support higher expected returns across most investable assets, enhancing the risk-return profile of SAA across investor types, notwithstanding the exclusion of idiosyncratic alpha in our Capital Market Assumptions (CMA) models.
Amundi’s 2025 CMA highlights the growing appeal of real and alternative assets, with hedge funds and global private debt standing out in the medium risk spectrum. Global private equity and infrastructure investments can enhance expected returns and offer diversification, but they also carry liquidity and complexity risks that demand specialized expertise.
Including alternative investments increases expected returns by 50 to 100 basis points with a medium appetite for illiquidity risk. With a high illiquidity tolerance, moderate risk profiles are little changed, while dynamic risk profiles experience a significant shift, with allocations to real and alternative assets doubling and return expectations rising by 50-60 basis points.
Real and alternative assets are key to enhancing risk- adjusted returns. Private equity and debt are appealing in the search for higher return potential.
10-year expected returns, volatility*, shortfall and liquidity risk** in local currency
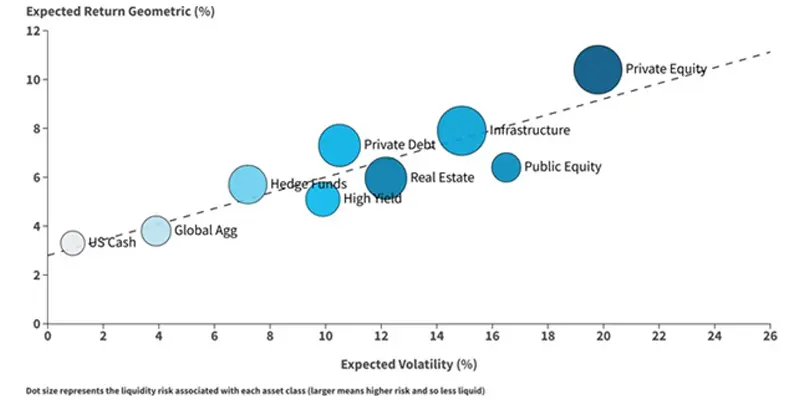
Source: Amundi Quant Solutions, CASM Model. Data as of 31 December 2024. Real Estate refers to all property unlevered real estate. The expected returns do not consider the potential alpha, generated by portfolio management that can be significant above all for real and alternative assets. *Expected volatility for alternative assets is derived from unsmoothed return series. Hence, this measure of volatility will be different to the one obtained from realised IRR. **Shortfall Risk is defined as the 95% CVaR based on the distribution of the year-on-year simulated returns at the 10-year horizon. Liquidity risk is defined as a liquidity rank based on several characteristics including time horizon, cash flow curve, and liquidity among others. The forecast returns are not necessarily indicative of future performance, which could differ substantially.
2025 CMAs – Real and Alternative Assets in focus
Real and alternative assets are strategically well-positioned in relation to liquid assets within the risk-return spectrum. These asset classes offer unique advantages that can enhance a portfolio's overall performance. The estimated reward-to-risk ratio for these assets encompasses the remuneration associated with liquidity risk, which is a critical factor for investors to consider given the associated uncertainty.
Below, we summarise the view at the asset class level
Private debt is the most appealing asset class on a risk-adjusted basis, with returns far above those expected in high-yield credit, as we confirmed the assumptions on the illiquidity premium.
Private equity is expected to be the only asset class to deliver double-digit returns, with a 1.5% increase from last year. This revision is primarily driven by higher expected returns in public equity and improved assumptions regarding the added value of private equity.
Infrastructure equity returns have significantly improved to almost 8%, driven by long-term demand in the energy and data sectors. The asset class looks appealing on a risk-adjusted basis as it stands between equities and opportunistic fixed income in terms of risk, but well above the CMA line.
Real estate projections have risen close to 6%, supported by higher nominal GDP assumptions, and the return-to-office theme is gaining even more traction. Valuations for US Real estate are still rich, hence our returns are not too far from corporate bonds.
Hedge funds are expected to deliver slightly below 6% thanks to higher cash returns bolstered by rising real rates.
Real and alternative asset class assumptions
Modelling expected returns for alternative assets is a complex task for several reasons. Primarily, these assets differ from their liquid counterparts in terms of structure, access to underlying investments and cash flows. Furthermore, within a single alternative asset class, there exists a variety of strategies and managers, each of which can greatly influence the investment's final outcome. The portfolio manager’s experience and skills also have a key impact. Yet, as these asset classes can bring important benefits to investors’ Strategic Asset Allocations (SAA), we model them in order to allow their inclusion within a robust SAA framework. As such, the assumptions around returns and volatility differ from the historical evidence offered by industry indices, and from investors’ historical and potential future experiences.
Regarding returns, we estimate the market beta of alternative assets and the additional risk premia these assets provide in terms of illiquidity and complexity, which we believe should be compensated. Idiosyncratic return components guided by portfolio management, manager selection or specific value creation programmes typical of these investments are not included in the expected returns and are not factored in when designing the SAA.
Our expected returns represent the average returns for investments in alternatives, well diversified across managers and vintage years, without taking into account the J-curve effects. Volatility assumptions are based on unsmoothed return series, which implies higher volatility for alternative assets compared to the one obtained from realised returns (IRR).
This approach is considered best practice when including them within an optimisation framework with liquid assets. These assumptions are specific to the SAA exercise, although they could be refined for customised analysis and portfolio implementation. Even without considering additional alpha potential and adjusting for volatility, real and alternative assets exhibit attractive risk/return profiles. In particular, global private equity (with returns shown net of fees) and global private debt are above the market line, while we expect their liquid counterparts to fall below.
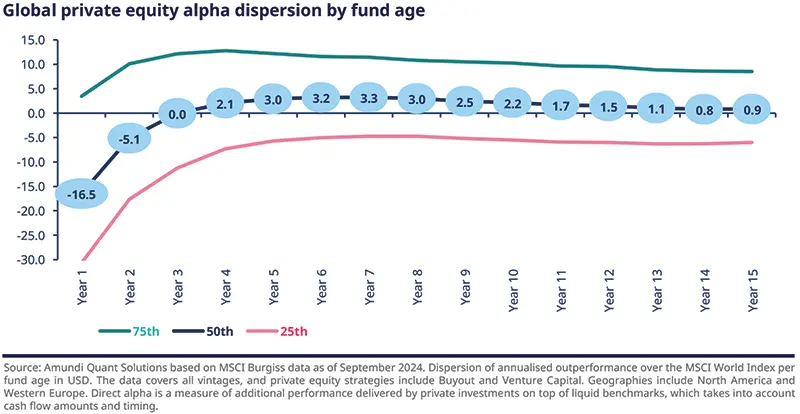
Private equity (PE) is modelled as an aggregate of Buyout and Venture Capital strategies. Our 10-year expected returns (net of fees and idiosyncratic alpha) for global private equity are slightly above 10%, reflecting an increase of around 1.5% with respect to last year, and an extra performance of 4% relative to public markets. This change is driven by revised public equity returns and new assumptions for their added value, guided by a deeper look into the asset class’s performance data. Higher interest rates compared to last year lift the cost of leverage, which harms the attractiveness of Buyout strategies. This could be partially offset by the increased IRR generated by lower entry multiples due to the higher cost of capital. The implementation of value creation plans will be key for GPs* to navigate the future landscape and are also affected by potentially expensive leverage. Manager selection in PE is crucial, as between 25% to 50% of funds historically underperformed against liquid benchmarks, particularly based on fund age.
We view global infrastructure as a broad range of strategies. We can now break down returns into income and capital appreciation. The income component is modelled as a function of future nominal rates to capture indexation mechanisms, plus a spread to account for illiquidity. The capital growth part is linked to public equity returns. Our 10-year expected returns for global infrastructure are around 7.9%, which is significantly higher than last year. This increase results from a model change and higher equity returns, with the old framework estimating around 7%. We believe long-term demand for infrastructure investments will rise, especially for energy and data centres. The necessity for secure energy production and AI expansion will be key drivers, more than offsetting any potential decline in the climate transition narrative. Demographic trends, such as urbanisation and population growth, will further support demand for infrastructure, especially in emerging economies.
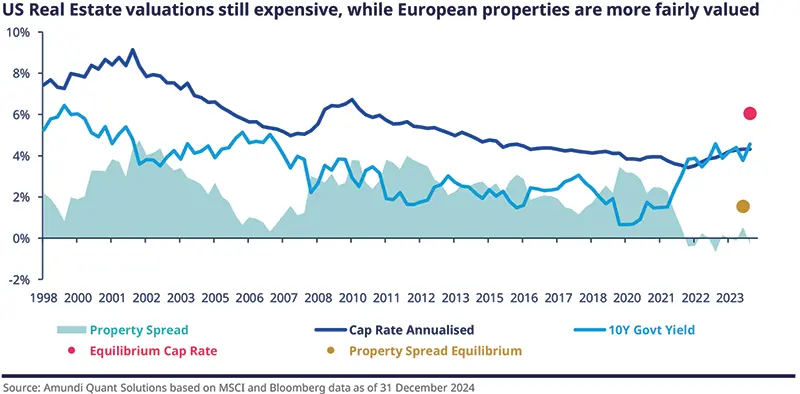
Real estate returns over the next decade are projected to be between 5.3% and 6% for European and US properties, respectively. These expectations imply an improvement versus last year of around 1.5%. The upward revision is mainly due to higher nominal GDP assumptions, which impact the growth component of the model and mildly improved valuations. Lower transition costs and the return-to-office culture being pursued globally will push returns for commercial real estate higher, which is an important component of our reference benchmark. Across Europe, we see valuations roughly in line with equilibrium. However, US cap rates remain below our estimate of equilibrium, with property spreads close to zero, which could indicate expensive valuations for US properties.
Private debt assets are predominantly structured as floating-rate, which has allowed them to benefit from the current environment of generally high interest rates. Although the upcoming quarters may pose some headwinds for the asset class, as monetary policy across Developed Markets normalises and drives interest rates lower, we estimate the illiquidity premium to be consistent with last year’s assumptions. We expect the illiquidity premium to remain a significant driver of direct lending returns in the long term. In the US, which represents a significant portion of the global market, we see higher interest rates and spreads going forward, and we expect return assumptions to be higher than for euro assets. All in all, our estimates for global private debt (levered) are around 7.3% for the next 10 years, with a marginal uptick compared to last year.
Hedge funds’ (HF) expected return model is based on alternative risk premia added to a cash contribution and does not consider alpha contribution (which is unpredictable over the long run). Returns are presented gross of fees. Cash returns, a key variable for HFs, are expected to increase marginally due to our upward revision of real rates in the US, providing tailwinds for the asset class. The return’s premium component is almost unchanged versus last year, as equity and credit betas are offset by the negative duration beta. A diversified basket of HF strategies could deliver returns slightly below 6%, with a similar risk profile to fixed income. HFs’ risk-return profiles, along with their low correlation to traditional asset classes, position them as a compelling source of diversification within the SAA. As the dispersion of returns is wide in this space, manager and strategy selection are key to further enhancing their risk-return potential.
Strategic asset allocation for moderate and dynamic risk investors profiles
The strategic asset allocation exercise, based on our capital market assumptions, helps guide investors on how to efficiently diversify assets to target a specific level of risk. In addition to traditional forward-looking statistics, we report the probability of the optimised portfolios’ returns being below simulated inflation, therefore taking the distribution around the average scenarios into account. The SAA is based on simulated scenarios that consider a distribution of economic outcomes. Thus, the derived SAA is more robust than scenarios that deviate from the central scenario.
When defining the strategic asset allocation including real and alternative assets, we consider an illiquidity tolerance in accordance with investors’ preferences. The illiquidity preference acts as a constraint to the allocation to less liquid assets by penalising them for their peculiar characteristics (liquidity, secondary market depth, investment horizon, cashflow distributions, among others). The below table presents investors with two different risk budgets (moderate and dynamic), with an illiquidity appetite defined as medium, which can be associated with an exposure to illiquid assets of roughly 20%.
Strategic asset allocation for a moderate risk investor
Euro-based investors with a moderate risk exposure can expect 4.4% annual returns over the next decade, rising to 4.9% when including real and alternative assets. A US investor with the same profile can expect annual returns of 5.6-6%. These figures are respectively 30 to 70 basis points (bps) higher than last year, primarily due to the higher expected returns for risky assets. Although global aggregate remains the SAA’s main pillar, representing 47-51% of the euro investor’s allocation and 50-54% for the USD-based one, its weight is lower compared to last year, given that there is more risk-adjusted reward coming from risky assets. Yet, this exposure remains key for investors with a mild risk appetite to effectively exploit the downside diversification versus risky assets.
Notably, while the inclusion of alternative assets increases the Sharpe ratio – due to higher expected returns and limited impact on overall volatility – it also leads to a slightly higher CVaR. This reflects a shift in the risk profile: the portfolio becomes more efficient on average, but also more exposed to extreme downside scenarios, especially due to the illiquid nature of assets like private equity.
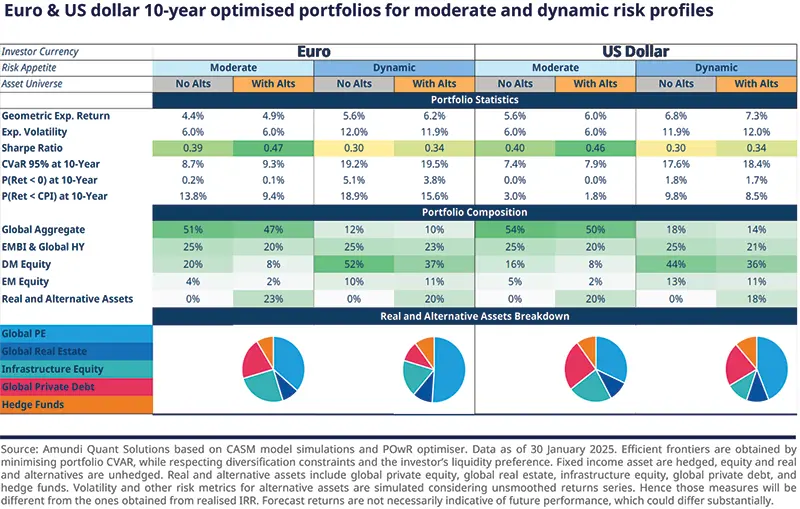
To showcase the role of alternative assets in improving returns and resilience against inflation, we highlight that when these assets are wisely added to the allocation, the probability of negative nominal and real returns over 10 years drops across the board (from 0.2% to 0.1% and 13.8% to 9.4% respectively for the euro moderate profile.
The allocation to real and alternative assets is similar for both investor types, with a mix of private debt, private equity and infrastructure. While exposure to private equity enhances the return potential, allocating to income-like alternatives (private debt and infrastructure) helps optimise the overall risk-return profile. Compared to last year’s SAA, our analysis suggests reducing the exposure to hedge funds, while adding to private debt and equity where returns have improved most.
Strategic asset allocation for a dynamic risk investor
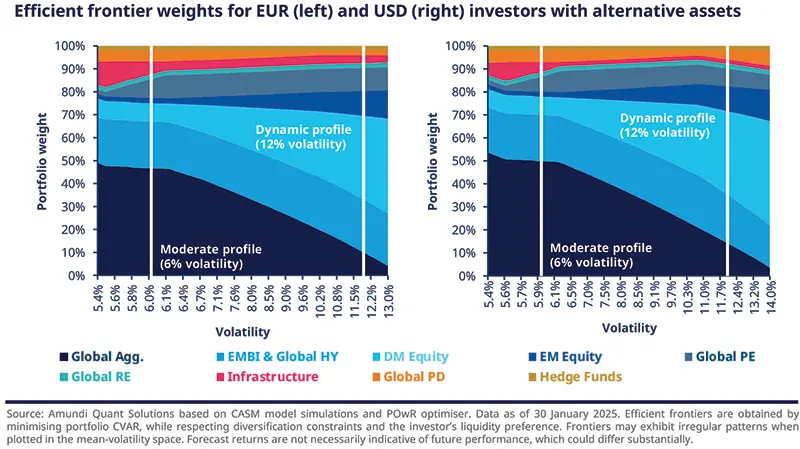
Moving towards more dynamic risk profiles, the evolution of the efficient frontier weights (see chart below) shows that the overall allocation to bonds has decreased in favour of risky assets, with DM equities the most favoured, followed by EM equities and private equity. As we move from a moderate (6% volatility) to a dynamic (12%) risk profile, allocations to alternative assets do not increase significantly as the illiquidity appetite in this exercise is unrelated to the market risk one. What changes as the risk appetite increases is the composition of the alternative basket: a reduced weight for infrastructure and private debt, in favour of private equity. This reflects that for this risk level, there is an optimal combination of real and alternative assets which makes the SAA more efficient.
Return expectations increase by more than 100bps for dynamic risk profiles compared to a moderate risk profile, ranging from 5.6% to 6.2% for EUR-based investors, and 6.8%-7.3% for USD ones. These represent a 50 to 90bps increment on last year, due to the greater equity exposure to capture growth opportunities.
For the dynamic investor profile, the inclusion of real and alternative assets in the SAA optimisation is funded by a reduction in the allocation to developed market equities.
The inclusion of real and alternative assets (private equity and debt represent two-thirds of this bucket) helps to improve the portfolio’s Sharpe Ratio while keeping the tail risk under control and reducing the probability of underperforming inflation. Investors should bear in mind that while exposure to alternatives offers risk-return diversification benefits, it also comes with increased risks related to illiquidity and complexity that require specific technical expertise.
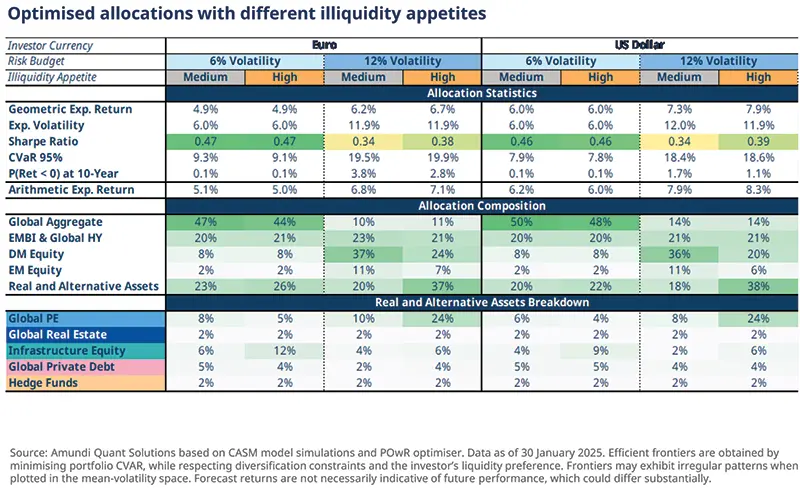
In the next section, we explore the concept of appetite for illiquidity risk and assess the effects on Strategic Asset Allocations (SAAs) of increasing this appetite from medium to high.
Increasing appetite for illiquidity risk
Investors’ appetite for illiquidity risk (or illiquidity risk tolerance) is a critical factor that significantly influences the allocation of assets. Liquidity refers to the ease with which an asset can be converted into cash without significantly affecting its market price. For this reason, understanding how investors prioritise liquidity is essential for making informed decisions about asset allocation and for optimising asset allocation strategies, particularly when it comes to combining assets presenting very different liquidity profiles. By varying illiquidity risk appetite, we are making assumptions around the frequency and likelihood with which investors would need to raise capital to meet cash flow demands: a high illiquidity risk appetite means a low probability and frequency of liquid capital requirements. Analysing the implications of varying levels of illiquidity risk appetite helps us to align the asset allocation with the goals and risk tolerances of investors, ultimately enhancing their ability to reach long-term financial success.
The previously described strategic asset allocations were characterised by a medium appetite for illiquidity risk. We now explore what happens when investors may be willing to accept higher illiquidity risk in exchange for the potential for greater rewards.
For allocations with a lower volatility risk budget, increasing the illiquidity appetite leads to a slight rise in the allocation to illiquid assets, primarily in infrastructure equity, as global aggregate exposure is partially replaced. However, the overall allocation statistics remain largely unchanged in terms of both risk and return.
These findings indicate that a moderate risk profile combined with an increased tolerance for illiquidity risk has only a marginal effect on allocation. This suggests that the volatility risk budget at the portfolio level remains the primary factor influencing investment decisions for a moderate risk profile.
For dynamic risk allocations, the changes are more pronounced. The allocation to private equity becomes even more relevant, funded by a reduction in listed equities. Interestingly, the optimiser suggests adding to global aggregate to offset the increased riskiness of the growth portion of the allocation. Return prospects improve by 50 to 60 bps, along with a higher Sharpe Ratio, highlighting an enhanced efficiency. The overall allocation to real and alternative assets roughly doubles, with a more pronounced change for the dollar investors due to the benefits of being exposed to the expected currency repricing, making alternative assets returns more appealing. It is worth noting that infrastructure equity still deserves an allocation within the basket as it offers a return premium on top of equity and a lower correlation versus risky assets.
Sources and assumptions
Sources
Sources of CMA: Amundi Asset Management CASM Model, Amundi Asset Management Quant Solutions and Amundi Investment Institute Teams. Macro figures as of the last release. The starting simulation date is 31 December 2024. Equity returns based on MSCI indices. Reference durations are average figures. Returns on credit assets are comprehensive of default losses. If not otherwise specified, expected returns are geometric annualised average total returns at the specific horizon. EM debt HC, EM-GBI, global infrastructure and hedge funds are in USD, all other indices are in local currency. Returns are nominal and gross of fees, except private equity which are net of single manager fees. Real estate refers to all property unlevered real estate. Hedge fund returns represent the expectations for a diversified aggregate of Funds of Hedged Funds are gross of Fund of Funds fees. The expected returns consider the market beta and the alternative assets risk premium. The alpha return component generated by portfolio management, strategy selection or specific value creation programmes, which can be significant above all for real and alternative assets, is not considered in any form.
The arithmetic average returns are derived using the price generated by our simulation engine. By definition, the arithmetic mean is always greater than or equal to the geometric mean. In particular, higher volatility of returns and higher frequency of returns and/or a longer time horizon will increase the difference between the two measures.
Simulated volatilities are calculated on simulated prices over a 10-year horizon. Simulated volatility for alternative assets is derived from unsmoothed return series. Hence, this measure of volatility will be different from the one obtained from realised IRR.
Expected returns are calculated using Amundi central scenario assumptions, which include climate transition. Forecast and fair values up to a 3-year horizon are provided by the Amundi Investment Institute Research team (macro, yields, spread and equity).
Forecasts for annualised returns are based upon estimates and reflect subjective judgments and assumptions. These results were achieved by means of a mathematical formula and do not reflect the effect of unforeseen economic and market factors on decision- making. The forecast returns are not necessarily indicative of future performance.
Data sources: Bloomberg, Cambridge Associates, Global Financial Data. Edhec Infra, MSCI and MSCI Burgiss.
CASM model
We believe capital markets are not always efficient and they deviate from long-term fair values. We follow a disciplined approach to asset allocation that blends quantitative input and qualitative assessment to identify superior asset allocations. Our multivariate approach to modelling assets and liabilities focuses on complex relationships between risk factors over multiple investment horizons. Simulating asset prices that are consistent with our risk factor models allows us to capture complex market dynamics. Macro and financial risk factors explain asset returns and the correlations between assets.
Cascade Asset Simulation Model (CASM) is a platform developed by Amundi in collaboration with Cambridge University*. CASM combines our short-term financial and economic outlooks. It incorporates medium-term dynamics into long-term dynamic trends, to simulate forward-looking returns for different asset classes over multiple horizons. CASM generates asset price scenarios and underlying economic and financial factors that determine Amundi’s expected returns. It is a valuable tool for strategic asset allocation and asset-liability management analysis. The flexibility of CASM allows us to provide highly customised solutions to our clients.
We estimate model parameters quarterly to incorporate new market data and our short-term outlook. The process for calibrating models that reflect our view of economic and financial market trends is a close collaborative process between many teams at Amundi. We reach a consensus for the short-to- medium-term outlooks for macro and financial variables for each region under consideration (US, Eurozone (core, semi-core and periphery), UK, Japan, China, India, EM area). The models are calibrated to be consistent with these outlooks and long-run estimates. At each step in the process, results are analysed against stylised facts and checked for consistency. The estimation process for each region progresses from calibrating macro and financial variables to simulating asset prices, where asset prices are driven by the underlying macro and financial variables.
Price returns are generated using a Monte Carlo simulation. Stochastic generation of risk factors and price scenarios allows us to analyse a wide range of possible outcomes and control the uncertainty surrounding these. We can change starting assumptions and see the effect on possible future asset prices. The platform allows us to simulate consistent scenarios across any instrument in a multi-asset portfolio, a feature that is particularly relevant for institutional investors with long time horizons.
The CASM platform covers macro and financial variables for major regions, in particular the US, UK, Eurozone, Japan, China, India and Emerging Markets as an aggregate. Models are constructed to capture the main drivers of economic variables that affect asset prices. The definition of the building blocks within the cascade structure has been enhanced to incorporate the climate policy actions and their implications.


Authors