
Summary
Executive Summary
We seek to analyse how Private Assets (PA) likely behaved during the recent market selloff, based on two complementary approaches: liquid proxies of PA returns and PA’ sensitivities to macroeconomic trends.
Both models suggest that PA is likely to demonstrate reasonable resilience.
However, the potential decline in corporate activity is a significant wildcard,which could undermine the early recovery observed in private deals.
Thus far, since the selloff was primarily driven by a rebalancing of global allocations, we do not anticipate a significant reweighting impact on investors’ PA holdings.
Overall, we expect that PA will once again showcase their diversification benefits.
Markets have taken two hits in a row…
Market weakness started in late February, primarily driven by a valuation correction in the US tech sector and a de-concentration of most crowded stocks. This was amplified by declining sentiment amongst households, corporations, and investors.
A second selling wave began not long after, in response to Trump’s tariff offensive, which went well beyond market and government expectations. This prompted significant economic downward revisions and emerging liquidity stress in some market segments, resulting in multiple correlation anomalies as investors struggled to agree on a macroeconomic scenario.
The intensity of the selling ultimately qualified as a ‘market capitulation’ – a situation in which investors give up hope and decide to exit their positions, leading to a sharp price drop, but also paving the way for a potential rally. However, the situation remains fluid amid ongoing uncertainty regarding the length and magnitude of trade escalations and their impacts on key macro variables.
Below, we explore how private assets likely behaved during these two consecutive stress episodes.
… Estimated returns suggest Private Assets are still standing
Using liquid proxies to estimate Private Assets’ performance
We use liquid proxies (i.e. listed assets that have historically behaved in a similar way to private assets and are influenced by similar drivers) and sensitivity models to estimate the performances of PA in real-time. This helps provide insight into the implications that significant macro or listed market events have on PA performance, while awaiting confirmation from ‘official’ NAV updates.
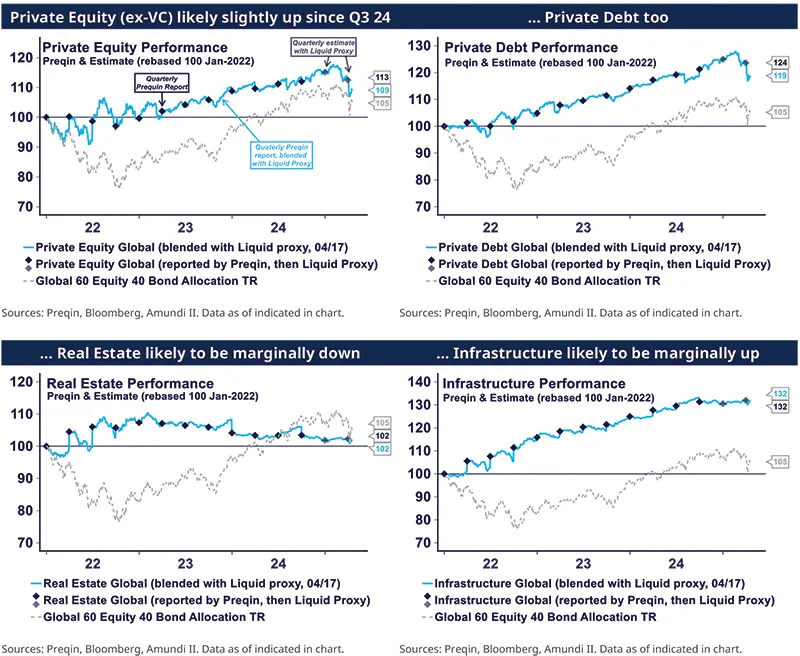
In the charts below, we combined the quarterly NAVs from Preqin (the dark blue markers) with our liquid proxies (the light blue line, and light blue markers at the end of quarters that have not been reported yet).
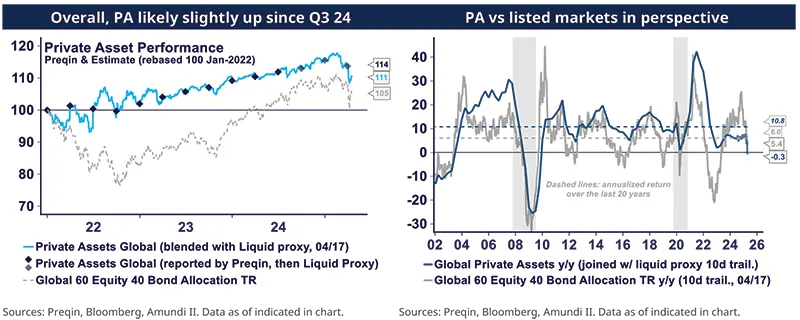
The charts show that most private segments will likely still stand slightly above their last reported NAV as of Q3 2024, except for Real Estate, which will likely be modestly down.
Were NAVs to be calculated on the latest market close (Apr-17), we estimated that PA would show a decline of -2.7% since Q1 2025 during the second phase of the selloff (and -0.3% on year-over-year basis).
However, as we are still early in the quarter and may have already passed the most intense phase of market selling, it is too early to estimate final NAVs for Q2 2025. The extent of the impact will likely depend on whether the economy slides into a recession.
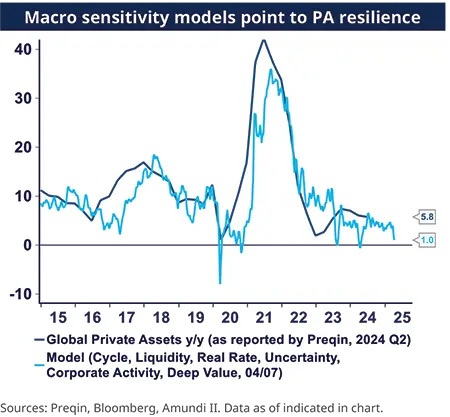
Key Macro drivers for PA also point to stable performance
Complementary to our liquid proxy approach, we track PA’s strongest connections with broad macro fundamentals, in order to model their most likely performance regime.
Here are the strongest connections we identify for PA as a whole (we overlook nuances at more granular segment and regional levels to maintain brevity):
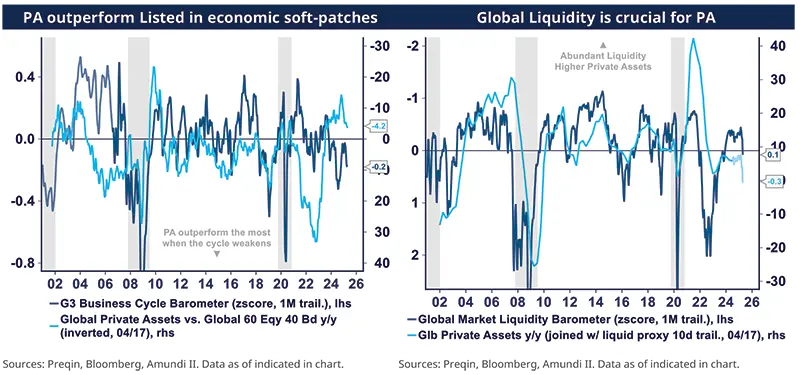
Stage of the business cycle: PA outperform listed markets the most in economic soft-patches and usually underperform in the early stages of economic recovery.
Global liquidity and corporate credit conditions: these factors are crucial for PA. Although stress is rising, it remains manageable at this stage.
Real Rates: PA are highly sensitive to real rates (less so to nominal rates, given PA’s favourable inflation exposure), with nuances across segments.
PA rises when corporate activity and the pulse of corporate profitability are strong.
Investors’ risk appetite has strong implications for both listed markets and PA.
Trends below-the-surface in the corporate sector and the presence of undervalued securities impact PA, which is why PA are sensitive to value and size factors.
Factors 4) and 5) may require closer monitoring. The potential for adverse second-round effects on corporate activity due to increasing uncertainties is a significant wildcard for PA today.
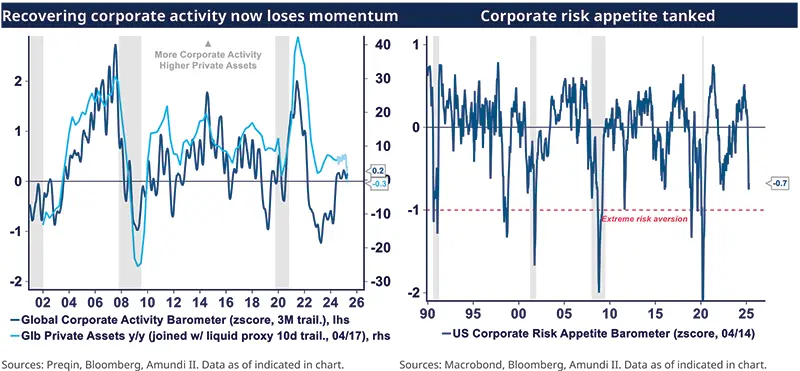
Indicators suggest that the corporate sector has been cautious in anticipation of slowing demand. Companies began scaling back their production factors as early as mid-2024, which should facilitate an orderly adjustment. However, our indicators also reveal that the recovery in corporate activity (as shown in the left chart below, which tracks a wide range of corporate deals) and corporate risk appetite (illustrated in the right chart, which tracks executive surveys, company guidance, and investment outlooks) is quickly losing momentum. In particular, primary market issuance and the volume of corporate transactions are softening in both equity and bond markets, while declining stock valuations are diminishing the attractiveness of some private deals. These dynamics are not yet alarming, but a sharper and prolonged deterioration could negatively impact private assets. We will address these risks in greater detail in a separate piece.
As of today, our macro sensitivity models reach a conclusion similar to the liquid proxies approach. The former indicates that, on a year-over-year basis, PA performance is expected to increase modestly by +1.0%, while the latter suggests a modest decrease of -0.3%.
Both approaches suggest that despite market fluctuations, PA performance is likely to remain within a range at this stage.
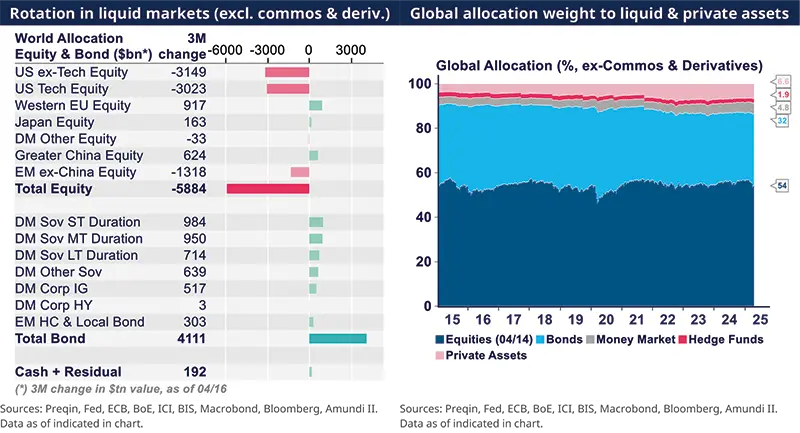
The market selloff is unlikely to have meaningfully reweighted real assets in global portfolios.
We monitor global investor allocations across equities, bonds, hedge funds, and private assets (excluding commodities and derivatives), in market capitalization.
Over the last quarter, approximately $6 trillion and $1 trillion were wiped out from US and EM ex-China equities, the bulk of which moved back into EU and China equities, and in bonds (especially high-rated and shorter durations).
Overall, this switch has had a negligible relutive effect on less liquid assets. In particular, we estimate PA’s weight in global allocations mechanically rose from 6.4% at the end of 2024 to 6.6% today. Beyond specific local situations, overall, we therefore do not expect any meaningful rebalancing thereafter, especially as investors claim they are seeking to increase their allocation to alternative and real assets.
Private Assets likely to demonstrate their diversification benefit once more
Diversification has become increasingly challenging in the current environment, as traditional mainstream hedges have turned into double-edged swords, largely due to the multitude of diverging market forces. For instance, there is a tug-of-war between inflationary pressures induced by trade tariffs and the deflationary forces stemming from a slowing economy. On one hand, US interest rates are supported by concerns over the deficit, potential de-dollarization, and technical liquidity risks; on the other hand, they face downward pressure from anticipated monetary policies and weaker growth.
In this context, hedging against inflation, trade wars, rising interest rates, or a declining dollar has become highly complex and is likely to remain so in the coming months.
As a result, an increasing number of investors are seeking more reliable all-weather diversifiers. The recent market episode will serve as another case study to assess PA’s diversification benefits. Based on our performance estimates, we expect them to continue delivering in this regard.
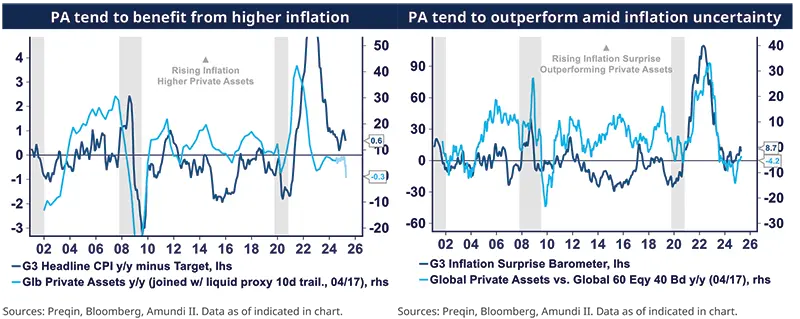
PA as protection against inflation uncertainty
Uncertainty surrounding inflation has increased, as Trump’s trade war will likely contribute to rising prices, contrasting with a weakening economic cycle that is fuelling deflationary pressures. Historically, PA have provided a strong hedge, as real estate and infrastructure segments have intrinsic value that tends to rise with inflation. Other private segments are also positively sensitive to inflation, with nuances depending on the source of inflation, whether it’s driven by demand or supply factors.
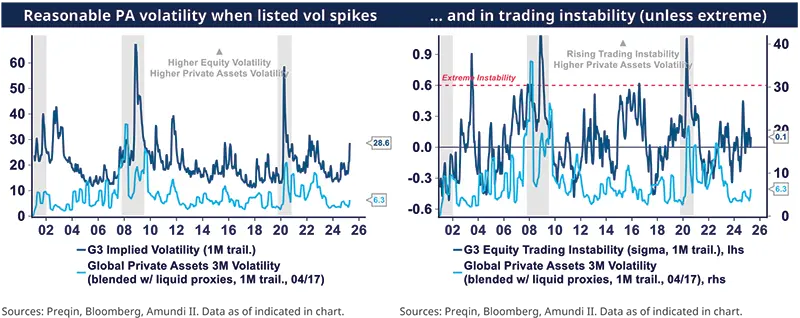
PA reasonably immune from listed markets’ volatility and trading instability
PA have historically shown lower volatility than listed markets, even when using returns blended with liquid proxies. Phases of acute trading instability (tracked by our barometer on the right graph, which tracks over 50 patterns indicative of imbalances in the market structure at both the individual security and index levels) have also a moderate influence on PA, except during extreme episodes.
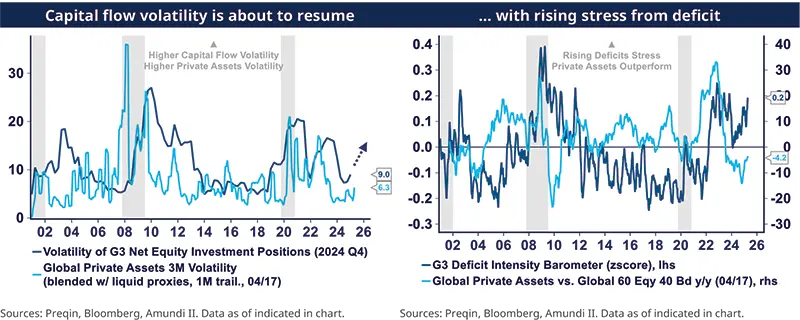
PA show modest sensitivity to FX and bond volatility (currently driven by capital flow and deficit stress)
Another significant source of uncertainty currently stems from surging volatility in FX and yields, driven by concerns over de-dollarization, rising deficits, monetary policy flexibility, and to some extent liquidity stress.
The volatility in international capital flows (measured as of the end of 2024) has resumed, but PA will only reflect a fraction of this volatility.
The sensitivity of PA to political stability and deficit concerns is also limited, as illustrated in the right graph.
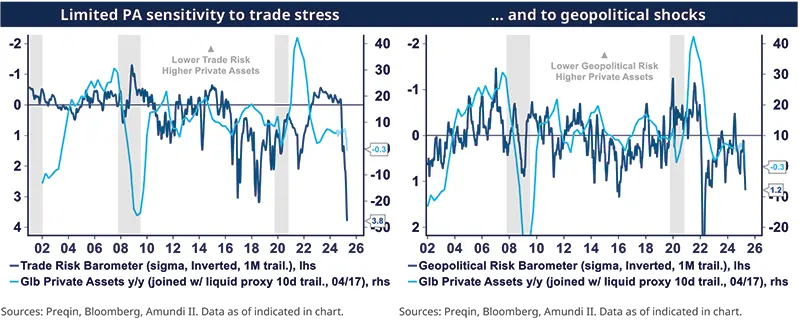
PA are less sensitive to trade stress and geopolitical shocks
While PA are not entirely insulated from trade and geopolitical stress, they exhibit moderate exposure to these factors compared to listed markets, which is a significant advantage in the current environment. Private assets typically focus on fundamentally undervalued domestic opportunities and stable income securities, which are generally less affected by international issues – unless those issues end up triggering a regime change. Instead, private assets tend to be more sensitive to financial and economic uncertainties.
A significant trade war escalation that would lead to a recession and a profound shift in global flows would unlikely leave PA unscathed, let alone listed markets.
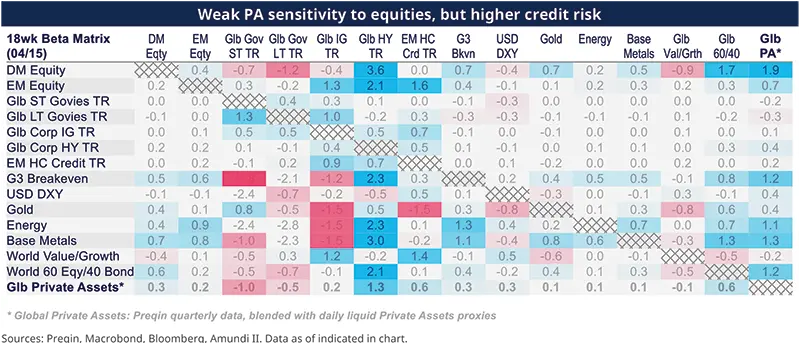
Our Beta matrix indicates a reduced sensitivity to equities, but higher sensitivity to credit risk
The table below, which compiles market beta across asset classes over the past 18 weeks, highlights the reduced sensitivity of PA to equities. Additionally, their negative implied exposure to government bonds provides a protective buffer against rising rates.
In contrast, private assets demonstrate a higher relative exposure to credit risk, highlighting that global liquidity is the key variable to monitor. Our indicators suggest that liquidity stress has selectively increased in certain market segments, affected by extreme daily fluctuations in bonds, credit, and volatility. Nevertheless, liquidity remains manageable at this stage, bolstered by limited credit growth and investments from both corporations and households.


Authors