
Summary
New Carbon Emission Metrics on the Road to Net Zero
Climate risk is the biggest challenge humanity has to face in the 21st century, affecting both the biosphere and the economic paradigm that currently underpins it. The latest reports released by the Intergovernmental Panel on Climate Change (IPCC) and the International Energy Agency (IEA) emphasize the urgency to act quickly. The former provides new estimates of the chances of crossing the global warming level of 1.5°C in the next decades, and finds that unless there are immediate and large-scale reductions in greenhouse gas emissions, limiting warming to close to 1.5°C or even 2°C will be out of reach. IEA’s report underlines that to achieve Net Zero Emissions, the annual clean energy investment will need to reach $4 trillion by 2030, with a 40% reduction of carbon emissions by 2030 and 62% by 2035.
Since the 2015 Paris Agreement and the emergence of net zero emission policies, climate change is now the top priority on the agenda of financial institutions, supervisors and policymakers. Consequently, the asset management industry also has a key role to play. Terms such as “portfolio decarbonization”, “temperature alignment”, “net zero carbon investment” and “Paris-aligned benchmark (PAB)1” have become the everyday reality of asset owners and managers. These will significantly alter portfolio allocation and investment frameworks.
Institutional investors are regrouping into the UN-convened Net Zero Asset Owner Alliance with the objective to “transition their portfolios to net zero GHG emissions by 2050”. Additionally, asset managers have formed the Net Zero Asset Managers initiative, which currently boasts 220 international asset managers and $57 trillion of assets under management. Governments have also implemented additional regulations to promote the efforts of companies and financial market participants around the disclosure and the transparency of carbon emissions data, such as the Sustainable Finance Disclosure Regulation (SFDR) and the EU Taxonomy.
The key challenge of these regulations is therefore the supply of relevant data in terms of frequency, quality and coverage. If these metrics are not self-reported by companies, data providers usually estimate their carbon emissions. However, the quality of these estimates is usually poor: academics find no evidence that these scores predict future changes in emissions. As we are at an early stage for the race to Net Zero, climate risk assessment methodologies have not yet reached maturity2. Numerous initiatives have put forward new climate risk measures that differ from traditional scope 1 + scope 2 carbon emissions3,4.
We recently published two working papers that study climate risk measures:
- Portfolio Construction with climate risk measures, conducting a survey of the current climate risk measures in the asset management industry and how portfolio construction practices use these “traditional” metrics;
- Net Zero Carbon Metrics, defining the metrics needed to enhance disclosure and debate on corporates’ emissions in the context of portfolio alignment, engagement and net zero emissions policies.
Key findings
1. New and improved Net Zero Carbon Metrics
Mobilization of the asset management industry for net zero requires the development of precise and specific net zero carbon metrics. For that reason, new climate risk measures have recently been established to complement those traditionally adopted (carbon emissions and carbon intensity), for example temperature scores, taxonomy, green revenues or capex values.
These will shape the practice of portfolio alignment in the future. In parallel, at Amundi we have developed both new static measures (NZE duration, NZE gap, NZE slope and NZE budget) and dynamic NZE carbon metrics (time contribution, zero-velocity scenario). We used these measures in a new Participation, Ambition, and Credibility framework to control trajectories and targets of issuers. These metrics will give a more precise and dynamic understanding of portfolio alignment.
As such, investors are increasingly making use of carbon trajectories, which are dynamic approaches, rather than relying on current carbon measures, which are mostly static. Indeed, carbon trajectories allow investors to anticipate the effects of direct risks on issuers and to identify companies whose alignment appears unrealistic, therefore excluding or underweighting the associated securities within their net zero strategies.
2. A dynamic approach for portfolio alignment
Whilst portfolio decarbonization is a static problem, portfolio alignment involves a dynamic approach to comply with a given climate policy (e.g., Paris-based benchmark approach or Net Zero Carbon objective approach). Portfolio alignment is therefore considered trickier than an usual portfolio decarbonization strategy since it requires the input of new climate metrics that are considered more difficult to calculate. In addition, it also requires reevaluating decisions depending on the future behavior of corporate issuers both individually and collectively, which in turn results in more uncertainties over the portfolio solution.
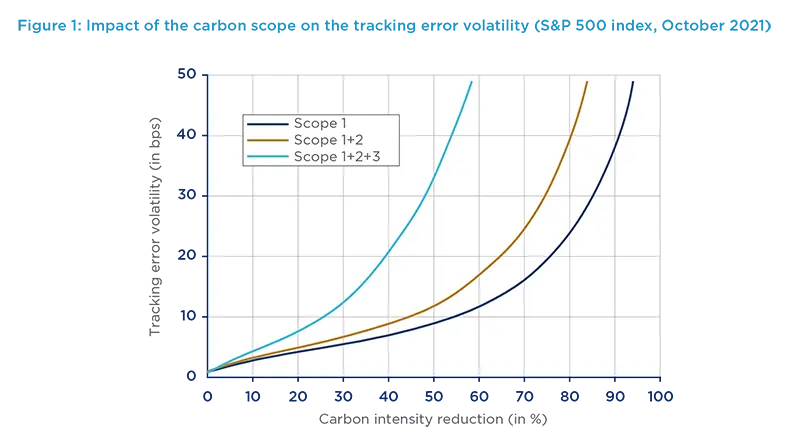
3. The case of portfolio decarbonization
Portfolio Decarbonization: We notice that the slope of the tracking error risk/volatility curve is steeper when the carbon intensity reduction is high. This means that an increased carbon intensity reduction implies a higher volatility of the tracking error. The steepness of the curve also increases when we include a higher “number” of scopes, e.g. it is steeper when we include all scopes than when we include only scope 1.
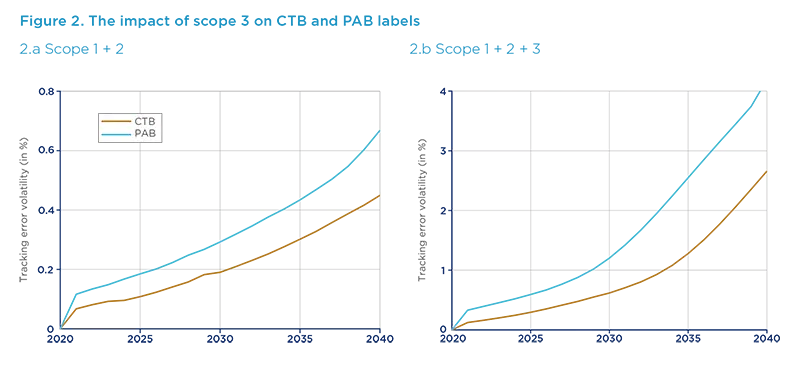
4. Including scope 3 carbon emissions
Our analysis showed that the decarbonization of portfolios (i.e., construction of a portfolio with lower carbon risks) is more difficult when considering full scope 3 carbon emissions5. For example, we observe that the tracking error risk is very low when we consider scope 1 + 2, whereas it can reach 4% for the Paris-Aligned Benchmark (PAB) label when we include scope 3. This is a problem because regulators often encourage investors to go beyond the traditional scope 1 + 2. However, there is an increase in tracking error compared to using direct plus first tier indirect carbon emissions. Interestingly, if we consider only scope 1, 2 and 3 upstream first-tier (direct supply chain), the tracking error remains within a limited range (e.g. below 2% by 2050 for a Carbon Transition Benchmark), while the inclusion of full indirect upstream and downstream emissions lead to the results mentioned above.
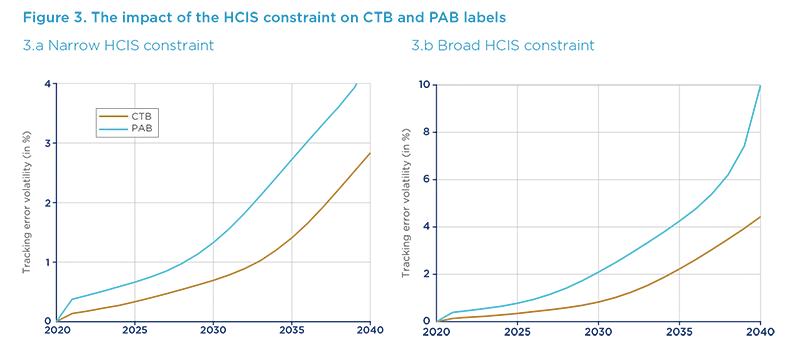
In addition, the Carbon Transition Benchmark (CTB)6 and PAB labels require that the exposure to sectors highly vulnerable to climate change is at least equal to the exposure in the investment universe (the so-called “high climate impact sectors”). Considering the inclusion of these constraints, the tracking error risk is also heavily impacted. For the CTB label, tracking error risk becomes 4.5% when we add the broad high climate impact sectors (“HCIS”) constraint, whereas this figure becomes 10% for the PAB label.
Another relevant consideration is the portfolio turnover needed to achieve the reduction required by the decarbonization pathways of the CTB and PAB labels. A high turnover is observed at the beginning and at the end of the period (namely 2020 and 2040), leading to very concentrated portfolios, especially in the case of a PAB benchmark including a broad HCIS constraint. These results show that the cost for investors may be higher when we consider both scope 3 and the broad HCIS constraint. Nevertheless, we can assume that the investable universe in the next decades will be very different and more aligned to a NZE trajectory than the current one.
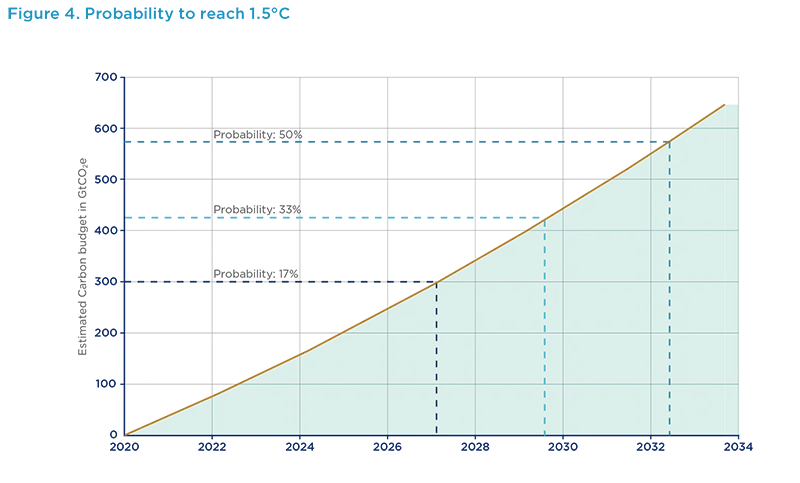
5. Achieving Net Zero Carbon Emissions
In conclusion of our analysis, we applied the framework to the Carbon Disclosure Project database. Using sample data of 751 corporates, we analyzed their participation, ambition and credibility. Most issuers are not on the right track since the carbon emissions trend is positive for more than 65% of them. Nevertheless, half of them have been successful at reducing their trend slope in 2019 and 2020. By including the corporates’ reduction targets and the sectoral NZE scenarios provided by the IEA, we observed a positive correlation between participation and credibility, but a strong negative correlation between ambition and participation. Therefore, we were able to define the two main hurdles that issuers are facing to achieve Net Zero Carbon Emissions: issuers’ lack of ambition concerning their NZE scenario and lack of alignment of NZE targets with their past trends. Concerning the sectors, we noticed that issuers from the Electricity (or power generation) sector have made significant effort to restrain their carbon emissions, while issuers from the industrial sector continue to dramatically increase their carbon emissions on average. Finally, we estimated that there is a 50% probability of reaching 1.5° C before 2033 if the trend observed between 2013 and 2020 continues!
Conclusion
In essence, introducing constraints or adding extra-financial objectives to portfolio construction makes the exercise more complex. Indeed, by construction, the addition of constraints reduces the universe and therefore the possible diversification of optimized portfolios. In this context, it’s important to prioritize the objectives in a coherent transition logic. These papers have tried to provide answers to two main issues. In the first one, we proposed asset-level metrics that allow the performance of an issuer towards the NZE scenario to be assessed. The objective of these metrics is to promote transparent and comparable information that will support communication between investors and corporates and a unified framework that will help asset owners and managers to define their engagement policies and their NZE investment strategies.
We have seen that the decarbonization path is more difficult and can involve a high degree of tracking error if we include scope 3 emissions. Asset owners and managers should keep this mind as they are increasingly encouraged by regulators and other stakeholders to go beyond scope 1 + 2. Additionally, portfolio alignment requires new metrics that are more difficult to estimate, implying more uncertainties about the optimal portfolio solution. As a result, these two combined factors will have significant impact on investors in the coming years and we can without any doubt anticipate large portfolio rebalancing in the future.
In conclusion, asset owners and managers must accelerate their engagement policies if they do not want to let the gap widen between both the economic and financially effective decarbonization required and the effective emissions pathway pursued by individual companies. Too much mismatch between the two decarbonisation pathways could become a significant issue for the asset management industry.