
Summary
Timing CTAs is notoriously challenging. We review the pros and cons of several allocation methods to CTAs.
CTAs exposures analysis provide valuable risk metrics, but have rarely been an efficient allocation decision tool
Tracking CTAs’ exposures to figure out whether they match one’s fundamental view and/or how they fit in one’s diversified allocation may provide a useful instant map of risks. However, using CTAs exposures as an allocation decision tool has rarely been a reliable method – unless full position transparency is available on an on-going basis.
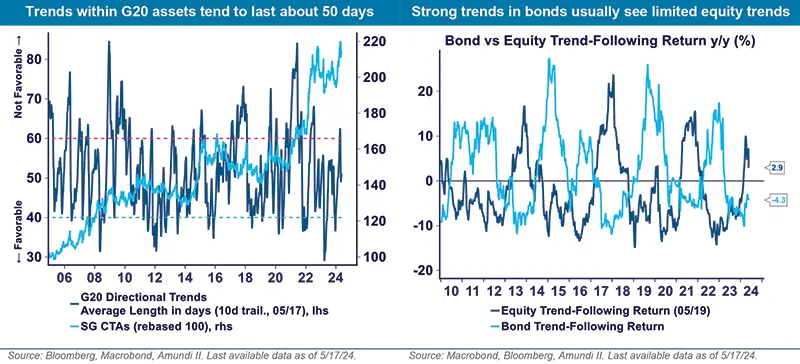
First, CTAs’ exposures change frequently. Past CTAs performance reflects maturing trends that are usually closer to their end than to their beginning. This approach also tends to ignore trends that are emerging but not yet significantly contributing to performance. On average, asset trends last about 50 days and CTAs’ reaction function tends to be inversely correlated to volatility, meaning that CTAs models will rapidly adjust during volatility spikes.
Second, this approach would naturally focus on CTA’s positions in mainstream markets while overlooking those in smaller assets or regions. Yet, we find that trend opportunities in smaller markets matter nearly as much as the ones in mainstream markets. This is the case this year with the surprising large contribution from cocoa, a market that exhibited one of the strongest trendiness this year while having been silent for the last 20 years.
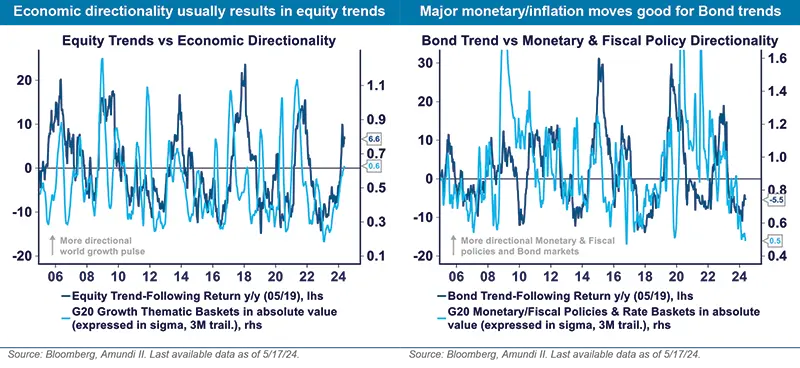
Third, trends across assets tend to be asynchronous. Periods of significant trendiness in bonds usually mean limited trendiness in equities, and vice versa (as reflected in the above right chart). Similarly, trendiness in bonds usually leads to trends in FX but only if unfolding with regional fragmentations. Trends in commodities can trigger more opportunities in bonds, but only if having significant impact on inflation. CTAs’ future performance might thus rely on a combination of trends that will soon be at odds with the latest contributors.
Fourth, allocating to CTAs is not aimed at buying a smart fundamental combination of assets, but getting exposure to trendiness. Allocating to CTAs based on their current exposures would thus artificially blend factor and asset allocation.
As of today, CTAs are positioned as follows:
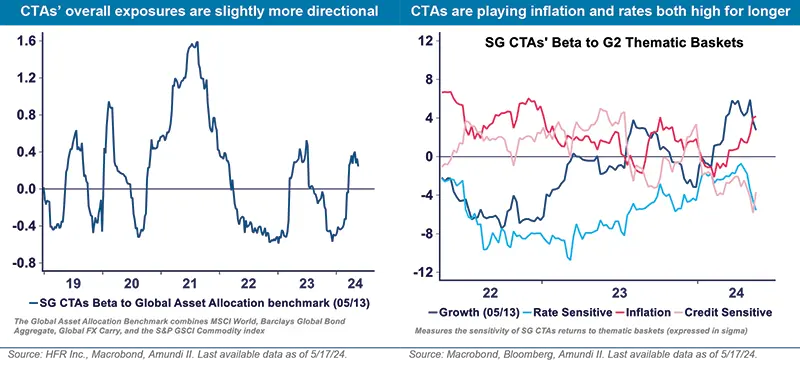
- in Equity, on average, they remain long albeit less than at their March’s peak. Their exposures tend to be more directional than usual after they closed some Asian shorts.
- in Sovereign bonds, they are slightly short on both short and long-term bonds. The exposure has remained modest as the asset class doesn’t display much trendiness anymore.
- in Credit, they reduced their long exposure but remain close to historical highs.
- in FX, they further strengthened their long dollar allocation at a level last seen early 2020. JPY and EUR are the largest short legs, even though these have been shaved off.
- in Commodities, CTAs turned long on precious and base metals, remaining long energy and short agriculturals. Their commodity exposures were deeply reshuffled in Q1 when they closed highly profitable trends.
An alternative way to sort out how CTAs’ market exposures can benefit to a diversified allocation, is to assess their implicit dominant macro scenario. This holistic approach encompasses more dynamics and includes the influence from CTAs’ smaller market positions. Current overall CTAs positions are consistent with a scenario in developed countries where inflation and rates stay both high for longer, but with economic growth staying resilient, albeit less than before and with less confidence on credit.
Another useful way to integrate CTAs exposures in portfolio construction is to verify the true diversity of independent trends they are implicitly playing. If the trends they are playing are highly correlated, they are implicitly exposed to one mega trend. The lower the correlation across trends, the better and the more diversification they bring. As of today, correlations across trends are lower than average, meaning that they favorably add trendiness diversification.
Little evidence that tactical allocations to CTAs add much value
Applying a tactical approach on CTAs is tempting, following a momentum or contrarian style. Nevertheless, we find little evidence that taking profits after CTAs’ strong runs or, conversely, buying into CTAs’ performance momentum sustainably adds much value.
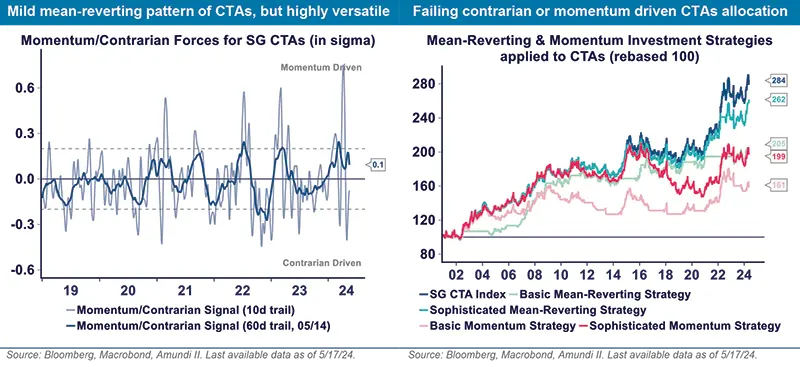
For this to work, this would require CTA returns to evidence a momentum or a mean-reverting pattern. Over the long-run, we find that they show only a very mild mean-reversion pattern, and anyway not structurally enough to make room for a rule-based allocation.
We test this allocation method applying both a momentum and mean-reverting investment strategy to CTA returns. We start with a basic approach (using simple z-scores, which measure the number of standard deviations from the mean) and then refine it with more sophisticated signals (using a variety of technical indicators). None of these approaches sustainably outperform a buy-and-hold strategy, even though more sophisticated methods help improve the hit ratio.
As of today, this approach would lead contrarian investors to shave off their CTAs position, and momentum investors to slightly add exposure.
Analysing trend-following conditions appears more effective
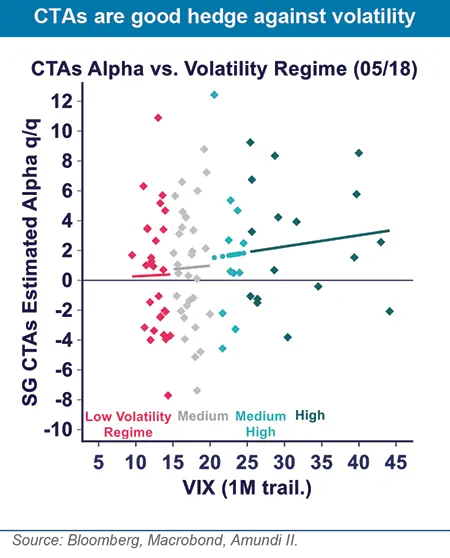
CTAs tend to do well when asset trends are at a reasonably early stage, with reasonably low cross trend correlations and exploitable volatility (i.e., neither too low nor extreme). In contrast, they suffer during episodes of market reversals. To some extent, periods of limited trendiness also hurt their performance, as they endure multiple false starts and higher transaction costs.
Our approach seeks to evaluate the quality of the current trend-following environment and sort out how sustainable it is in the short-term. For the longer run, we monitor changes at a macro level that influence the most trendiness at an asset class level. Our analysis combines 3 steps:
- We monitor the current trend-following opportunity set across a spectrum of 120 futures. As of today, we find that trendiness is reasonably supportive, with a bit more opportunities in mainstream assets than in smaller segments.
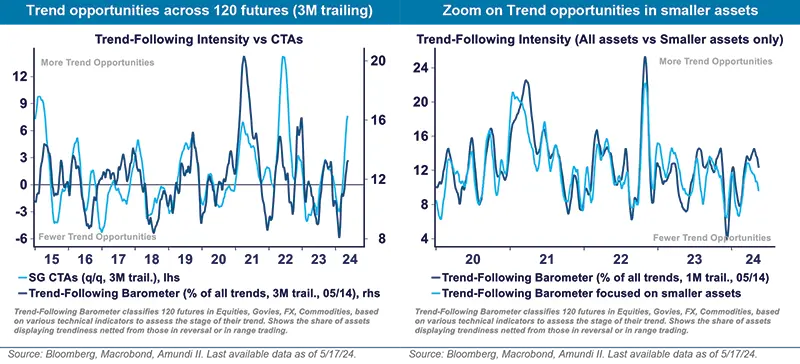
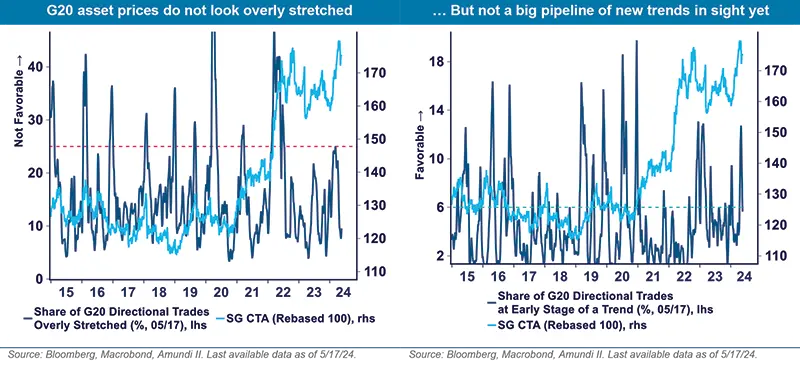
- We then estimate how sustainable the current trend-following environment is in the short-term. We assess if trends are likely to reverse or not, estimate the share of assets stuck in a range, as well as the share of assets at an early stage of a trend (i.e., the pipeline of future trends). We look at these signals across directional trades within G20 markets and complete the review with a similar analysis applied to a wide pool of cross relative trades. While these relative trades would likely not be implemented by CTAs, they provide a valuable cross-check on market dynamics. A sample of these indicators is plotted below.
As of today, the environment looks average. Directional trades are not overly stretched in aggregate, and there isn’t a disproportionate share of assets caught in a range. A similar balance exists within the universe of relative trades that we monitor, with no sign of widespread correlation anomalies that could trigger a market rotation. On the negative side, it appears to be a modest pool of new trends currently shaping up (as markets assess the timing of monetary rate cuts).
- On a longer-term horizon, we assess whether the economic cycle favors trendiness or not. Directional phases of the cycle (late cycle, recession, and recovery phases) are usually more favorable for CTAs than mid-cycles. However, other macro tectonics matter as well. Typically, episodes of significant monetary and inflation moves tend to favor trendiness in bonds, while changes in economic growth matter more for equity trends. Geopolitics and supply shocks tend to impact commodities the most, as well as economic growth to some extent. There are usually more FX trends when world economies are going out of sync and to some extent when the dollar is not the sole currency marker. Beyond trends in asset classes, the degree of macro and market correlation and the volatility regime also influence CTAs’ overall level of exposures and thus returns.
While this approach provides useful leads for CTAs, it doesn’t encompass all the drivers of trendiness. It misses a number of more micro developments, such as changes in industrial trends that may have macro repercussions or idiosyncratic events that may impact trends in smaller assets.
At the current stage of the cycle, CTAs would be attractive. As of today, though, the environment looks balanced, pointing to trends concentrated in equities, with more limited opportunities in FX (as dollar remains in the driving seat), and tiring trend in mainstream commodities. Trends in bonds remain mediocre due to frequent market reversals, but should improve as bond prices start to better reflect diverging countries’ growth/inflation mix.
Beyond the influence of macro changes, CTAs’ agnostic investment style looks attractive today amid uncertainties regarding the world macro scenario and its sequence. Systematic CTAs models pick trends when they spot them regardless of the fundamentals and without emotional distortion. They are thus the best remedy to the ‘Fear of Missing Out’ effect. In contrast, discretionary top-down managers bear a greater chance of missing opportunities when macro uncertainty rises, as they might choose to size down or maximize hedges on their positions, or wait for better entry points that might not come.
Maintaining a core position on CTAs might not be a bad choice after all
|
Investors might be better off with a core allocation to CTAs, for at least five reasons. Second, they bring diversification in portfolios. They show limited sustainable correlation with most traditional assets, and nicely diversify portfolios of hedge funds. Third, they provide access in a liquid way to smaller market segments, in particular in agricultural, metals, and assets of smaller countries that a majority of investors would not cover. |
|
Fourth, CTAs benefit from high cash rates. They structurally maintain only a slight net long overall market bias (0.3 beta today and over the long run), which represents the balance of their long and short futures positions. They ‘mechanically’ earn a cash yield on their short futures. We estimate this contribution to level above 2% per year at the current level of cash rates.
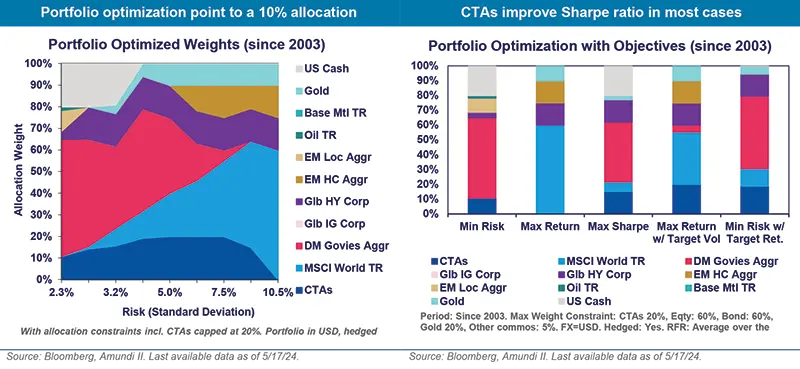
Finally, CTAs optimize portfolio allocation over the long-run. We find that a core CTAs holding in a diversified allocation tends to reduce volatility while slightly improving returns. Below, we determine the efficient frontier and the optimized CTAs allocation in a global allocation. A 10% allocation to CTAs improves Sharpe ratios in most profiles.
For investors who do not benefit from regular transparency on CTAs or who do not have the resources to deep dive into the quality of the trend-following backdrop, maintaining a core allocation to CTAs is a valid alternate option.
Hedge Fund Indices Performance
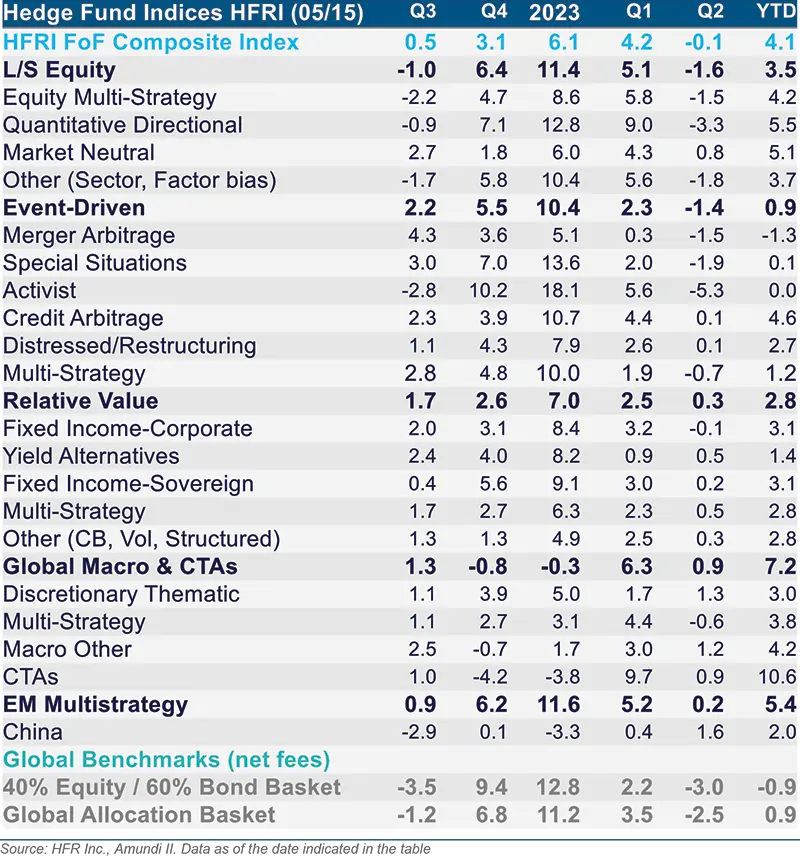
The index returns are provided for purposes of comparison and include dividends and/or interest income. The indices are unmanaged and fully invested. Although information and analysis contained herein has been obtained from sources Amundi AM believes to be reliable, its accuracy and completeness cannot be guaranteed. Investors cannot invest directly in indices. The indices referenced herein have been selected because they are well known, easily recognized by investors, and reflect those indices that Amundi AM believes, in part based on industry practice, provide a suitable benchmark against which to evaluate the investment or broader market described herein.
Index Description
Other L/S Equity: equally weighted performance of HFRI Equity Hedge: Sector - Energy/Basic Materials, Technology/Healthcare
Other Relative Value: equally weighted performance of HFRI Relative Value: Fixed Income-Asset Backed, Convertible Arbitrage, Volatility
Other Macro: equally weighted performance of HFRI, Macro: Active Trading, Commodity, Currency
HFRI indices: for a comprehensive description of the HFRI indices used in the above table, please refer to the index description on HFR
website: https://www.hfr.com/hfrx-indices-index-descriptions
Global Benchmark Description
40% Equity/60% Bond Basket: Combines the MSCI World and the Barclays Global Bond Aggregate
Global Allocation Basket: Combines the MSCI World, the Barclays Global Bond Aggregate, Global FX Carry in USD, and the S&P GSCI
Commodity index. All indexes are in USD unhedged. Gross of fees and taxation.
Authors