Summary
Introduction
As the war unfolds in Ukraine, the understanding of its impact on the global economy is changing rapidly and some excellent analysis has already been produced. In this paper, Amundi Technology and Amundi Institute have used the Causality Link platform to analyse the current state of our international situation in order to provide some projections regarding the future. By combining technology, information access, artificial intelligence (AI) and research, Amundi has the capacity to analyse in real time the impacts on the global economy. Two elements stand out from our analysis:
- First, European car manufacturers have been hit badly by the supply chain fallout of this war, with no relief in sight.
- Second, a predictable food shortage (mainly regarding wheat) will hit Africa in the coming months and years and will exacerbate an already difficult situation due to the recurring drought issues – in Egypt and Yemen, in particular.
This is by no means an exhaustive description of the consequences of the war, but a demonstration of the power of Natural Language Processing (NLP) applied to over 50,000 texts per day in 27 languages, with a focus on real-time causal link extraction. The Causality Link platform relies only on the automatic processing of news, which provides a unique ‘wisdom of crowds’ point of view. Such evidence can help provide a deeper understanding of AI processes regarding the global economy. This paper is the result of a collaboration between Amundi Institute, Amundi Technology and Causality Link
Multi-faceted analysis
- Immediate angle, corresponding to the revenue decline of companies that cease to do business in Russia or with Russia;
- Intermediate angle, which corresponds to predictable impacts of shortages of commodities, agricultural products or industrial components that were provided by Ukraine or Russia; and
- Long-term impact – that is, 2023 and beyond – as far as this can be predicted now. We do not focus on companies that are headquartered in Ukraine or Russia, as the disruptive effects on these companies are different than those for other companies in the world.
Before we dive into the different angles, it is important to look at a big picture of the impact of the Ukraine war. Figure 1 on the following page shows the results of a request about the causal links between the war and its consequences, where we have only retained the most mentioned links, and shown only the industry and KPI results. We have then coloured the results by KPI: risk is green, prices are tan and production is purple. We have also selectively shown the most important cross-links. Our current causal chart contains about 44 million causal links and therefore some creativity is needed to display the fraction that best answers a specific question. However, it takes only a few seconds to query the data lake and obtain a result, which can be updated in real time.
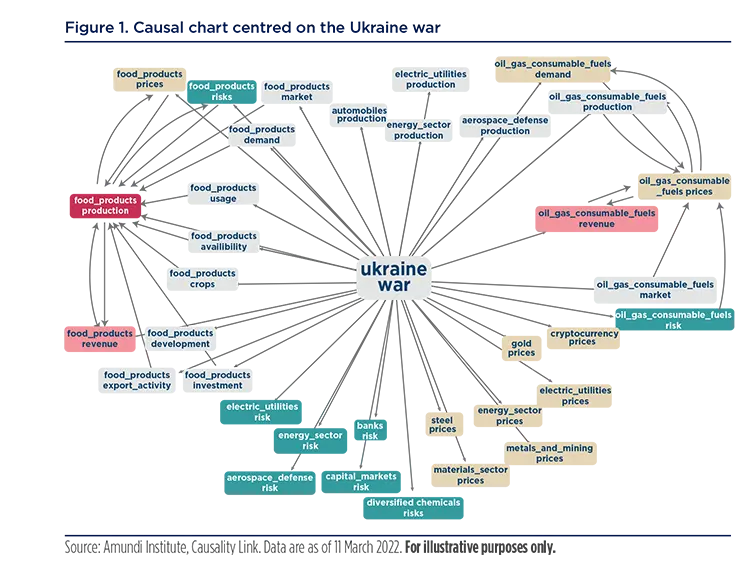
This chart answers the question regarding the industries for which production is most impacted: automobiles, electric utilities, energy and aerospace, and defence. We have not indicated whether they were impacted positively or negatively, but only that information is available inside the causal graph. Two industries (food and oil) emerge as sufficiently significant to produce intermediate causal links: between the war and food production KPIs, on the one hand, and between the war and oil prices, on the other. In a sense, this indicates that the causal pathways explaining the impact of the war on food production, for example, are multiple and paint a bleak picture regarding the future of global food production or oil prices.
The causal pathways explaining the impact of the war on food production are multiple and paint a bleak picture of the future of global food production or oil prices
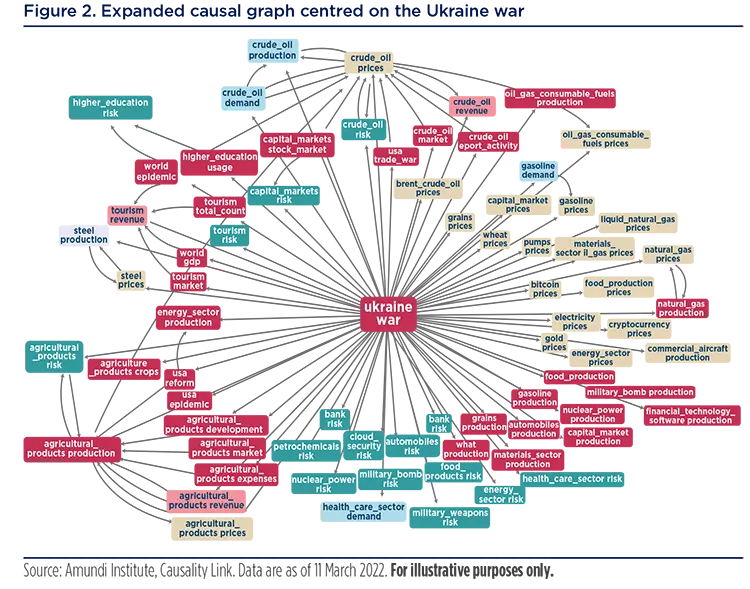
Figure 2 shows the same graph with more detail. For example, ‘food products’ are decomposed into ‘food_products’ plus ‘wheat’ plus ‘grains’ plus ‘agricultural_products’. This decomposition is the result of the visualisation of agricultural products with the highest number of mentions in the graph. It is easy to see how complex the graph can quickly become and the value of the node aggregation mechanism we use. All nodes could be made clickable to enable navigation at any level in this complex causal diagram. Interesting highlights found in this graph include the additional impact of the war on tourism, which was previously mostly impacted by Covid-19, the impact of the war on gold, and bitcoin, increased cloud security, agricultural products, and nuclear power risks.
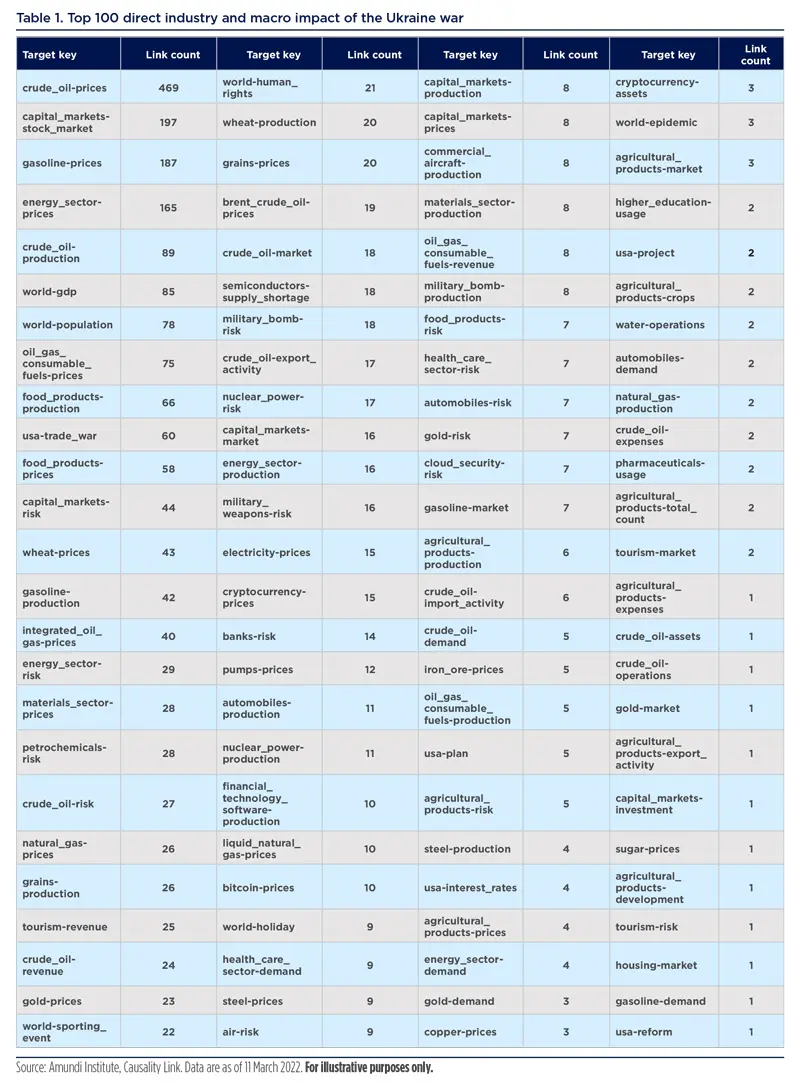
When graphs become too complex, it is always possible to revert to the tabular format. In table 1, we explored the number of causal links between the war and the top 100 indicators detected during 2022. The names of these indicators are composed of the industry (such as ‘gasoline’ or ‘wheat’) and the KPI (such as ‘prices’ or ‘production’). Indicator detections contain a lot more information, but this aggregated point of view conveys the essence of the impact on a variety of industries and KPIs while the count of links provides a good assessment of the relative interest in our corpus for each of these impacted combinations.
Immediate angle
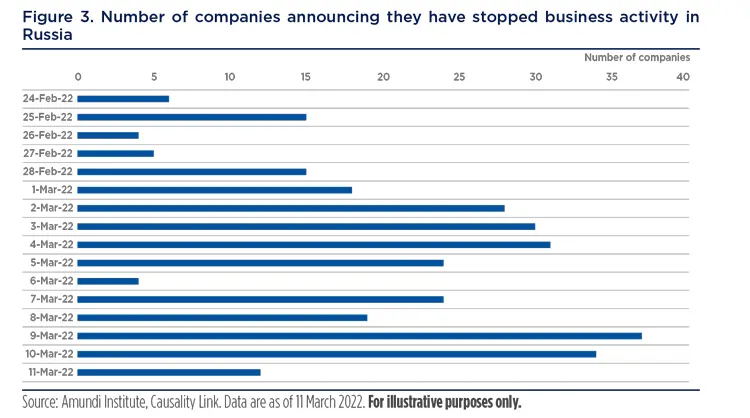
We now turn our attention to the direct impact of companies that have ceased activities in Russia due to this Ukraine war. A growing number of public companies have announced in past weeks that they would stop operations in Russia. We display in figure 3 the daily count of the companies that have already made such an announcement.
The variety of the industries touched by the companies that are shutting down gives a good idea of the pain inflicted by these sanctions for consumers in Russia.
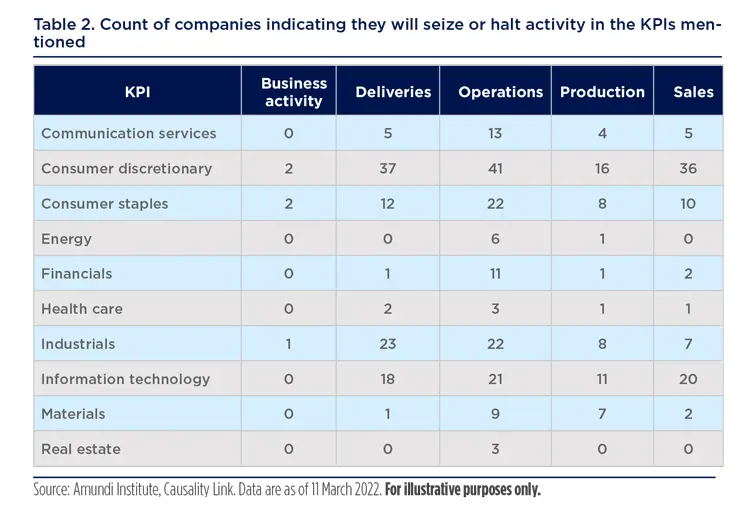
We can get a more precise idea of the types of shutdowns by looking at the mentioned KPIs. This is shown in table 2, where we have split this between business activity, deliveries, operations, production and sales. Not all companies were manufacturing in Russia, which explains why the production column has fewer entries than operations or sales. The variety of the industries affected by the companies that are shutting down gives a good idea of the pain inflicted by sanctions on Russian consumers (consumer discretionary, consumer staples and part of industrials). However, one can also wonder about the coming impact on the Western world of such a large number of industrials or information technology companies closing shop in Russia.
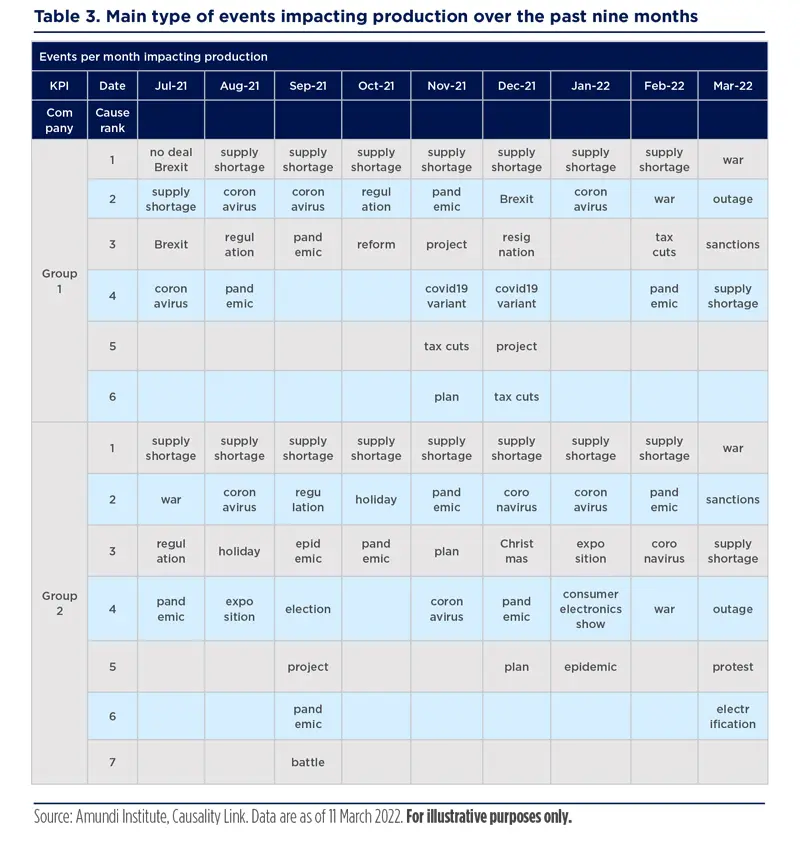
Our causal links for specific companies can also be used to examine the evolution over time of the main events impacting the production of these companies. We selected two major European car manufacturers that have been extremely impacted by this war and show in table 3 the evolution over the past nine months of the events that were most mentioned in our corpus as impacting their production. The first conclusion we reached is that for both companies, the (semiconductor) supply shortage was the main event impacting their production until March 2022, when it has been replaced by war and sanctions. Semiconductor shortage concerns have not disappeared, but they have been superseded by the consequences of the war. The semiconductor shortage itself might be made worse by this war in the coming months.
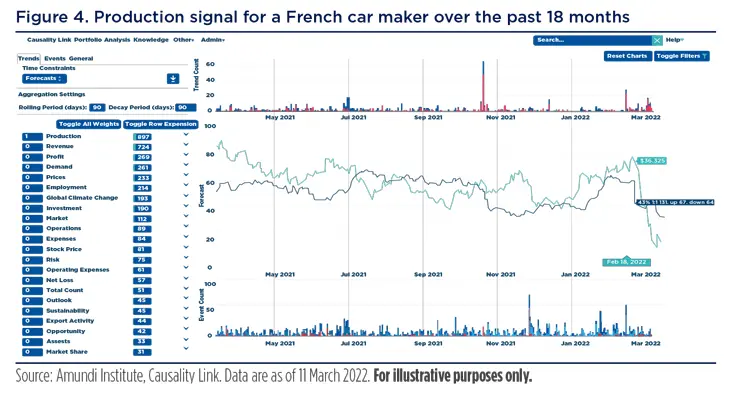
A French car maker – whose stock price is represented by the green line in figure 4 – has suffered from the microelectronic chip shortage over the past two years, and the Q3 results announcements in October 2021 brought the production indicator (blue line) into negative growth territory. The situation forced the car maker to announce on 18 February 2022 that the shortage would reduce its 2022 production by 300,000 units compared to 2020 and by 500,000 units in 2021. This piece of news hit our future production indicator. The issue has been compounded by the Ukraine war, especially because the French car maker owned a Russian car manufacturer, which planned to produce 265,000 Lada in 2022, but halted its production in Russia in the second week of March. This brought its stock down significantly, causing a second dip in our future production indicator.
Intermediate angle
Our intermediate angle of analysis focused on a rapidly growing story of supply-chain issues. Over the past three years, the automotive industry has been hit by the electric vehicle (EV) transition, Covid-19-related issues, a semiconductor chip shortage, and protests in Canada. It now faces a potential cascade of shortages and plant closures linked to the Ukraine war. Auto plants of major European and Japanese car makers located in Russia and Ukraine had to close due to shortages of imported parts. This shortage proved particularly acute for a Dutch auto maker – created in 2019 out of the merger of two larger European car makers – which as recently as 25 January 2022 was planning to export vans made in its factory in Russia to the rest of Europe. Also, a French car maker – which has had a majority ownership stake in the Russian manufacturer of the Lada brand since 2016 – had to close its plants on 9 March due to the lack of spare parts.
The disappearance of the flow of parts manufactured in Ukraine, such as wiring harnesses, has forced two German car makers to shut their plants in Eastern Germany. There is no doubt that the shortage of manufactured parts from Ukraine and Russia will hit the European manufacturing industry in general due to the widespread nature of the supply-chain network and the growing strength of Ukraine’s industrial production in recent years. This fallout should last for quarters, if not years, because many of these plants will have to be rebuilt, be it in Ukraine or in other countries. A third wave of issues will eventually come from the consequences of a looming shortage of raw materials. Neon and palladium have been mentioned as most critical for the manufacturing of semi-conductors. Ukraine was producing the majority of the world’s semiconductor-grade neon (itself a by-product of the steel manufacturing plants in Russia and Ukraine), which is required for the operation of modern lithography machines used in semiconductor plants. The consequences of this neon shortage will be felt as an increased semiconductor shortage in the United States within a few months. The commodity shortage driven by the Ukraine war also includes palladium – used both for semiconductor manufacturing and for the catalytic converters of diesel-powered cars – as well as nickel, which is used in EV car batteries. We are learning every day of the Western dependence on Russia for the production of even more esoteric specialty materials, such as synthetic sapphire. Some 40% of the global synthetic sapphires required in semiconductor manufacturing are produced in Russia. This grim picture for European car manufacturers is weighing on the future outlook of their regional parts suppliers, whose production is linked tightly to the just-in-time production model of car companies.
The downstream impact of fertilizer on food production for the world cannot be underestimated.
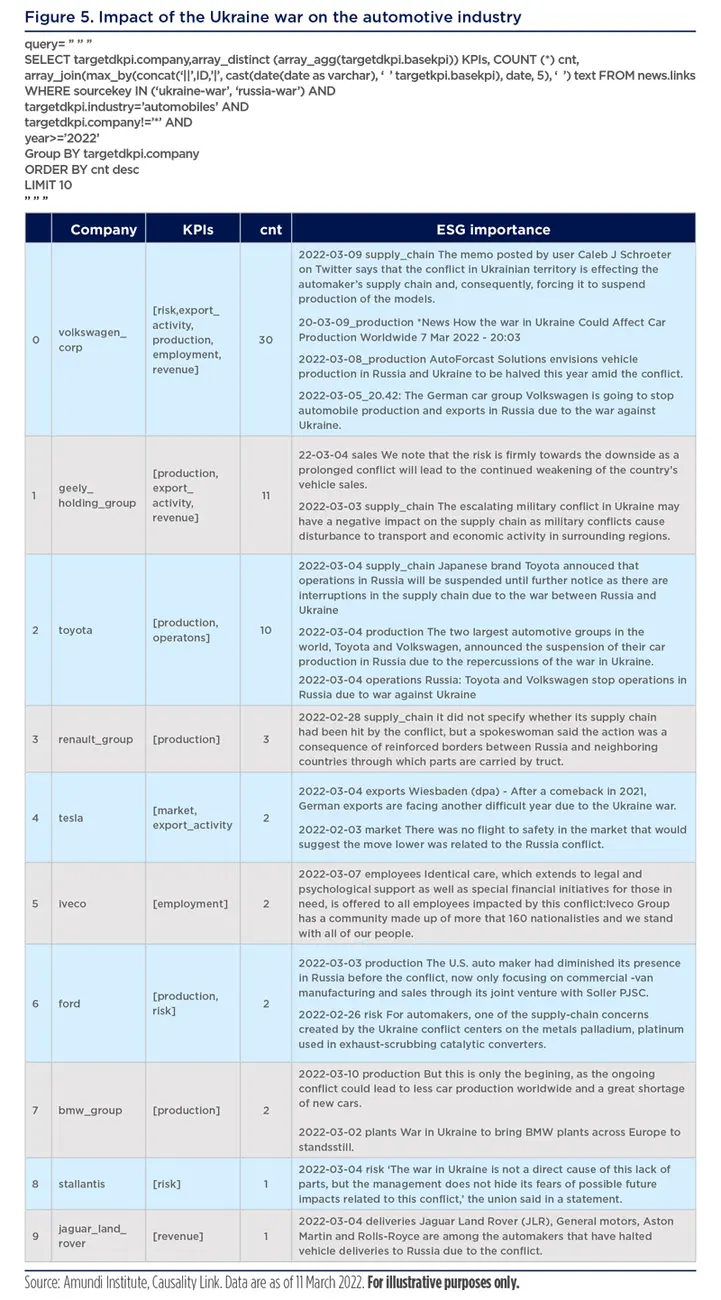
While these issues will impair car production – mainly in Europe – it remains to be seen if demand for new cars will resist high oil prices and growing concerns about inflation. As most of the traditional car manufacturers had embarked on large investments to migrate their product lines to EV, such a revenue and demand squeeze could not happen at a worse time. These current and predictable headwinds have been partly reflected in the recent drop in the stock prices of most car manufacturers globally. The situation should be monitored carefully as new, unexpected consequences from the Ukraine war unfold almost daily. In figure 5, we show sentences produced in 2022 about the impact of the war in Ukraine on the auto industry. We have also attached the simple 14-line SQL query that extracts these causal relationships from the Causality Link real-time data lake. It is easy to imagine how such queries can be packaged in an easy-to-use user interface.
While this chapter has been focusing on the car industry, because it is important and has been massively impacted by the conflict, the same analysis can be performed on any other industry, from commodities to telecommunications and software development services. The Causality Link ontology today covers over 3,000 different industry segments which can be aggregated into GICS sectors or analysed individually.
Long-term impact
For our long-term analysis, we use a new methodology relying on the selection of a crucial intermediate element – the fertilizer industry. We analyse the upstream and downstream components of that element to understand the price dynamics and availability of fertilizers as well as their impacts on downstream industries and companies. This ‘bottleneckoriented’ analysis provides only a partial view regarding the impact of the Ukraine war, but it can be a guide for a more exhaustive analysis which would scan through the most powerful bottlenecks to cover the entire economy, such as electricity, semiconductors, financial exchanges and information.
Three days before Russia’s invasion of Ukraine, we were alerted by the first text (in Spanish) linking the Russian-Ukraine war to the cost of producing food in Mexico through the price and supply of nitrogen fertilizers. Adrian Duhalt, post-doctoral fellow at Baker Institute, noted that “Russia was the most important (fertilizer) supplier, so any interruption or decrease in supply – resulting from conflict or trade policy – would put Mexico in trouble”. Since then, many people have mentioned this connection, notably Svein Tore Holsether, CEO of the world’s second-largest ammonia production company (Yara), warned on the fourth day of the conflict: “Now there is additional disruption in supply-chains, and we are approaching the most important part of this season for the northern hemisphere, where a lot of fertilizer needs to be moved and most likely that will be affected”. On 9 March, his company announced that the rapidly increasing price of natural gas would force them to reduce production in Europe to 45% of capacity.
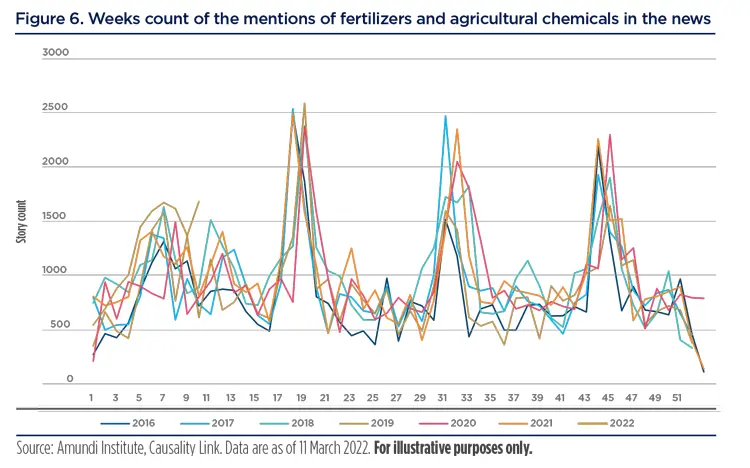
These two combined factors – reduction of fertilizer exports from Russia and the reduction of production of fertilizers by Western manufacturers of ammonia, due to the increase in the price of natural gas – will have a significant negative effect on the supply of fertilizers for agriculture in 2022 and will lead to a strong increase in the price of this commodity. The importance of this bottleneck has been talked about in the news, as demonstrated by the fact that mentions of the fertilizer industry are already at the highest level in seven years for the same period, as shown in figure 6. Given this growing interest in the fertilizer industry, we can use causal relationships expressed in text to look to the upstream causes and downstream impacts of the modifications in fertilizer prices and supply. The downstream impacts of fertilizer in food production for the world cannot be underestimated. Half of the world’s population gets food from the use of fertilizers, and in many cases, the absence of fertilizers can reduce yield by up to 50%. Swein Tore Holsether, CEO of Yara, stated on 6 March: “For me, it is not whether we are moving into a global food crisis, it is how large the crisis will be”. He highlighted in particular that a quarter of the key nutrients used in food production in Europe came from Russia. Several publications have compared the current situation to that of the 2011 Arab Spring, given that a significant share of the wheat going to Egypt and other African countries came from Ukraine, where crops may not be planted in time due to the war. Any additional reduction in yield of food production in the world due to lower supply of fertilizers or increased cost of the commodity will have widespread and unpredictable impacts. A positive note relates to the relative advantages of sustainable agriculture, as the development of improved and not genetically modified varieties of agricultural crops could help reduce the use of pesticides and fertilizers and the high prices of natural gas will encourage a number of companies to accelerate their efforts towards the production of ‘green ammonia’ and decarbonised food value chains. To understand who is active in that space, we ranked companies in the agricultural products industry by a simple measure of relative frequency of detection of ESG KPIs vs the profit KPI in the context of these companies. Figure 10 shows the ten best and the ten worst companies.
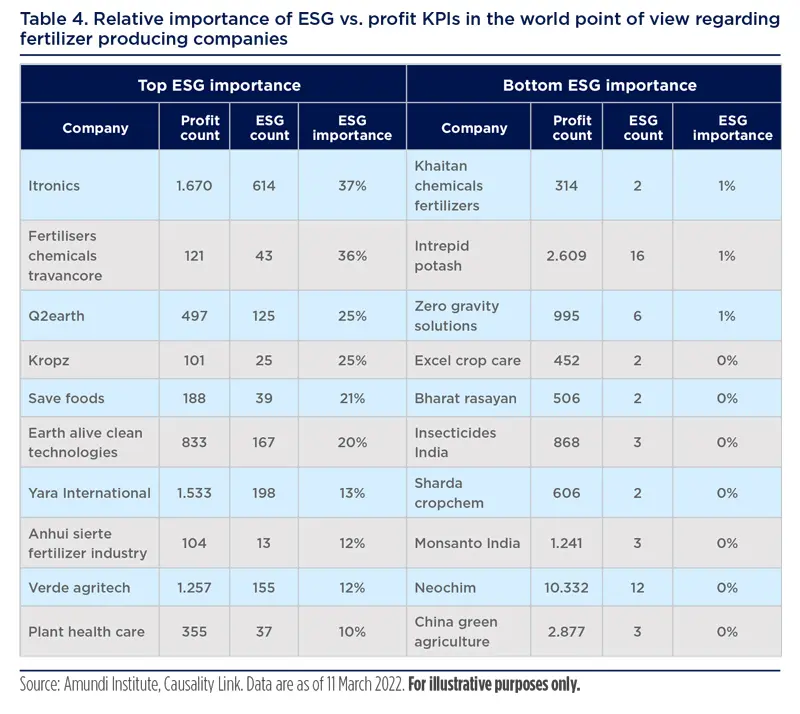
It appears that ESG issues and prices for natural gas and energy are pushing fertilizer companies to invest in more energy efficient methods than the traditional fuel-intensive types used to manufacture fertilizer components. Mitsui, for example, notes “… as the world embraces the energy transition, we will work closely with our new partners to jointly develop new hydrogen markets and applications for low-carbon ammonia …”, while CGS International has a product line with the highest concentration of seawater-harvested minerals available on the commercial and even the retail market. In a sense, the current difficulties the fertilizer industry faces will accelerate its migration towards more environmentally sustainable practices, which were required by the fight against global warming and to reduce their supply-chain dependence.
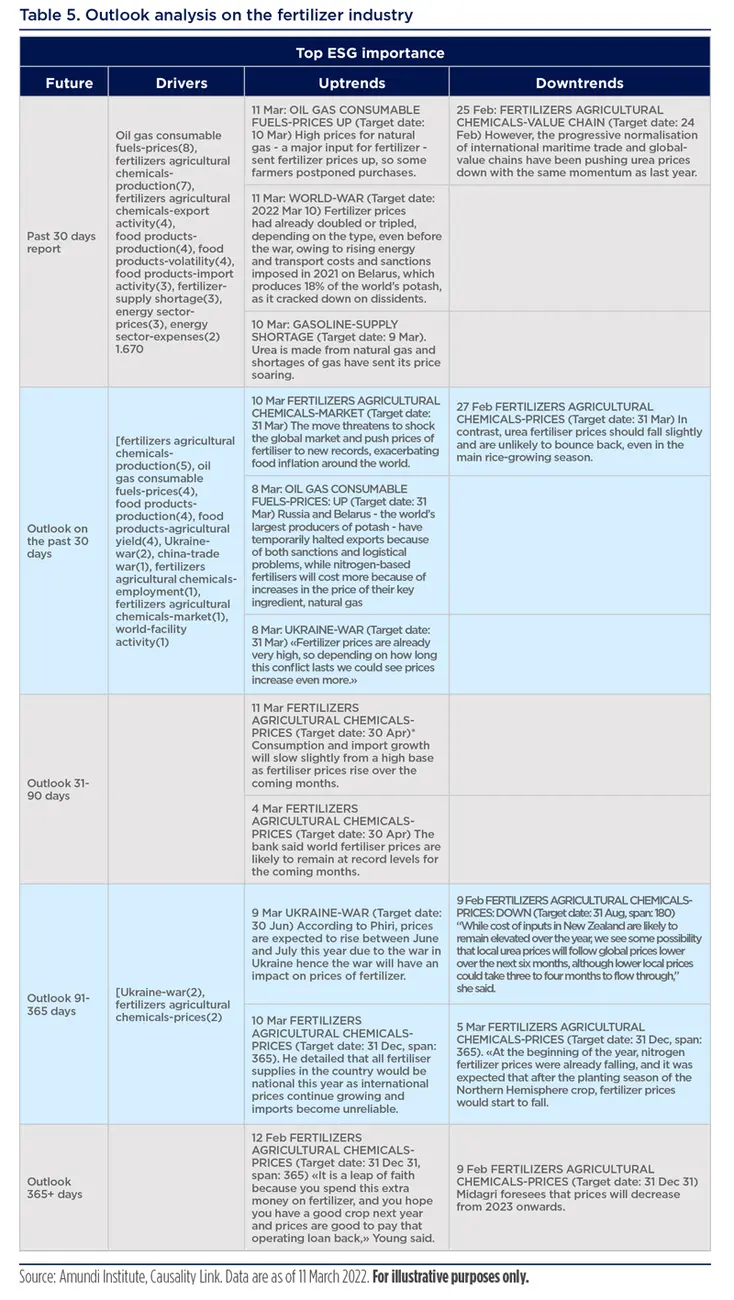
Turning to the evolution of the price of fertilizers, the short-term consensus about the shortage and rising prices for fertilizers gives way to a breadth of opinions. Poland’s agriculture minister noted: “Polish fertilizer prices are unlikely to decline within twothree months”. According to Mbawaka Phiri, the administrative officer of the Fertilizer Association of Malawi: “Prices are expected to rise between June and July this year due to the war in Ukraine; hence the war will have an impact on prices of fertilizer’. Others are more positive, with an extended price decline generally starting at some point in April and extend into late summer. Finally, Carolina Ramírez, director of Economic Studies of the Ministry of Agrarian Development and Irrigation in Peru, foresees prices decreasing from 2023 onwards, possibly due to the installation of a local fertilizer plant based on Bayovar phosphates in Piura.
The above table is a good example of the type of knowledge aggregation that is performed in real time by the Causality Link platform from articles published all over the world into a single view for any industry.
Conclusion
This report shows that (as of 14 March 2022) the impact of the Ukraine war on Western economies will be massive. The European car industry is impacted through extensive perturbations of its supply chain. In the long term, a predictable food shortage will have a destabilising effect on many African countries and will contribute to a rise in inflation in Western countries. This report also shows that the situation is evolving so rapidly that real-time reporting and monitoring becomes crucial to understanding the implications of the multiple perturbations of our economic system that are unfolding daily. The advantage of the Causality Link approach is that this update is permanent – e.g., as news arrives, it is aggregated into a global view of thousands of newspapers in 27 languages as well as in government publications. This ‘wisdom of crowds’ approach applies to the forecasts related to many indicators, such as prices, production, profit, GDP, inflation rates and exchange rates, but also to the causal links between these detections, enabling analysts to focus quickly on emerging topics that will drive the next narrative.
The impact of the Ukraine war on Western economies will be massive. In the long term, a predictable food shortage will have a destabilising effect on many African countries and will contribute to a rise in inflation in Western countries.
More information about...
Causality Link
Based on its advanced AI-driven research platform, Causality Link helps investment research professionals produce smarter decisions by better understanding the ‘causal links’ between their subjects and various market indicators. Causality Link was formed based on the idea that long-term success in AI and Machine Learning requires a balance of human and machine collaboration that leverages the strongest qualities in each. Causality Link’s platform merges explicit expert knowledge of causation – not simply correlation – with the mathematical power of predictive analytics, enabling professionals to gain big-picture understanding of the financial markets. Visit www.causalitylink.com to learn more.
In 2022, Amundi Technology, a provider of innovative technology and services to asset managers and the savings industry, selected Causality Link to provide insights into drivers of ESG investment performance. Using the Causality Link platform, Amundi will explore the future potential ESG performance of companies, industries, and other key performance indicators (KPIs) of interest. Insights from the platform will augment Amundi’s current offerings to asset managers and institutional investors worldwide, giving a real-time picture of global markets derived from millions of documents processed by Causality Link’s AI-powered platform.
Amundi Technology
Amundi Technology designs, develops and offers cutting-edge technology solutions to the savings industry. The solutions are software, available in cloud mode, which meet the needs of all financial institutions, including asset managers, institutional investors, private banks and custodians. Amundi Technology is composed of 800 people based in two technologies hubs in Paris and Dublin, and in 19 countries.
Amundi Institute
In an increasingly complex and changing world, investors have expressed a critical need to understand better the environment and the evolution of investment practices in order to define their asset allocation and build their portfolios. This environment includes economic, financial, geopolitical, societal, and environmental dimensions. With the aim to provide a holistic view of the main challenges that investors face today, and to stimulate ongoing debates and client dialogues, Amundi has created the Amundi Institute. While being at heart of the global investment process, the Amundi Institute’s goal is to provide thought leadership, to strengthen the advice, training, and dialogue on these subjects on all assets, including real assets, for all its clients -- distributors, institutions, and corporates. Amundi Institute’s goal is to project Amundi’s views and investment recommendations. It is also responsible for conveying Amundi’s convictions and its investment and portfolio construction recommendations, furthering its leadership in these areas.


