
Summary
Executive summary
Share buybacks have become a standard corporate tool in achieving capital efficiency. In a share buyback, a company buys its own shares from existing shareholders, and thereby distributing capital to them in an alternative way to dividends. The practice was banned in the US until the early 1980’s when SEC formally set out the regulation, and eventually it spread globally. This growth has taken place despite some concerns that share buybacks were being used for management’s personal gain at the expense of long-term growth. Critics have also suggested that they have dampened innovation and encouraged excessive leverage levels.
To provide an overview of this activity, as well as examine these concerns, we explored the data since the Global Financial Crisis (GFC) in the US, Europe and Japan. Given stretched US valuations, Europe is now ahead of the US in terms of the combined buyback and dividend yields, and thus the region is gaining a reputation for placing its shareholders’ interests first. Meanwhile, Japan has been gradually catching up as regards shareholder renumeration and was on par with that of US shareholders before overtaking it recently.1
A key question is whether there is any optimal allocation between investment (i.e. capital expenditure and R&D) and the payout ratio (i.e. dividends and buybacks relative to net income). An increasing focus by investors over recent years on buybacks and dividends, as well as executives’ compensation being partly in stocks, could have resulted in an investment decline. Yet, in our assessment, we have not identified any evidence of this, nor the existence of an optimal allocation. The US has the highest distribution rate, but investment has continued, while the European payout ratio has been similar to the US ratio, but investment has fallen. Turning to the large cap companies, the US magnificent seven’s (M7) investment efforts have increased every year, despite high and rising payout amounts. However, there has been little change in the level of investment or payouts among the large European companies (GRANOLAS).2
Finally, we draw out some practical takeaways:
|
Europe is gaining a reputation for placing its shareholders’ interests first. This, alongside relatively modest market valuations and lower market concentration risks, increases the appeal of European equities.
Share buybacks are now a global practice despite critics
Share buybacks have become a standard tool due to their attractive tax treatment and flexibility. Investors frequently prefer buybacks as they are taxed on realised capital gains on a lower rate than that applied to income (dividend). Also, they can be reduced, or cancelled easily, unlike dividend that is perceived as a recurring distribution of income. Fast-growing companies therefore tend to favour buybacks while more mature companies will prefer dividends.
Although buybacks attract criticism, they are usually not linked with weak returns, according to a Bank of International Settlements’ (BIS) quarterly review.3 This claims that ‘after accounting for broad risk factors, US long-term stock returns are typically positive after buyback announcements and higher than those of non- repurchasers’. Also highlighted is the view that companies with bonuses tied to EPS targets achieve returns in line with those of comparable businesses that do not engage in the activity.
Buybacks are a subject of criticism There are several key criticisms of share buybacks. They can increase the risk of company executives trading around buyback announcements. However, in the US, the SEC rule 10b-18 (1982) established some criteria to limit these risks. There are also concerns that executives could be tempted to use buybacks, not only to avoid dilution linked to stock options, but also to increase earnings per share (EPS) more than what would be optimal. This can help them to hit quarterly guidance targets and inflate their own compensation metrics. Furthermore, they can be overly confident about their abilities, assuming that the future performance of the company will continue to drive their share prices higher. This can result in buybacks taking place at peaks in share prices, rather than at lows. Finally, a link to leverage is sometimes a source of worry. The BIS review highlighted that the risk of buybacks to companies’ performances is through the leverage figure. Management can use buybacks to achieve a specific leverage target, but the long-term impact of such a strategy on a company’s value is not clear. For example, greater leverage is associated with a higher default risk, but this is usually not an issue in normal times. It can, however, become one during challenging times, as was seen during the 2020 Covid crisis. The advice is to avoid over-indebted stocks over the long-term. |
Long-term stock returns are usually positive after buyback announcements.
Also, companies with bonuses tied to EPS targets, which may be incentivised to do buybacks, achieve returns in line with those of peers that do not engage in the activity.
Broad view of US, Europe and Japan
For a long time, Europe and the US were close in terms of shareholder total return, with the US engaging in more buybacks and Europe paying more dividends. Since the Covid crisis, the combined US yield of buybacks and dividends has fallen below that of Europe, which also reflects the valuation gap between the two regions on other variables. For example, the US market’s Price Earnings Ratios (PERs) of market capitalisation weighted indices is higher than those of its European counterparts. The more widespread practice of US buybacks has also helped to widen the EPS growth gap between the two regions, as well as other factors such as sector composition (i.e. the US market has a higher exposure to growth stocks). As for Japan, shareholder return has been rising slowly since the start of Abenomics (2013) and was on par with that of US shareholders before overtaking it recently.
Regionally there are some key trends emerging (see Appendix 1 for more regional details):
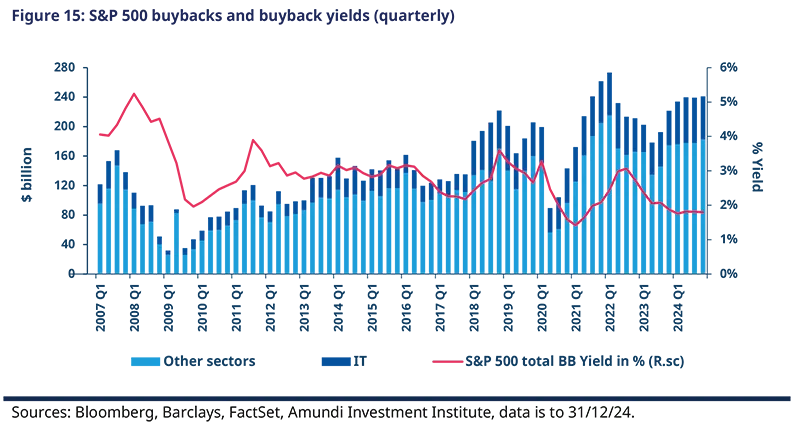
US - S&P 500 buybacks: Despite rising amount, the buyback yield declined in 2024 due to the market rally. IT is still a dominant contributor, but we have seen a broadening of activity resulting in a more diversified buyback universe.
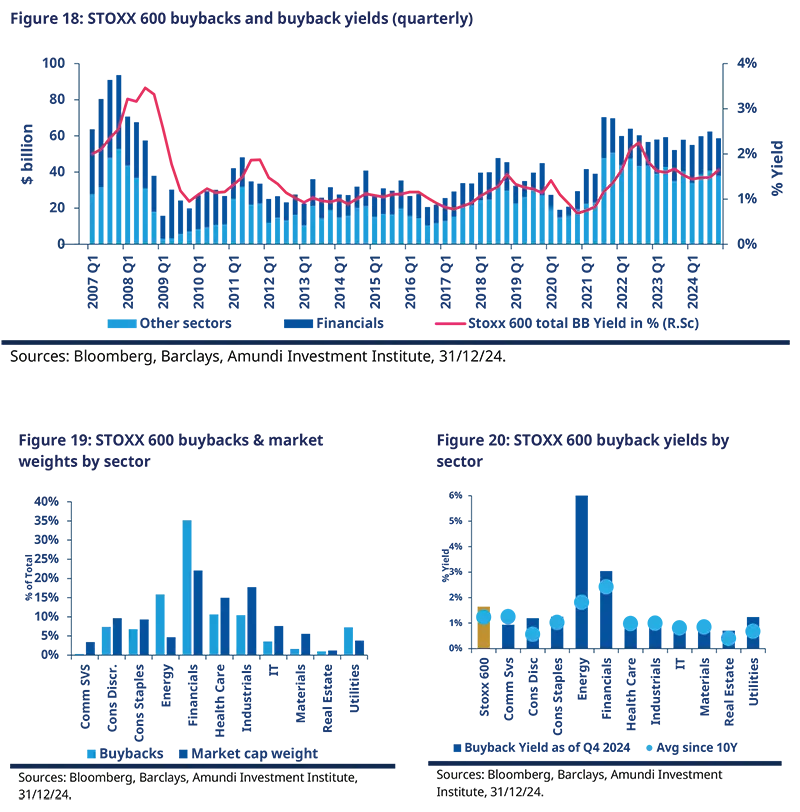
Europe - STOXX 600 buybacks: EU buybacks stabilised in 2024, while the buyback yield rose somewhat to just above its average since 2007. Financials remain by far the biggest contributor to buybacks.
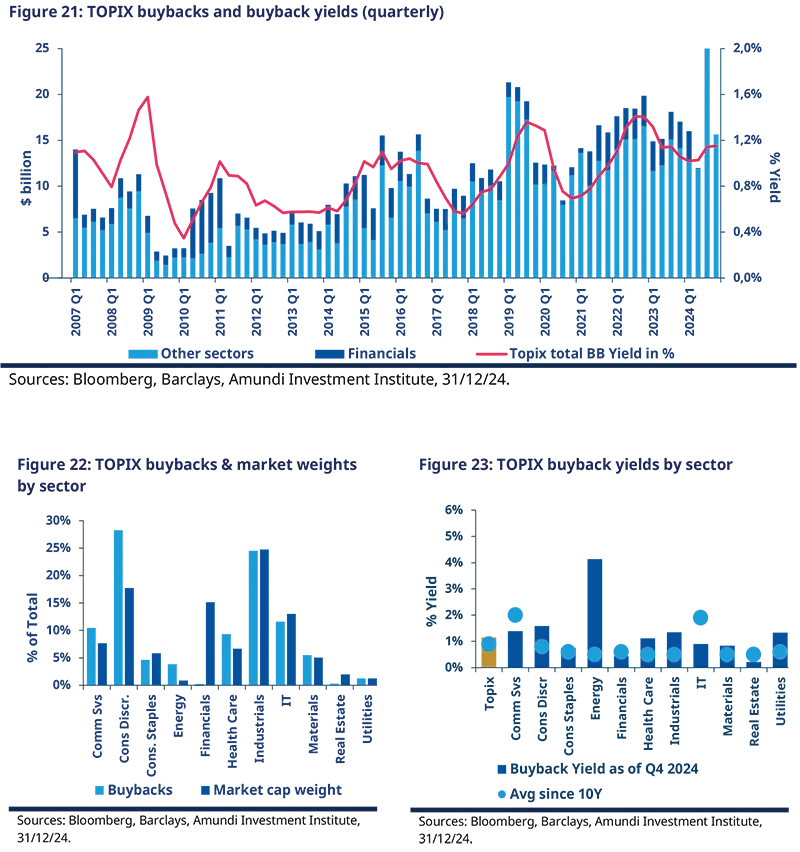
Japan - TOPIX buybacks: In Japan, buybacks have been more volatile over 2024, and the buyback yield has risen from the 1Q24 trough. Sector participation has been broad, led by the consumer discretionary and industrials sectors.

A combination of rising share buybacks and generous dividend payments is ensuring that Europe is now the most attractive developed market region in terms of shareholder renumeration. The yield gap shows scope for further outperformance from here.
Giving the increase in dividends and buybacks globally, a key question is whether there is any optimal allocation between investment (i.e. capital expenditure and R&D) and the payout ratio.
An investor’s perspective on buybacks and dividend
Interview with Barry Glavin, Head of Equity, Amundi
Barry, when assessing a company’s capital allocation strategy, what are the importance aspects to consider?
It is important to examine the decisions made by individual management teams, both in terms of understanding their framework for allocating capital, and the funding of that allocation.
What are the typical allocation options available to corporates?
Typical corporate management options include investing organically in their business, undertaking mergers and acquisitions (M&A), distributing dividends, and engaging in buyback programmes.
A company that generates high returns on capital in its operating business should focus efforts on re-investing in their business. If they can grow their business and sustain those high returns on capital, the reward for shareholders is enhanced long-term earnings power. We would consider there in limited risk embedded in this option, given management are investing in a business they know very well.
Turning to M&A, this can be a riskier option. Bids are competitive, which puts upward pressure on prices, thereby diminishing returns for investors. Targets are seldom a perfect fit strategically. Thus, the integration process brings risks and surprises, while delivering on the promised synergies is often challenging. Those companies with strategic clarity, discipline on price, and a track record on integration, can create shareholder value through acquisitions. However, we believe that many do not.
The choice between dividend and buyback as a method to return excess cash to shareholders is often framed in the context of taxation. Putting that issue to one side, these two options are slightly different. One, dividends, returns capital to shareholders for them to re-invest as they choose, while maintaining their stake in the business. The other, a buyback, offers investors the choice between reducing their stake in the business, or maintaining their stake and increasing the share of earnings attributable to that stake.
What are the variables in determining the attractiveness of a buyback programme?
For buybacks, the valuation matters. A buyback is an appealing option if it generates a return on investment that is greater than the other investment options available. If the management pays a 20x P/E to buy its own stock, that corresponds to a return on investment of 5%. If they pay 10x P/E, the return is 10%. In simple terms, the cheaper the stock, the more stock they can buy for the same amount of dollars, and the more accretive it is to continuing shareholders. The funding is also important. Returning excess capital to shareholders is usually a good thing. However, raising debt to fund those returns usually is not.
In conclusion, not all buybacks are the same. Today, several European banks are buying back stock at less than book value, funded by excess capital. This, in our view, is an excellent use of capital. Before the GFC, many of those same banks were paying high dividends, buying back stocks at multiples of book values, and balance sheets were significantly overstretched. This, as we know, was not a beneficial capital deployment option.
Most companies will have a balanced approach to capital deployment, allocating towards options that offer the best returns.
Capital expenditure and distribution - a controversy put to the test
It is often suggested that the higher focus on dividends and buybacks could result in CEOs cutting investment (capital expenditure and R&D) and thereby hurting innovation. Also, in many companies a large part of executives' compensation is in stocks, thus they may have a further incentive to favour boosting their near-term share price performance over longer term growth. However, despite persisting criticism of share buybacks, there does not seem to be any obvious rule for the optimal allocation between investment effort and distribution. In fact, buybacks allow for the optimal distribution of capital by the shareholders themselves.
An increase in tax on buybacks may not lead to more investment by corporates
In December 2017, the US Tax Cuts and Jobs Act reduced the corporate tax rate (from 35% to 21%) to encourage capital expenditure (capex), R&D and wage growth. Critics, however, claim that buybacks have increased too much and have led to a misuse of these extra-profits. They are calling for greater tax on this activity. We believe that buyback policies could be impacted at a certain level of excise tax. The Wharton School of the University of Pennsylvania (March 2023) claims that “a 4.6% excise tax would be enough to remove the tax preference on average”.4 However, if this occurred, its impact would encourage dividends, rather than investment, or wages.
US, Europe and Japan offer 3 different cases: no conclusive insights into the effect of buybacks
The US has had the highest payout ratio, but this has not prevented investment, especially in R&D, whose share in investment continues to grow (see Figure 2 and 3).
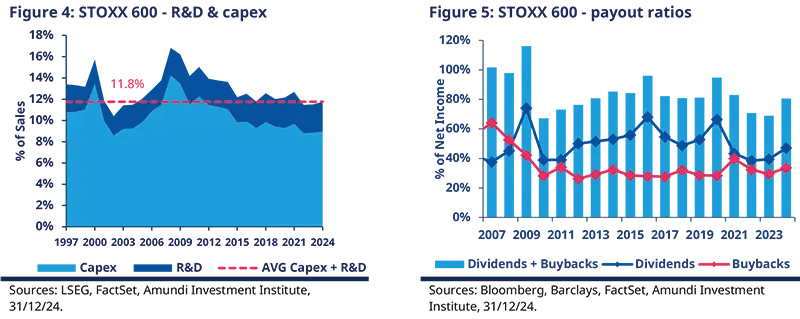
In Europe, the payout ratio has been about the same as in the US over the long-term, but investment has fallen since the GFC; the sovereign crisis has not helped, and the share of R&D was lower than in the US in 2024 (2.8% of sales versus 4% for the US).
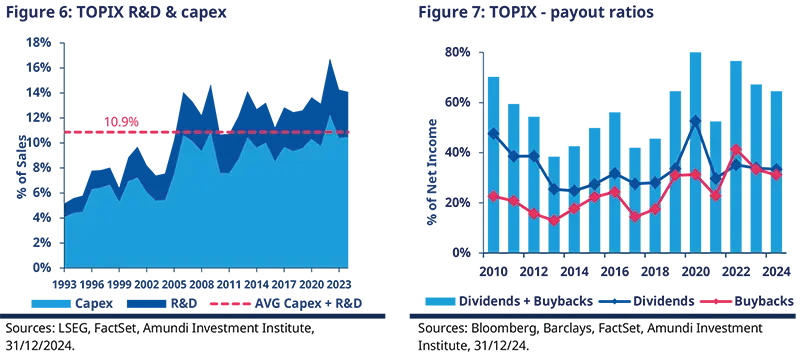
Japan has had a lower payout ratio than other regions but has maintained a significant investment effort in both R&D and capex. Its ratio of R&D to sales in 2024 (3.6%) was closer to that of the US.
In the US, a high payout rate and growing R&D effort
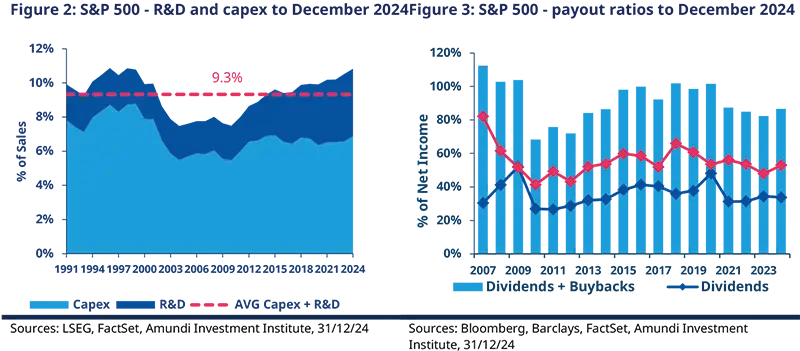
Investment by US companies as a % of sales fell after the dotcom bubble burst and levelled off between 2003 and 2010. Since then, it has risen mostly due to the R&D effort (rose from 2% of sales in 2010 to 4% in 2024). Capex was largely flat but saw an uptick in 2024 to 6.9% (from 6.6% in 2023). Investment was sustained in 2024 despite a slightly higher payout ratio (87%).
In Europe, a lower payout ratio and stagnating investment effort till now
The recovery in the investment effort after the 2001/2002 decline was stronger than in the US until the GFC. It then started to weaken and was further hurt by the sovereign crisis. It was not until 2015 that this effort stabilised before beginning to decline again in 2022. Going forward, this trend could change due to the German bazooka and the overall EU initiative. Turning to the payout ratio, it improved to 80% in 2024 (from 69% in 2023) but is still below the average since 2007 (86%, 5% lower than the US average).
In Japan, a lower payout ratio than other regions, but significant investment effort
The investment effort between 2005 and 2024 averaged 13% of sales (14.1%, 2024). The R&D effort has increased recently to reach 3.6% (2024). The payout ratio trend has risen since 2013 due to Abenomics, without putting the investment effort at risk. The average since 2010 (57%) has been lower than that in Europe (80%) and the US (88%). The 2024 figure (64%) was higher than the average but lower than elsewhere (Europe 81%, US 87%).
The case of the M7 and GRANOLAS
M7’s investment effort: larger than the payout to shareholders
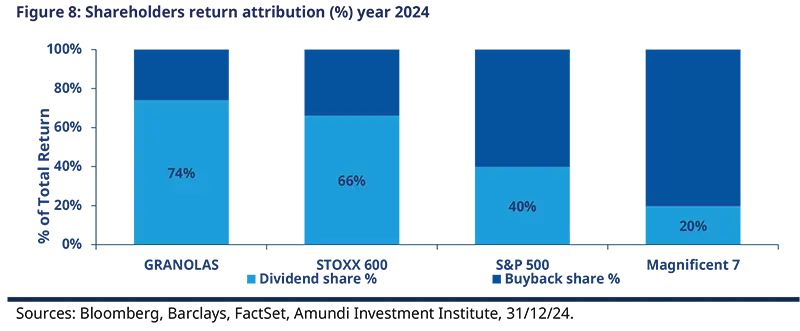
Based on the full year 2024 buyback activity, the M7 companies have made more use of buybacks than dividends as compared to the S&P 500 companies as a whole. Conversely, the European GRANOLAS’ use of buybacks is smaller than that of the Stoxx 600. Despite a high and rising payout, the investment effort has been rising in terms of the amount, practically every year for the M7. This provides further evidence that higher buyback activity does not necessarily result in lower capex intentions. The GRANOLAS’s payout and investment amounts have been closer in size but even there, the capex and R&D combined has been higher than buybacks and dividends.
Differing payout policies among the M7
Meta Platforms and Alphabet paid a dividend for the first time in 2024, joining three other M7s, which already were paying one (Microsoft, Apple, Nvidia). This is a sign of maturity and can be seen as another way to attract new investors. Among the M7, only Microsoft paid more in dividends than it bought back in shares in 2024.

Three investment implications
Structurally increasing “Scarcity Value”
Share buybacks result in a reduction in the number of shares which increases a company’s EPS, and then mechanically, can push up its return on equity. Thus, engaging in share buybacks can, in theory, contribute to the rerating of companies.
Since the GFC, the US companies have bought back more shares than they have issued; the US stock market has shrunk by 6% over this period. The market has seen a remarkable re-rating driven by very strong earnings. The increasing scarcity of US equities has also contributed to this re-rating but it has not generated demand for equities by itself and/or prevented a correction when that demand had faded.
European and Japanese companies started to engage in buyback activity much later, yet their activity levels are still larger than they were during the GFC by 11% and 1% respectively. This is reflected in the multiples at which they trade, which have been largely flat. The scarcity trend since December 2020 favours Japan which has been implementing stock market reforms.

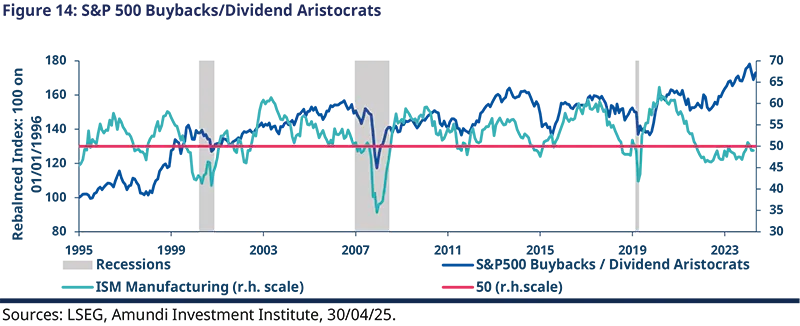
A cyclical indicator
When compared to S&P 500 Dividend Aristocrats Index5, the S&P Buyback Index tends to outperform during expansion phases of the cycle and to underperform during recessions, or even soft patches. In the long run, both these indices have outperformed the S&P 500 Index, with the buyback index achieving the best return. The S&P 500 Buyback Index composition has a more cyclical profile (86% exposure to cyclical sectors compared to only 61% for the S&P 500 Dividend Aristocrats Index). Indeed, looking more closely, the buyback index tends to outperform during ascending phases of the cycle and the reverse is true in downward phases. The fact that the expansion phases of a cycle are longer than the recession phases explain, at least partially, the superiority of buybacks over the long-term. This cyclical behaviour is not only the case between recessions, but also along soft patches that can be tracked for example with the ISM Manufacturing PMI. The outperformance of the buyback index over the dividend aristocrats index in 2023-24, while the ISM Manufacturing PMI was stabilising below 50, illustrates the exceptionalism of the M7 during this period. Should the cycle consolidate further, a certain amount of normalisation could be expected in favour of the dividend aristocrats for some time.

A not so easy to read signal for investors
Management’s intention to engage in share buybacks is usually a positive signal for investors about companies’ confidence in their future profitability at least in the short term, but other factors can eventually come into play. The buyback programs are usually achieved progressively, and if done at an advantageous time, they could (in theory) lower share price volatility. However, the signal can also not be as efficient as expected, given the risk linked to management’s behavioural bias of delivering positive signals at the peak of share price performance.
To conclude, Europe is now ahead of the US in terms of the combined buyback and dividend yields and is now the most attractive developed market region as regards shareholder renumeration. In our view, the yield gap in Europe offers scope for further outperformance from here. Finally, contrary to what some critics have claimed, the growing importance of dividend and buybacks globally has not resulted in an investment decline. We expect that investment in Europe will be well supported by the expected German bazooka and the overall EU initiative.
Appendix 1: Buyback charts across regions and sectors
Box 1: A breakdown by regions and sectors (see appendix 1)
The value of US buybacks reached a high level in 1Q22 ($273 bn). After a correction, buybacks started to increase again in 3Q23. The annual amount for 2024 ($954 bn) was the highest in data history. Between rising buybacks (+20%, 2024) and a rallying market (+23%, 2024), the average S&P 500 buyback yield for 2024 (1.8%) was the lowest since 2021. Accordingly, the buyback yields of most sectors were lower than their 10-year averages, with the notable exception being that of the energy sector. In the case of the IT companies, they represented 31% of the market capitalisation weighted index, but only 24% of the buybacks. This was not only due to the sharp rise of IT share prices, but also to a broadening of the buyback activity outside of the sector (i.e. represented 41% of buyback activity in 3Q20).
EU buybacks reached a post–GFC high in 3Q21 ($70 bn). However, they have been trending down since then and stood at 17% below this level in 4Q24. As the market rose (+6%) more than buybacks (+4%) in 2024, the STOXX 600 average buyback yield in 2024 (1.5%) was below the 2023 level, but still above its average since 2007 (1.4%). Accordingly, the buyback yields of most sectors were below their 10-year averages, with the energy sector as the exception similar to the US. The financial sector represented 22% of the market capitalisation of the index and 35% of the buybacks in 4Q24. Elsewhere, the energy sector made-up only 5% of the market share but was responsible for 16% of the buybacks in 4Q24.
In Japan, contrary to the US and Europe, buybacks reached a new all-time high in 3Q24 ($28 bn). Over the year, buybacks were up (+9% in 2024) while the market climbed even more (+18%). As a result, the TOPIX average buyback yield in 2024 (1.1%) continued to decline but stood at slightly above its average level since 2007 (0.9%). Once again, the buyback yield for the energy sector was significantly above its 10-year averages. Activity among the consumer discretionary companies represented only 18% of the market cap, and yet contributed to 28% of the buybacks in 4Q24. The share of buybacks from the communication services and heath care sectors was notably higher than their market cap weight as well.
US charts – S&P 500

European charts – STOXX 600
Japan charts – TOPIX
Bloomberg, Barclays, March 2025.
The magnificent seven (M7) stocks are a group of high performing companies in the US market (Alphabet, Amazon, Apple, Meta Platforms, Microsoft, Nvidia and Telsa). The GRANOLAS are Glaxo Smithkline, Roche, ASML, Nestle, Novartis, Novo Nordisk, L'Oreal, LVMH, Astra Zeneca, SAP and Sanofi.
Bank of International Settlement, “Mind the buybacks, beware of the leverage”, September 2020.
The Wharton School of the University of Pennsylvania, “The excise tax on stock repurchases effects on shareholder tax burdens and Federal revenues”, March 2023.
The S&P 500 Dividend Aristocrats is a stock market index composed of the companies in the S&P 500 Index that have increased their dividends in each of the last 25 years.


Authors