Summary
Developments in Artificial Intelligence (AI) and machine learning have led to the creation of a new type of ESG data that do not necessarily rely on information provided by companies. This paper reviews the use of AI in the ESG field: textual analysis to measure firms’ ESG incidents or verify the credibility of companies’ concrete commitments, satellite and sensor data to analyze companies’ environmental impact or estimate physical risk exposures, machine learning to fill missing corporate data (GHG emissions etc.). Recent advances in LLMs now make it possible to provide investors with more accurate information about a company’s sustainable policy, innovation or supply chain relationships, or to detect greenwashing, We also discuss potential challenges, in terms of transparency, manipulation risks and costs associated with these new data and tools.
Challenges with traditional extra-financial data
Data provided by extra-financial rating agencies are essential but raise a number of questions about their use. Based on company reporting, supplemented by human analysis, there is a certain degree of subjectivity in the choices made by each rating agency on the relevant ESG criteria and their weightings. The different methodological choices made by the various agencies cause these ratings to be loosely correlated with one other. In addition, ratings are reviewed infrequently, sometimes with different timings depending on the company, and ratings tend to be revised in the direction of a stronger correlation with financial performance (Berg et al., 2020). Finally, the differences in the imputation methods used by ESG analysts to deal with missing data can cause large ‘discrepancies’ among the providers, which are using different gap filling approaches. Interestingly, the discrepancies among ESG data providers are not only large, but actually increase with the quantity of publicly available information. Companies that provide greater ESG disclosure tend to have more variations in their ESG ratings (Christensen et al., 2019).
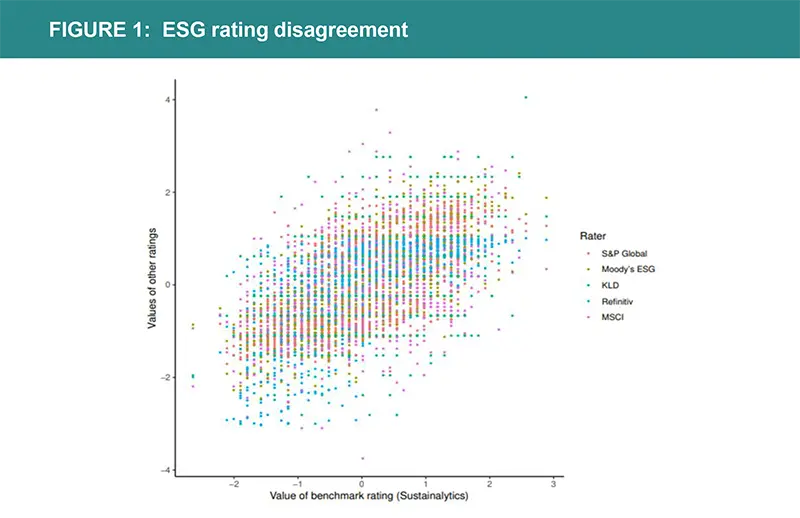
This graph illustrates the ESG rating divergence. The horizontal axis indicates the value of the Sustainalytics rating as a benchmark for each firm (n= 924). Rating values by the other five raters are plotted on the vertical axis in different colors. For each rater, the distribution of values has been normalized to zero mean and unit variance.
Source: Berg Koelbel and Rigobon (2022)
How can AI help? The rise in alternative data sets
In recent years, developments in AI and machine learning have led to the creation of a new type of ESG data providers that analyse and collect (or “scrape”) large amounts of unstructured data from different internet sources, using AI and without necessarily relying on information provided by companies.
Textual analysis to measure firms’ ESG incidents
Textual analysis tools (e.g., Natural Language Processing (NLP) and knowledge graphs) help identify controversies and important ESG news. A large number of textual analysis software has been developed over the last decade, including Reprisk, Truvalue Labs, and others. They make it possible to finely measure controversies involving companies on various subjects such as environmental policies, working conditions, child labour, corruption, etc. Compared with traditional ratings, they have the advantage of more frequent revisions, incorporating real-time company information. For example, Reprisk analyses more than 80,000 media, stakeholders, and third-party sources daily, including online media, NGOs, government bodies, regulatory texts, social media, blogs, etc. and detects incidents that occur in companies’ ESG policies, through screening methods using machine learning combined with human analysis. This information has a high informational content. For example, in a recent research work (Bonelli, Brière and Derrien, 2022), we evaluated how employees react to controversies involving their employer when they decide to invest in their companies’ shares. We identified that employees are very sensitive to news concerning their company’s social policy, they react particularly to news on working conditions.
Amundi partnered with Causality Link and Toulouse School of Economics to study the informational content of financial and ESG news about firms on a large scale. The Causality Link Artificial Intelligence system collects and analyses textual data from different sources, including news stories, call transcripts, broker research, etc. Some 50,000 texts per day are analysed, enabling us to build an aggregate news signal that captures not only the positive or negative tone of news but also how popular such news is in the market on a given day. The texts pass through the filter of a proprietary algorithm, which transforms them into structured data. Given a news statement about a particular firm, the AI platform of Causality Link is able to identify the firm’s name, its Key Performance Indicator (KPI), the direction of change in this KPI and the tense of the statement.
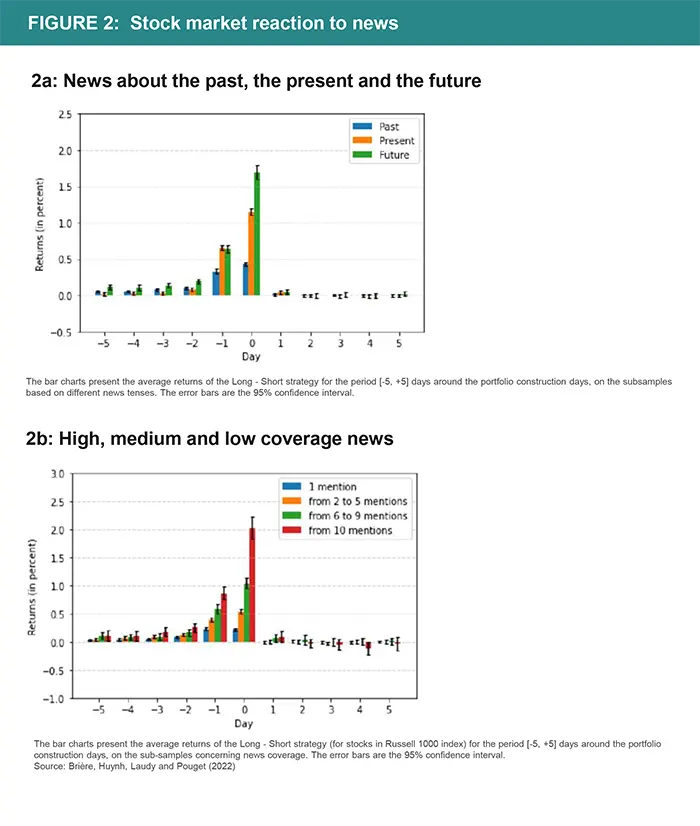
In our study (Brière, Huynh, Laudy and Pouget, 2022), we investigated how and when new fundamental information is incorporated into prices. We explored the possible heterogeneity of price reactions across various firms and types of news: financial versus ESG news, tense of news (past, present, future), horizon of the news (short versus long), and the firm’s size. In practice, we used this information to test what information made the stock market react, the speed of the market's reaction to news, and the construction of portfolios betting on these reactions. Our analysis highlights the strong informational content of the news understood by the software. Not only do the markets react strongly to the news identified on the day of the announcement, but we were able to show that they react more strongly to information concerning the future of the company than to information relating to its past achievements.
NLP techniques are also a powerful tool to identify “market narratives” (economic reasoning, geopolitical risks, environmental and social risks, etc.) as expressed by prints and broadcast media, etc. Blanqué et al. (2022) analysed the informational content of the Global Database of Events, Language and Tone (GDELT) to build time series that represent how some “market narratives” appear to the market. They show that this information has forecasting power on the US equity market.
Advanced Large Language Models (LLMs) have the ability to extract Environmental, Social, and Governance (ESG) content from news articles. Jain et al. (2023a) show that the GPT 3.5 model (commonly known as Chat GPT) is capable of categorizing real-world headlines according to specific ESG factors and assigning ratings on a scale from -10 to 10 based on their ESG implications. Their case study reveals a significant correlation between the sentiment of the analyzed ESG headlines and stock returns, underscoring the potential of LLMs to inform investment strategies and decision-making processes in the financial sector.
What distinguishes the latest generation of AI models, such as GPT, is their remarkable ability to produce human-like text (Ray et al., 2023). This characteristic enables researchers to engage with the model in a dialogue, asking it to elucidate or rationalize its judgements (through adequate “prompts”) — for instance, to explain why a particular news article is rated -5 rather than -10 (Jain et al., 2023).
Textual analysis to measure/verify the credibility of companies’ concrete commitments
Researchers and organizations have recently started to use AI to assess company disclosures. The Task Force on Climate Related Financial Disclosures (TCFD) has conducted an “AI review,” using a supervised learning approach to identify compliance with the TCFD Recommended Disclosures (TCFD, 2019). Kolbel et al. (2020) analyse climate risks disclosure in 10-K reports using BERT, an advanced language understanding algorithm, and identified an increase in transition risks disclosure that outpaced those of physical risks. Friederich et al. (2021) use machine learning to automatically identify disclosures of five different types of climate-related risks in companies’ annual reports for more than 300 European firms. They find that risk disclosure is increasing and confirm that disclosure is expanding faster in transition risks than in physical risks. There are marked differences across industries and countries. Regulatory environments potentially have an important role to play in increasing disclosure. Li et al., (2023) apply GPT to Merger & Acquisitions meeting transcripts and show that there is a surge in ESG related discussions during these meetings after the adoption of mandatory ESG disclosures. Sautner et al. (2020) use a machine learning keyword discovery algorithm to identify climate change exposures related to opportunity, physical, and regulatory shocks in corporate earnings’ conference calls. They find that their measures can predict important real outcomes related to the net-zero transition: job creation in disruptive green technologies and green patenting. They contain information that is priced in options and equity markets.
Kim et al., (2024) explain why the new generation of language models are better suited to analyzing complex corporate risks. First, these models can understand relationships within a text, integrate a broader context, and draw inferences. Second, because of their general nature, these models are trained on a large corpus of diverse textual data, so they can go beyond a single document. Finally, generative language models like GPT synthetize information into a coherent narrative, producing not only a quantitative assessment, but also an explanation to support their assessment. In contrast, classic NLP approaches typically use a pre-existing dictionary, that cannot account for the rapidly changing nature of political or environmental risk, and rely on an understanding of a single document, that does not consider the broader context in which topics appear.
Kim et al., (2024) show that applied to earnings conference calls, their GPT-constructed climate risk measure consistently outperforms bigram-based measures such as that of Sautner et al. (2020) in explaining stock price volatility. Moreover, when the authors instruct the model to integrate external information and make a judgment, their risk measure performs better
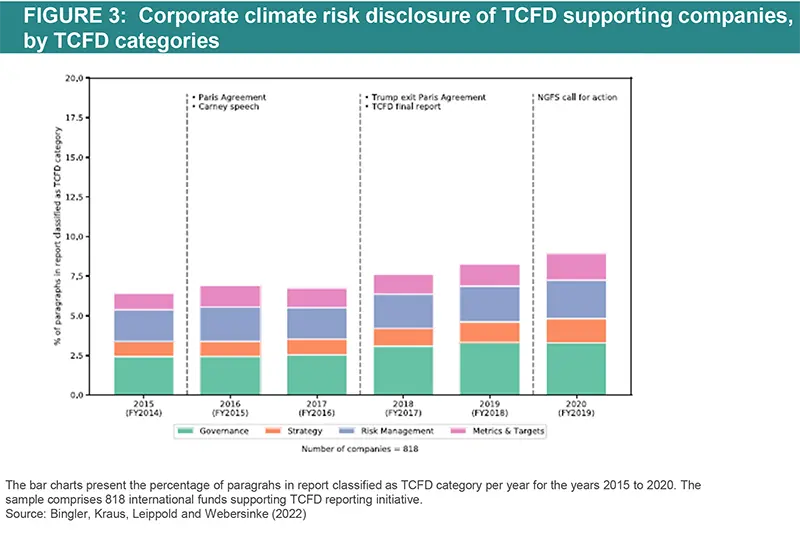
Bingler, Kraus, Leippold and Webersinke (2022) introduce ClimateBERT , a context-based algorithm to identify climate-related financial information from the reports (annual reports, stand-alone sustainability-, climate-, or TCFD reports, firms' webpage) of 800 TCFD-supporting companies. They assess whether climate disclosures improved after supporting the TCFD and analyse the development of TCFD disclosures in different sectors and countries. Their results show that firms tend to cherry-pick disclosures on those TCFD categories containing the least materially relevant information, supporting the idea that TCFD disclosure is currently “cheap talk”. Disclosures on strategy, and metrics and targets, are particularly poor for all sectors besides energy and utilities. They observe a slight increase in the information disclosed as required by TCFD categories since 2017.
Satellite and sensor data to analyse companies’ environmental impact or estimate physical risk exposures
Satellite data and ground sensors are another source of alternative data making it possible to collect essential information that can be used to verify the carbon emissions of companies or to analyse the impact of their activity on ecosystems: air pollution, groundwater quality, waste production, deforestation, etc. Recent years have seen a remarkable increase in the temporal, spatial, and spectral information available from satellites (Burke et al., 2021). These data, which would be difficult to collect by other means, offer a wide geographical coverage and high resolution and do not bear the risk of data manipulation. These alternative sources of data can also be used to measure certain physical risks, such as floods, hurricanes, or monitor biodiversity evolution. Finally, they can be a key ingredient of climate stress tests models (Strzepek et al., 2021 ; Bressan et al., 2022).
For example, Bellon (2020) constructed a measure of “gas flaring” (burning of natural gas associated with oil extraction) using satellite data from the NASA IR public files. He identifies the practice of flaring based on the fact that it emits a temperature between 1600º C and 2000º C, not to be mistaken with forest fires, which generally reach about 800º C. He measures how much firms engage in “flaring”, which involves burning the gas contained in oil wells to save the fixed cost of connecting the well to a pipeline or to treat the gas, and whether private equity ownership of the firms has any impact on the flaring practice.
Ground-based air pollution monitoring stations are not widespread in developing countries, and they are potentially subject to government manipulation. Jayachandran (2009) measures the air pollution caused by forest fires in Indonesia. Streets et al. (2013) review studies of satellite data applied to emission estimations and find that geostationary satellite imagery provides accurate air pollution estimation for various types of polluants. Satellite imagery such as Medium-Spectral Resolution Imaging Spectrometer (MERIS) can also allow real-time water quality supervision, for example for transboundary rivers, that would otherwise require efficient cross-border cooperation and transparency (Elias et al. 2014 ; Mohamed, 2015). Satellite data has also largely be used to monitor deforestation (see for example Tucker and Townshend, 2000 ; Grainger and Kim, 2020) or reforestation programs (Li et al., 2022).
Kocornik-Mina et al. (2020) analyse the impact of floods, which are among the costliest natural disasters, having killed more than 500,000 people and displaced over 650 million people over the past 30 years. Their paper analyses the effect of large-scale floods. They conduct their analysis using spatially detailed inundation maps and night lights data spanning the globe’s urban areas, which they use to measure local economic activity, the damage sustained by such activity, and how it recovers from floods. New technologies, such as satellite-based remote sensing, but also cameras, acoustic recording devices and environmental DNAs can also allow to monitor biodiversity evolution (Stephenson, 2020).
Finally, social indicators can also be derived from satellite imagery. Engstrom et al. (2017) use a large number of features (such as the number and density of buildings, prevalence of shadows, number of cars, density and length of roads, type of agriculture, roof material, etc.) extracted from high spatial resolution satellite imagery to estimate poverty and economic well-being in Sri Lanka. They show that these features have great explanatory power on poverty headcount rates and average log consumption.

Machine learning to fill missing corporate data (GHG emissions etc.)
Large companies now report their GHG emissions based on the GHG Protocol of the World Business Council for Sustainable Development (WBCSD). According to this Protocol, reporting on Scopes 1 and 2 is mandatory, while reporting on Scope 3 (indirect emissions that occur in the company’s value chain) is optional. But in some sectors, Scope 3 is often the largest component of companies’ total GHG emissions.
Estimating total GHG emissions requires to link, for each company, each stage of its industrial processes with their carbon emissions. However, the information required to quantify companies’ use of those processes, or their intensity in the overall annual production chain, is rarely publicly available. This makes it difficult to apply such models for calculating company emissions at a global level. Specialised data vendors (for example, MSCI ESG CarbonMetrics, Refinitiv ESG Carbon Data, S&P Global Trucost etc.) rely on simple models to predict the likely GHG emissions of some of the companies that do not currently report, based on sector level extrapolations (sometimes based on regression models based on the company’s size, number of employees, income generated, etc.).
Nguyen, Diaz-Rainez and Kuruppuarachchi (2021) proposed the use of statistical learning techniques to develop models for predicting corporate GHG emissions based on publicly available data. The machine learning approach relies on an optimal set of predictors combining different base-learners (OLS, ridge, LASSO, elastic net, multilayer perceptron neural net, K-nearest neighbours, random forest, extreme gradient boosting). Their approach generates more accurate predictions than previous models, even in out-of-sample situations. Heurtebize et al. (2022) and Reinders and (2022) also propose a model based on statistical learning techniques to predict unreported corporate greenhouse gas emissions.
Jain et al., (2023b) utilize Large Language Models (LLMs) and textual data to estimate Scope 3 GHG emissions. Their study addresses the primary challenge of estimating Scope 3 emissions: the lack of available emissions data for individual products and services. The authors note that organizations such as the US Environmental Protection Agency and OECD provide emission factors for specific commodity categories, but mapping these to individual company purchases, which are expressed in various forms of natural language, is not feasible on a human scale. This is where the capabilities of pre-trained language models such as BERT to classify large amounts of unlabeled data becomes invaluable.
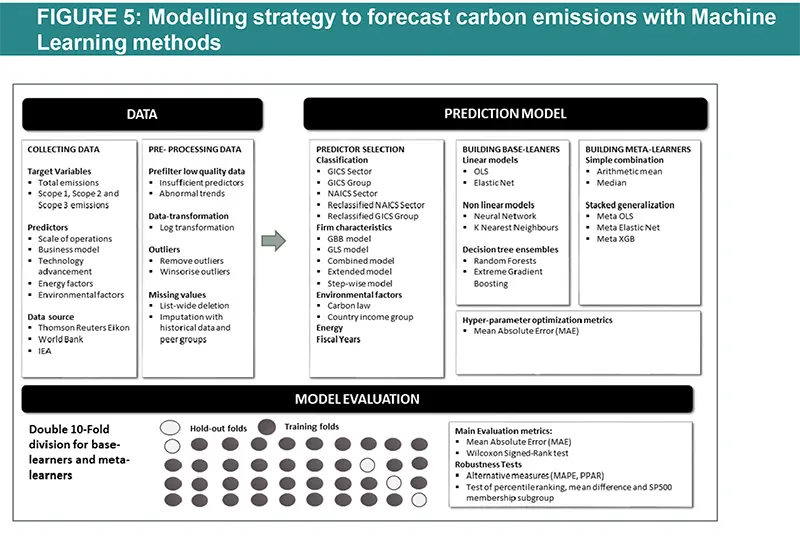
This figure illustrates the modelling framework that is used to train and evaluate the proposed machine learning approach. Block: Data shows the sample selection and data pre-processing process. Block: Prediction Model implements (1) Predictor Selection, where the optimal set of predictors from the listed alternative choices is selected based on OLS regression. (2): Build Base-Learners, where three groups of base-learners are tested, namely linear models, non-linear models, and decision ensembles, and (3) Building Meta-Learners, where predictions are combined using a simple combination or stacked generalization. Finally, block: Model Evaluation: describes the model evaluation with mean absolute error and a set of robustness tests via double-K fold validation.
Source: Nguyen, Diaz-Rainez and Kuruppuarachchi (2021)
The authors fine-tune different variants of the BERT model (BERT, RoBERTa and ClimateBERT) using a training dataset of labeled products and services according to the US Environmentally-Extended Input-Output commodity categories. The resulting BERT classifier integrates corporate expenditure data with emission factor databases, links individual products to commodity categories and helps estimate emissions. Their model outperforms traditional methods such as TF-IDF and word2Vec in accurately classifying products and services into the appropriate commodity classes.
LLMs for Extracting Climate and ESG Themes from Unlabeled Data
The rise of ESG investing has also led to an increased interest in thematic investing such as focusing on energy transition, climate change adaptation and green innovation. NLP techniques have a great potential in this area due to their ability to summarize large amounts of textual data and identify relevant information. An early and simple example of such an application is found in the paper by Shea et al., (2021), where LDA Topic Modeling is used to extract subthemes related to energy transition, such as alternative energy, green mobility and energy use, from sustainability reports.
Corringham et al., (2021) argue that LLMs are good candidates for climate change text applications, where there is a lack of large, high-quality labeled datasets. Nugent et al., (2020) recognize that NLP tasks in finance are challenging because of this lack of labeled data problem. The combination of LLMs with domain adaptation (e.g. fine-tuning) and data augmentation techniques can, therefore, go a long way. This explains, for example, why FinBERT outperforms BERT when applied to financial texts (Yang et al., 2021). Corringham et al. (2021) show that with minimal training, a BERT model can classify sentences from national governments’ Paris Agreement Climate Action Plans into topics related to climate mitigation, adaptation, and land use.
Similarly, Luccioni et al., (2023) fine-tune BERT on financial reports as well as on a labeled dataset of example responses to a set of 14 questions published by the TCFD to help companies structure their sustainability reporting. BERT learns to determine whether a given company report answers one of the 14 TFCD questions.
Martín et al., (2024) use GPT4 to examine whether the sustainability reports of Nature 100 companies answer questions related to an Adaptation Alignment Assessment Framework. They conclude that companies are not reporting enough on adaptation. To mitigate the problem of hallucination, the authors use a system called Retrieval Augmented Generation (RAG), which inputs external and verifiable information into the model and constrains it to answer based on that information. Relatedly, the MSCI Institute also recently launched a project in which researchers are using GPT to identify products and services related to climate adaptation (Browdie, 2024).
Leippold and Yu (2023) use ClimateBERT to identify discussions of green innovation in corporate earnings calls. To further train ClimateBERT on green innovation text, the authors ask GPT 3.5 to summarize climate patent abstracts in investor-friendly language and use this output data to fine-tune the model. Their analysis shows that green innovation has historically been associated with a negative stock market premium, but in the last two years, green innovative stocks have begun to outperform due to increased attention to toward green innovation.
A particular advantage of the latest generation of AI models such as ChatGPT is that they provide a user-friendly interface while delivering an exceptional performance in text classification. In a case study, Föhr et al., (2023) use prompt engineering and few-shot learning (giving GPT examples of sustainability text excerpts and their corresponding Taxonomy classification) to apply the EU Taxonomy to company reports through ChatGPT, determining alignment and eligibility. However, they caution that professional auditor judgment remains critical given the limitations of LLMs.
Discussion and Challenges
AI provides interesting avenues to fill ESG data. However, there are a number of challenges. AI methods can be a black box, subject to the same types of revisions in the methodologies as in traditional ESG ratings. For example, NLP techniques relying on an ontology can be incomplete and revised ex-post. Hughes et al. (2021) show that the criteria used by Truvalue Labs to assess ESG risks of companies tend to largely overweight certain key issues (the ones that generate the more ESG controversies), defined at the company level and which can fluctuate over time, while for traditional rating providers, the weightings tend to be more stable and evenly distributed. These alternative ratings based on NLP signals become more of a public “sentiment” indicator. This also means that they are also more prone to manipulation. This is particularly true when the primary source of data comes from blogs or social media.
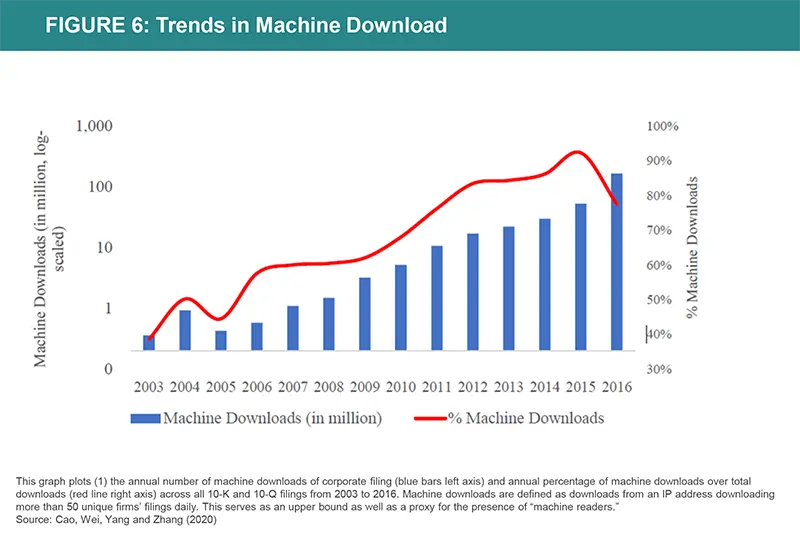
Corporate disclosure can also be subject to manipulation. Cao et al. (2020) show that firms’ communication has been reshaped by machine and AI readership. Managers are now avoiding words perceived as negative by computational algorithms, exhibiting speech emotion favored by machine learning software.
Another issue is that alternative datasets do not necessarily offer a wide coverage, due to lack of historical data, missing news sources, etc., which might lead to biases and representativity issues. In the end, the same issue of low correlation between rating providers might also apply when considering alternative ESG datasets. Hain et al. (2022) compare six physical risk scores from different providers and find a substantial divergence between these scores, even among those based on similar methodologies. In particular, they identify a low correlation between physical risk metrics derived from model-based approaches (Trucost, Carbon4 and Southpole) and language-based approaches (Truvalue Labs, academic scores). Curmally et al. (2021) document a positive (albeit small) correlation between sentiment derived from NLP analysis on incidents and traditional ESG scores. Satellite remote sensing in insolation is no panacea. Access to relevant field-based information is key for satellite imagery to be properly calibrated, analyzed and validated. This need for close collaboration between modellers and remote sensing experts to derive meaningful information can represent a serious challenge (Pettorelli et al. 2014).
Financial institutions aiming to integrate these new metrics into their analysis should be aware that the choice of one measure over another has a large impact on the outcome. In the end, a comprehensive process should avoid placing too much confidence in a single measure, and strive to integrate the uncertainties around the measures being used. Once used on a large scale in a given institution by fund managers, analysts or even clients, the scope, use and limits of these alternative ESG measures should also be properly explained (Nassr, 2021 ; OECD, 2021). Finally, one should not neglect the costs of maintaining alternative datasets: not only acquiring the data, but also storing, checking, and integrating these large datasets might necessitate a dedicated team and can be very costly (Denev, 2020).


