Summary
EXECUTIVE SUMMARY
The rotation towards value is a key theme of our 2021 investment outlook. As the US economy moves towards reopening and a return to normalcy, we expect an overly accommodative Federal Reserve (Fed) to let the economy ‘run hot’ in the near to medium term, meaning reflation and a steeper yield curve. With a ‘V-shaped’ recovery underway, such conditions -- combined with still excessive growth vs. value valuations -- we believe enable an optimal setup for US value to outperform beyond its initial move last September. Beyond that, US value offers a compelling opportunity to sustain medium- to long-term performance relative to both the US and global markets, as it provides a unique combination of structural growth, quality, ESG improvement, stability, defensiveness, and relative valuation support. Virtually all other segments of the market provide only one or two of these features, but US value has them all.
| Near-to-medium-term rationale for US value |
Long-duration rationale of US value performance |
|---|---|
|
V-shaped recovery, liquidity and an accommodative Fed:
Excessive valuation anomaly of US value relative to growth:
|
Structural growth:
Stability and defensiveness:
Quality market with appealing valuation:
|
Near- to medium-term rationale for US value
We believe optimal conditions exist for US value to outperform US growth because of a combination of factors, including the likely normalisation of economic activity later in 2021, a continuation of unprecedented fiscal stimulus, and a very accommodative Fed. All-in, the stage is set for accelerating inflation for the first time in years, as well as higher bond yields.The early stage of an economic recovery alone is typically sufficient for value to outperform. However, a historically excessive valuation gap between growth and value, along with reversal of the multiplier effect that low rates had on growth company valuation multiples, add more conviction to our view.
Macro set-up
The Fed has signalled that it is committed to low rates for the foreseeable future and will let the economy ‘run hot’. Specifically, the Fed wants to be sure that the US business cycle is closer to -- if not at -- its pre-Covid-19 trend growth path (meaning catch-up growth for both the real economy and inflation) before signaling an intent to slow nominal demand growth.
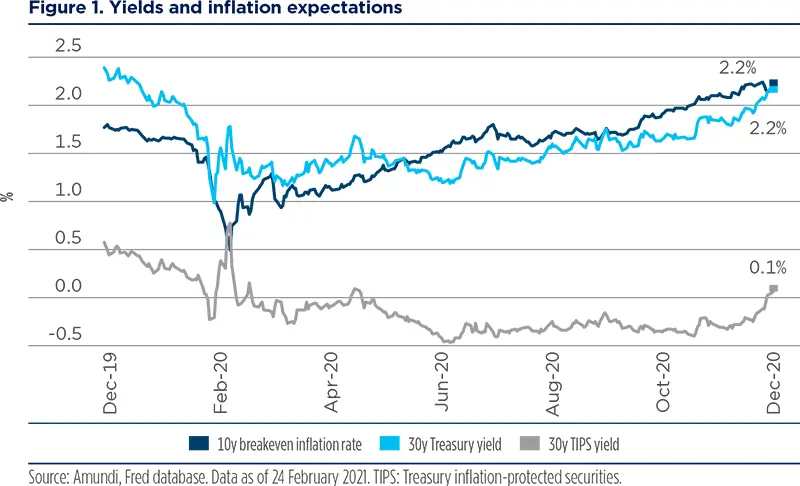
As a result, inflation expectations have surfaced for the first time in years, particularly when the Fed’s new inflation regime is proactive in tolerating an overshoot beyond its stated 2% sustained inflation objective.
With a ‘V-shaped’ recovery well underway and the anticipated normalisation in economic activity this year, thereis real potential for overshooting given pent-up demand and continued fiscal support under the Biden administration.
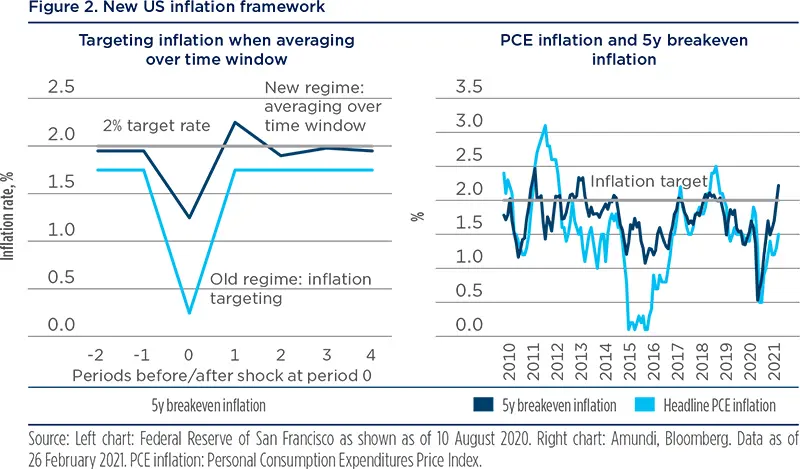
Unlike the post-global financial crisis (GFC) recovery, which took place over many years, the nominal economy (real GDP growth plus inflation) is expected to be back at its pre-Covid-19 trend by the end of 2021 or early 2022. Unlike the GFC, the Covid-19-induced recession was not the result of a bubble and there were no excesses for the economy to work through. It is estimated that the Covid-19 recession created only half as much structural US unemployment as the GFC, while the massive fiscal stimulus supported consumer spending and held inflation up in 2020.
With a ‘V-shaped’ recovery well underway and the anticipated normalisation in economic activity this year, there is real potential for overshooting given pent-up demand and continued fiscal support under the Biden administration. As such, we expect reflation and long-term bond yields to increase meaningfully, resulting in a steeper yield curve. This dynamic sets up optimal fundamental conditions for US value to outperform growth meaningfully, that should be aided by the excessive valuations of growth stocks relative to history.

Valuation gap between US value and growth points to a resurgence of value performance
The post-GFC decline and sustained low level of interest rates and historically meager GDP growth over the past ten years has been a meaningful driver of the unprecedented outperformance of growth stocks. There are two components to this that get to a critical foundation of corporate finance in that equity valuations are equal to discounted future profits. When growth is scarce as it has been for the past ten years, investors will pay a premium for companies that can demonstrate growth as -- all else equal -- the more sustained growth, the higher future profits will be, and thus, the greater a stock is worth. Growth valuations have been amplified by the lower interest rates that are used to discount future profits. However, this is all about to change and growth is vulnerable while value is promising. The charts below demonstrate the growth-value disconnect.
The post-GFC decline and sustained low level of interest rates and historically meager GDP growth over the past ten years has been a meaningful driver of the unprecedented outperformance of growth stocks.
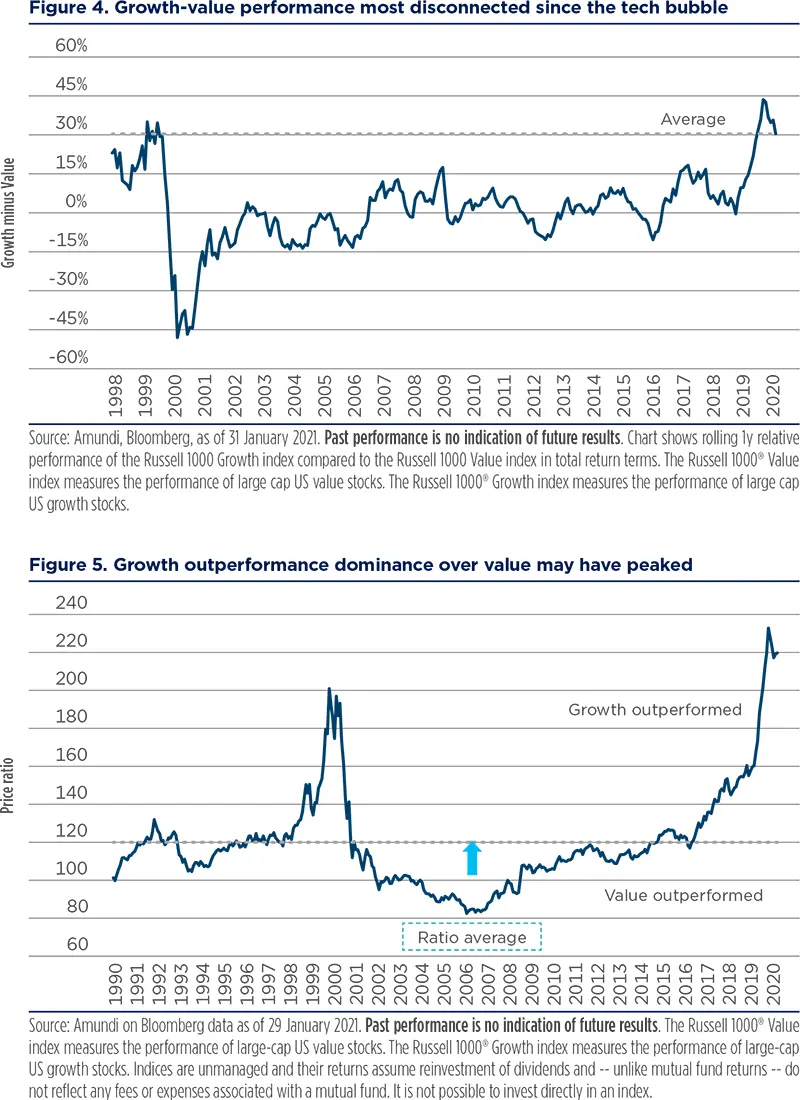
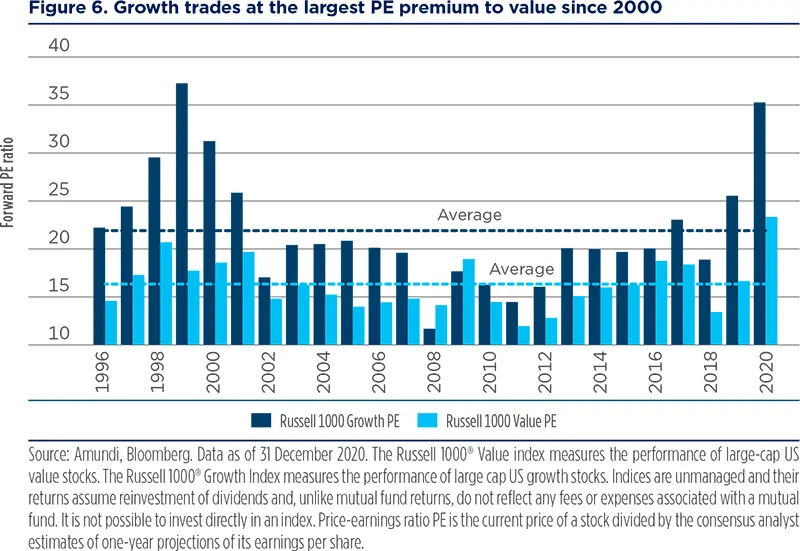
Nearly a quarter of value may represent next leg of innovation winners
Until now, the primary beneficiaries of the increased technology spending on cloud infrastructure, subscription software-as-a-service, automation, artificial intelligence (AI), machine learning, and digitisation have been the suppliers of the technology. However, we expect the future incremental profit pools of the technological transformation of the economy to accrue to the firms with the size and scale to deploy the technology to transform their businesses. Combined with the valuation disparity with growth vs. value in which the excessive relative-growth valuations are these same firms, this is an interesting time for investors to evolve with them as valuations support it. Specifically, much of the innovation of industrial and financial cyclicals that have leading market positions and will exploit such technologies resides within value, less so in growth.
We expect the future incremental profit pools of the technological transformation of the economy to accrue to the firms with the size and scale to deploy the technology to transform their businesses.
We believe this transformation is in the early stages of playing out. The companies deploying technologies such as cloud infrastructure, automation, and artificial intelligence have already spent vast amounts of capital, which is why the suppliers of the technologies have had massive growth in profits and market capitalisations. While the argument could be made that the value created from that investment has already shown up in higher market shares and greater efficiencies for the large industrials and financials, most of the value creation is yet to come for two primary reasons:
- there will be significant capital investment; and
- the return on that investment takes years to be realised.
For example, the market share growth of the big banks, while already increasing, will have years of acceleration as the technology investment is scaled. Similarly, factory automation is very early stage. Thus, within value, we believe this dynamic is an advantage for active portfolio management with a deep fundamental approach, combined with disciplined valuation as the medium-to long-term winners may not be obvious right away. By comparison, growth investing in some ways has become more straightforward because there is an immediate impact from technology spending on the revenue and profit growth of the technology suppliers. For example, the three dominant cloud services providers are well known and it is easy to follow their progress each quarter; the same can be said for software-as-a-service providers within each total addressable market. Investment performance becomes more of a valuation exercise, which still requires a thoughtful, fundamental view, but arguably is less complex and nuanced than assessing the winners of longer-term trends for the technology adopters such as structural improvements of efficiency ratios for banks, sustainably increased market shares, and less cyclical industrial operating margins.Three groups that represent about 25% of the value index have transformational opportunities.
The four biggest US banks collectively spend 1.5 times the more on technology per year than all the remaining US banks combined. This is reflected in their market share.
1) Mega-cap banks
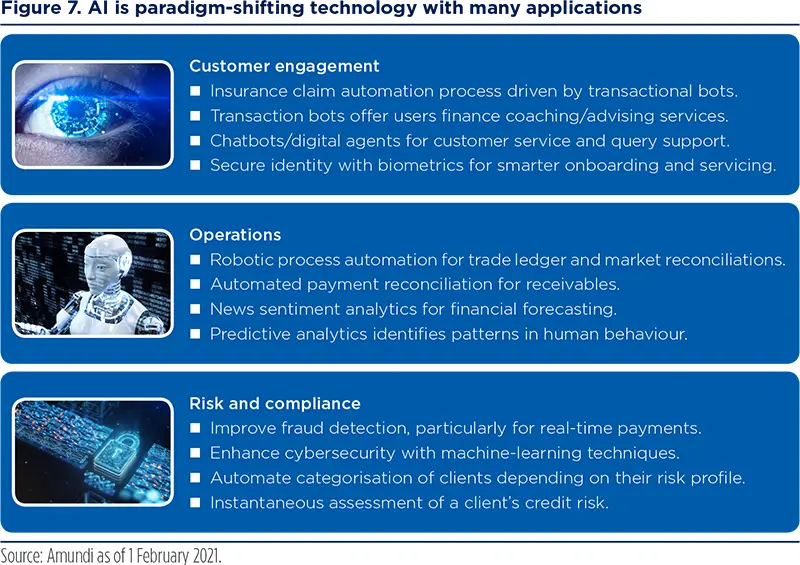
The four biggest US banks collectively spend 1.5 times the more on technology per year than all the remaining US banks combined. This is reflected in their market share. This tech spending is transforming the customer service experience, lowering costs, fraud prevention/cyber security, business-to-business payments flows, roboadvisors, etc.
How the banks will transform
Technology is reshaping financial services dramatically with the best players evolving with consumer behaviours based on shifting demographics and rising customer expectations:
- Gen-Z and millennials prefer digital banking channels over branches, having used digital technology from a young age.
- Trend towards mobile banking, mobile payments, mobile apps -- anywhere, anytime, 24/7.
- Cloud computing, artificial intelligence and blockchain enable digital revolution in financial services.
- Increased use of technology in financial services industry, rise of internet and mobile applications for financial transactions.
- Game changing technologies like artificial intelligence, biometrics and blockchain will enhance customer experience and security.
- The biggest incumbents will leverage scale and trust to take advantage of their high levels of tech spending to stay relevant, build market share and improve operating efficiency, all within the regulatory environment that governs the financial services industry.
Technology is reshaping financial services dramatically with the best players evolving with consumer behaviours based on shifting demographics and rising customer expectations.
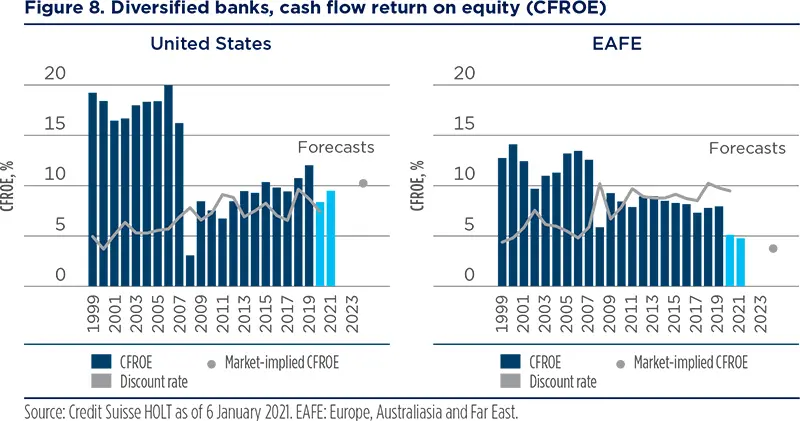
Since the end of the GFC, the sustained higher returns on equity of US banks vs. global peers have provided the excess capital to invest in ‘change the bank’ technology.
2) Industrial revolution 4.0
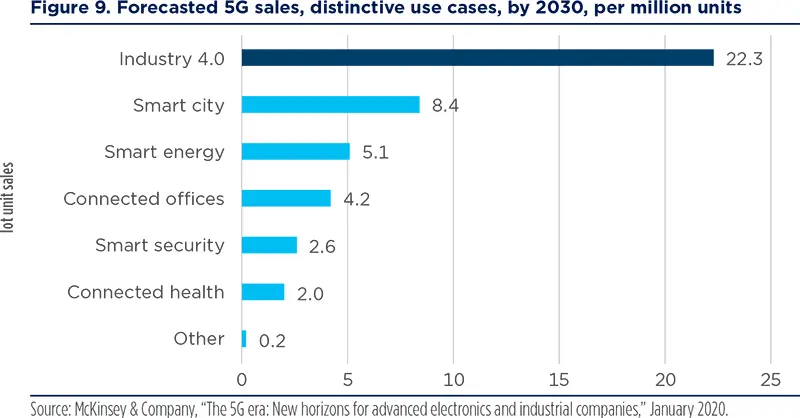
5G and robotics are in the early stages of transforming industrials with automation and data. The emerging 5G transformation of virtually every industry based on the hyper-connectivity between people and things will enable a new era of connecting machines, with the value of these connections being the data interchange between them. The largest application of 5G will be industrials. According to McKinsey, by 2030, 22.3 million Internet of Things (IoT) unit sales of the total forecasted 44.8 million total will relate to manufacturing, construction and mining, supply chain, and agriculture. Big industrial firms in machinery and equipment, aerospace, logistics, and even waste management are going to transform their business models with connected machines and data.
|
Examples of use cases:
Source: McKinsey & Company, “The 5G era: New horizons for advanced electronics and industrial companies,” January 2020. |
The emerging 5G transformation of virtually every industry based on the hyper-connectivity between people and things will enable a new era of connecting machines, with the value of these connections being the data interchange between them.
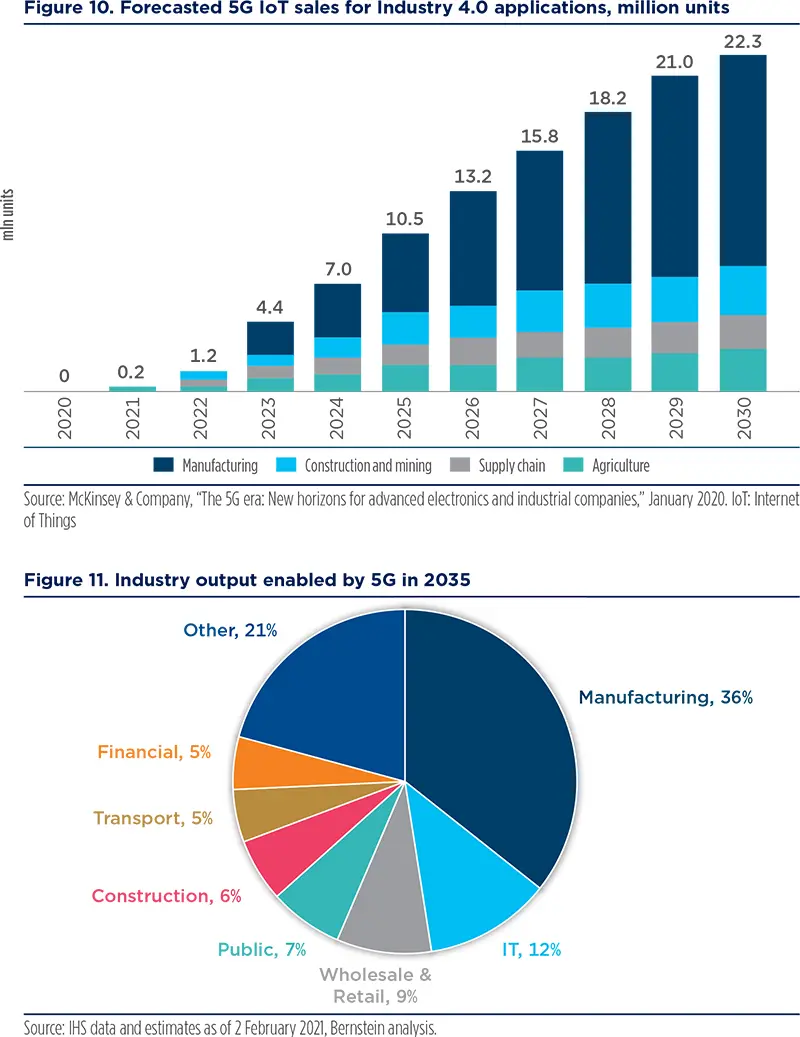
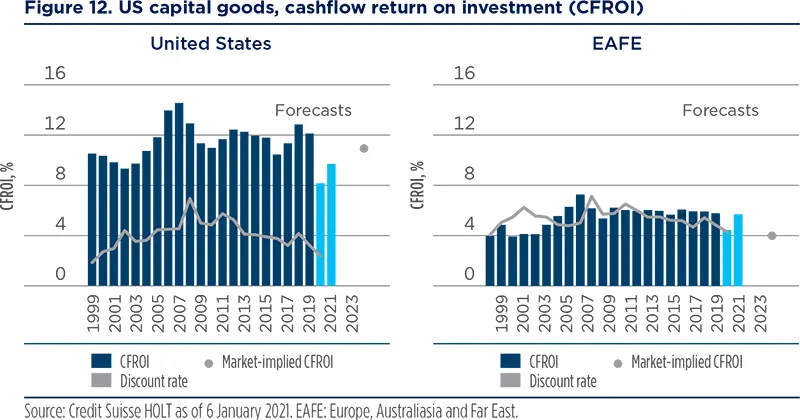
Similar to financials, the meaningfully higher returns on capital have enabled an R&D and technology spending advantage.
3) Renewables revolution in Utilities
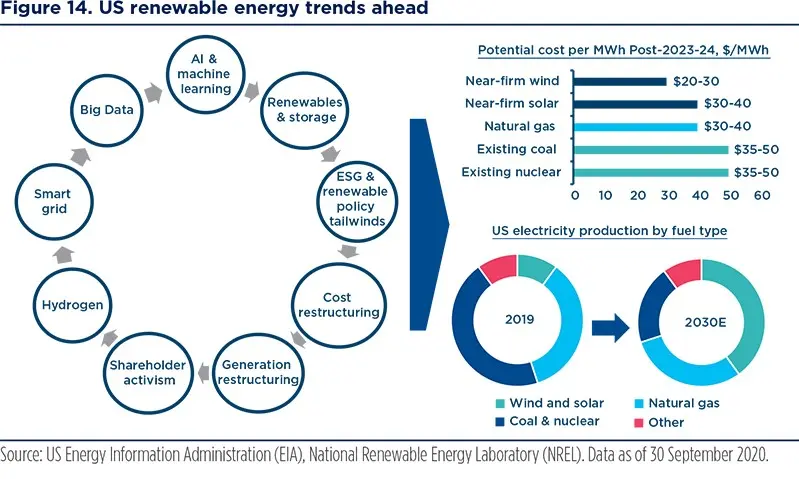
The United States is in the early stages of an investment cycle into economically viable renewables. Much of Europe has already converted, but in the United States we will see ten to twenty years of meaningful investment into profitable renewable projects. For most of the large US utilities, coal is being retired only when it makes economic sense, but technology is improving (e.g., fuel cells, batteries, solar) and we expect the industry’s disruptive factors to expand further and accelerate over the coming years.
The Utilities is unique among all other sectors as it has the regulated ability to invest into higher operating margins.
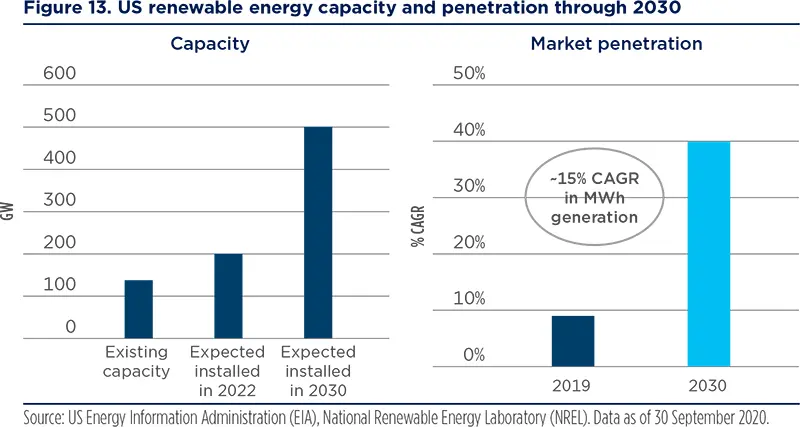
On the investment side, renewable energy capacity in the United States is forecasted to increase from approximately 137 gigawatts (GW) this year to 200 gigawatts in 2022 and 500 GW in 2030, according to the National Energy Renewable Laboratory. This will be possible as the cost of renewables declines below that of fossil fuels. We expect over $400bn in capital expenditure for renewables over the next ten years. The Utilities sector is unique among all other sectors as it has the regulated ability to invest into higher operating margins. Such information may change due to any Democrat-led investment incentives that might accelerate investment.
History likely to repeat itself
We have historical examples to draw upon that are analogous to what will happen with technological transformations to big banks, industrials and utilities. Those examples refer to everything from the aftermath of the tech bubble to railroads, the internal combustion engine, etc
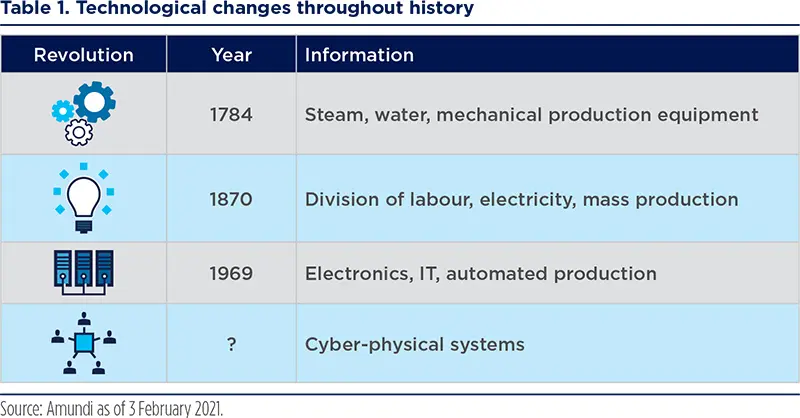
In 1993, just as PCs were about to become more ubiquitous, technology was 6% of the S&P 500. In 2007, the year of the first iPhone, it was 17%. Today, including the communications services stocks that used to be in the technology sector, it accounts for 33% of the S&P 500. As technology benefits shift to the companies and industries that will revolutionise emerging tech (e.g., AI, machine learning, 5G, cloud, renewables), the big banks, leading industrials and forward-thinking utilities should do what technology has done to transform their profit pools and, more importantly, their valuations.
Nearly half of value represents stability and defensiveness
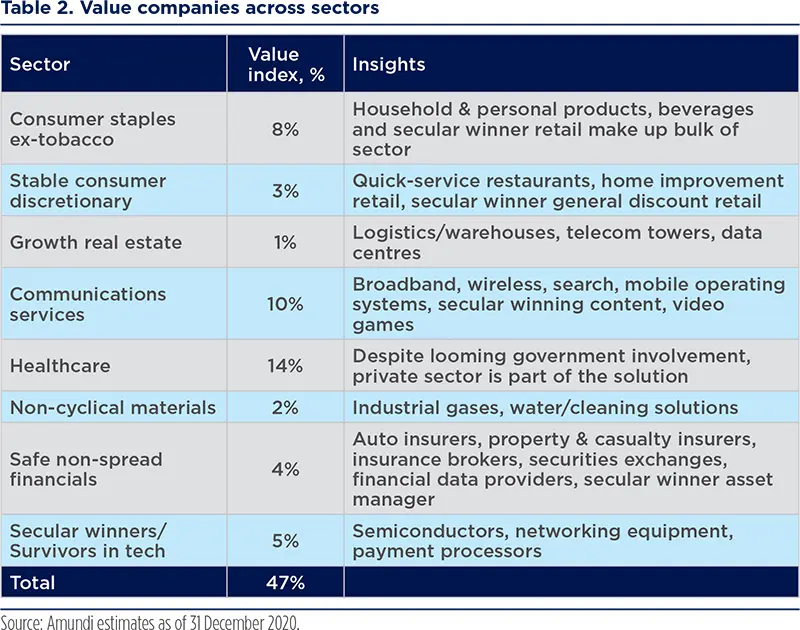
There is a misperception that value is full of distressed firms. We believe this is not true. We estimate that nearly half of the large-cap value index is comprised of companies with relatively stable and/or defensive characteristics that are also structural winners more often than not. With our view that 25% of the value universe represents a transformational technology opportunity as described above, the total that is anything but distressed or deep value is almost three-quarters of the value index. In addition, many of the firms we categorise as stable or defensive are scale industry players that will accrue similar technology benefits to market share and operating margins as we see for financials and industrials. Industries include media and entertainment, mass/ discount and home improvement retail, quick-service restaurants, asset management, industrial gasses and payments. Importantly, an active manager with an emphasis on quality and the sustainability of business models may avoid deep, distressed value, where the existential risks reside. These include mall-based retail with no plausible e-commerce strategy, secularly challenged regional banks, energy, tobacco, airlines, office and mall REITs.
An active manager with an emphasis on quality and the sustainability of business models will avoid deep, distressed value, where the existential risks reside.
US value includes the most likely group of ‘ESG improvers’
Currently, the United States lags other countries and regions in ESG, based on ESG ratings by major ratings providers. However, we have found emerging evidence that suggests the US firms are closing the gap with best-in-class ESG firms globally. Interestingly, the three sectors with the lowest ESG score and the largest gap with best-in-class European ESG scores are financials, industrials and utilities, just under 30% of the value index.
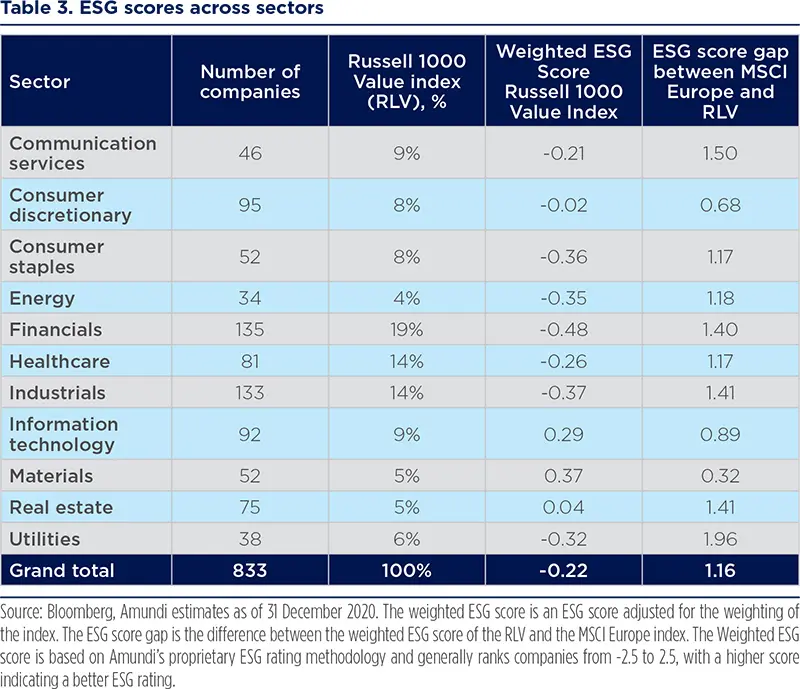
We expect the Federal Reserve and the Biden administration to close the regulatory disclosure gap with Europe around climate risk.
The rationale for the improvement in ESG scores for utilities is described in detail above given the emerging transformation towards renewables.
Among financials and industrials, a meaningful driver of the poor relative ESG scores is a lack of disclosure. As discussed in our recent paper “Building ESG momentum in US equities”, improvements in ESG data and disclosures are gaining more momentum among US companies. In particular, environmental and social shareholder resolutions in the most recent 2020 proxy season garnered almost as much support as governance resolutions, twice what they were several years ago.
Moreover, the bulk of such resolutions called for greater transparency and improved disclosure. Banks provide a clear example as the large US banks lag their European peers in ESG ratings with the primary factor being climate risk. European regulations require significant disclosure of climate risks for bank operations, such as loans. Currently, the US does not have regulations to the scale of Europe, but we expect the Federal Reserve and the Biden administration to close the regulatory disclosure gap with Europe around climate risk.
US value vs. the rest of the world: quality with appealing valuation
In 2020, we made the case that the case for US equities in global portfolios is built on the premise that unlike other markets, the S&P 500 is not particularly analogous to the US economy. We would extend that assertion partially to US large cap value. While the S&P 500 is a collection of the best and most profitable companies in the world and the US economy is not the US stock market, we observed above that nearly threequarters of the US large cap value universe represents secular growth, stability and defensiveness, while the composition of value differs globally.
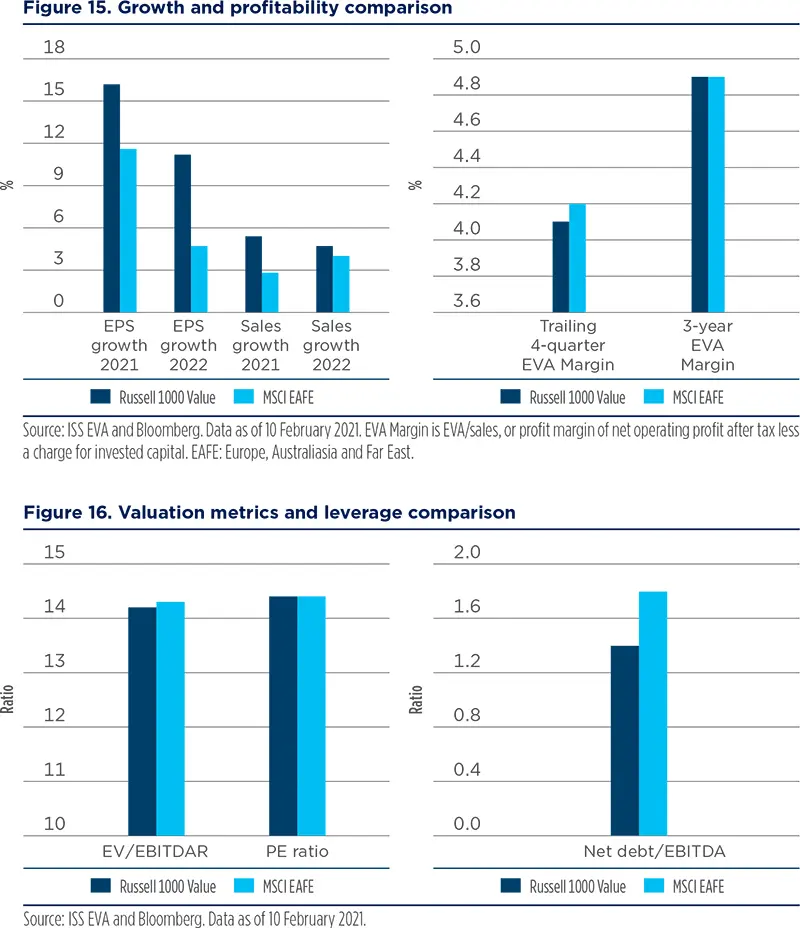
US value has been more profitable and is forecast to have higher growth in 2021 and 2022 than the core markets of the rest of the world, as shown in figure 15 where we compare the primary US large-cap value index, the Russell 1000 Value, with the MSCI EAFE. Moreover, as figure 15 demonstrates, valuation is approximately the same, while debt levels are lower. Thus, US value provides higher risk-adjusted quality and growth for the same valuation.
US value is more profitable and cheaper than the core markets fo the rest of the world (ex-United States).
Conclusion: the time for US value is now
With the context that over ten-year rolling periods, value has almost always outperformed growth. However, the more recent periods in which growth has massively outperformed value have been an anomaly. While recency bias can lead to a systematic exaggeration in any direction, it is clear to us that right now the aggregate market participants have created a powerful investable anomaly for value over growth. We believe that conditions are budiling for a rotation towards value thanks to rebounding growth and rising bond yields on the wake of massive fiscal stimulus and ultra-accomodative monetary policy.
While recency bias can lead to a systematic exaggeration in any direction, it is clear to us that right now the aggregate market participants have created a powerful investable anomaly for value over growth.
Again, history is likely to repeat itself
This has happened before and we cannot see why it won’t again. Over the past 60 years, investors have often cited many troubling geopolitical and financial events as reasons to avoid taking the ‘risk’ of owning stocks, whether it was the Cuban missile crisis, the Vietnam war, the lost decade of the 1970s -- marked by double-digit interest rates, inflation and unemployment -- the 23% one-day record decline in the Dow Jones index in October 1987, the savings and loan crisis of 1990, the internet bubble bursting in 2000, the unprecedented terror attacks of 11 September 2001, the global financial crisis, and, more recently, coronavirus. Investors who missed the powerful risk-on rallies hurt their long-term returns meaningfully. On the other side are the bubbles – the ‘niftyfifty’ of the early 1970s, the tech bubble in the late 1990s, and the housing bubble in the mid-2000s. Investors who enjoyed rapidly appreciating stock prices convinced many investors to keep riding out the market. This works until it does not.
Recency bias
The recent past may be fresh in one’s mind, but putting it in the proper context can keep it from having an undue influence on investment performance. Recency bias -- when people extrapolate a current trend well into the future -- is one of the most powerful biases in finance. Human psychology weighs recent events and observations more heavily than those in the past. This is a version of the availability heuristic whereby people tend to base their thinking disproportionately on whatever comes most easily to mind. In an investment context, this can be dangerous because people tend to give more credence to recent investment performance, current events and new information, disregarding the majority of the facts, valuations and the long-term picture when attempting to maximise future returns. This is not an academic or theoretical argument; rather recency bias often leads investors to make poor decisions that can erode earning potential by tempting themselves to hold for too long what has worked and/or selling compelling value too soon.
Appendix: US value vs. growth overtimeSince 1968, there have been only seven five-year periods which showed growth outperformance. Three of them have been the most recent periods. 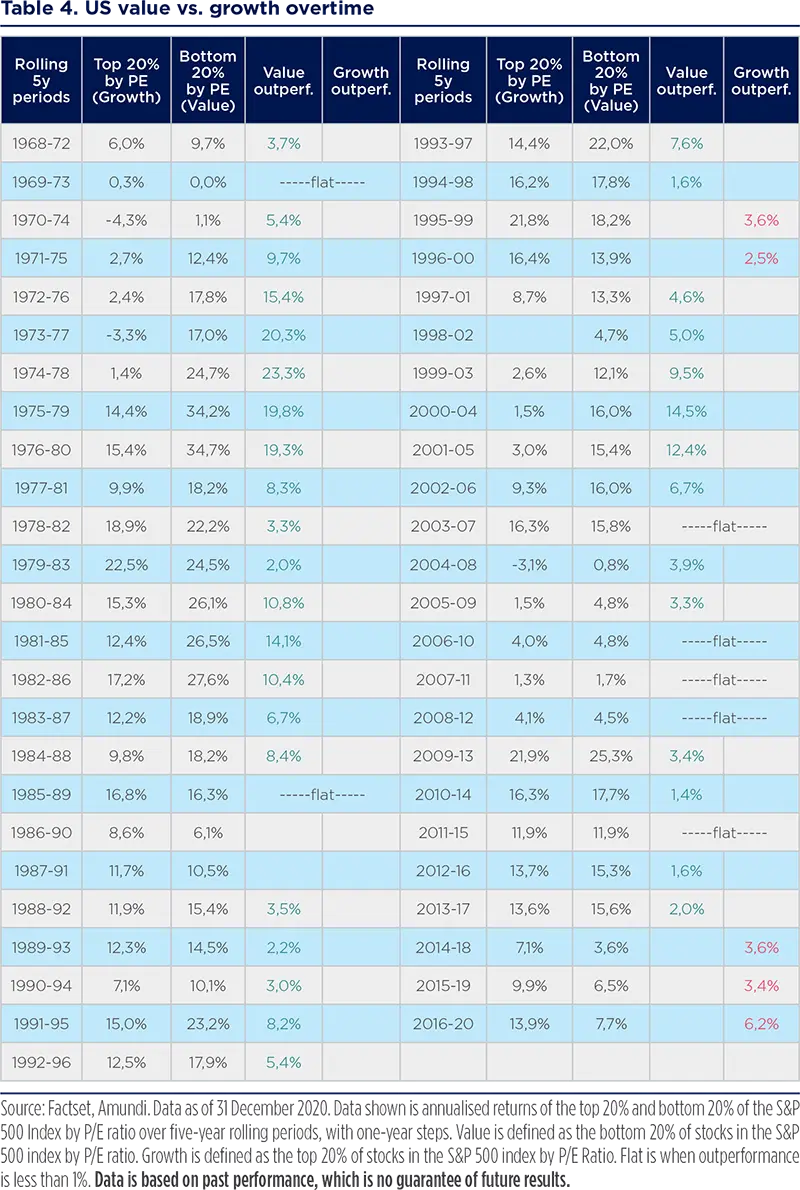
|
Definitions
- Correlation:The degree of association between two or more variables; in finance, it is the degree to which assets or asset class prices have moved in relation to each other. Correlation is expressed by a correlation coefficient that ranges from -1 (always move in opposite direction) through 0 (absolutely independent) to 1 (always move in the same direction).
- Cyclical vs. defensive sectors: Cyclical companies are companies whose profit and stock prices are highly correlated with economic fluctuations. Defensive stocks, on the contrary, are less correlated to economic cycles. MSCI GICS cyclicals sectors are: consumer discretionary, financial, real estate, industrials, information technology and materials, while defensive sectors are consumer staples, energy, healthcare, telecommunications services and utilities.
- Diversification: Diversification is a strategy that mixes a variety of investments within a portfolio in an attempt to limit exposure to any single asset or risk.
- Growth style: It aims at investing in the growth potential of a company. It is defined by five variables: 1. long-term forward EPS growth rate; 2. short-term forward EPS growth rate; 3. current internal growth rate; 4. long-term historical EPS growth trend; and 5. long-term historical sales per share growth trend. Sectors with a dominance of growth style: consumer staples, healthcare, IT.
- P/E ratio: The price-to-earnings ratio (P/E ratio) is the ratio for valuing a company that measures its current share price relative to its per-share earnings (EPS).
- Quality investing: It aims at capturing the performance of quality growth stocks by identifying stocks with high return on equity (ROE), stable year-over- year earnings growth, and low financial leverage.
- Russell 1000 growth index: it measures the performance of large cap US growth stocks.
- Russell 1000 value Index: it measures the performance of large cap US value stocks
- Super high-growth stocks: A high-growth stock is anticipated to grow at a rate significantly above the average growth for the market.
- Value style: It refers to purchasing stocks at relatively low prices, as indicated by low price-to- earnings, price-to-book, and price-to-sales ratios, and high dividend yields. Sectors with dominance of value style: energy, financials, telecom, utilities, real estate.
- Volatility: A statistical measure of the dispersion of returns for a given security or market index. Usually, the higher the volatility, the riskier the security/market.


