
Summary
Executive summary
Numerous factors have been driving the development of passively managed vehicles and their increasing weight in institutional investors’ portfolios. In particular, a recent PwC study showed that the weight of passive investments in global pension funds’ portfolios grew from 19% in 2017 to 25% in 20201. Key benefits are that their performance (relative to their reference index) is highly predictable, their costs are typically lower than those of actively managed vehicles, and the range of available instruments has increased considerably in terms of geography, sector, investment theme and type of index. Furthermore, the growth of smart beta indices has offset significantly the inefficiency of conventional capitalisation-weighted indices and expanded the opportunities to customise the implementation of a given strategy.
Meanwhile, the capacity of active managers to consistently outperform their benchmark has been widely debated by academics and professionals. Nevertheless, passive management is not a panacea. Investors should be aware that tracking-error tends to increase in certain market circumstances, particularly in very volatile environments, which can be more of an issue for passive vehicles whose performance is expected to be more predictable. Moreover, standard indices are often tainted with construction biases, such as a high degree of risk concentration in a limited number of securities. It should also be added that if all investors were to adopt standard passive investing, trading volume would be essentially explained by market capitalisation, leading to a crowding of trades and hence jeopardising the faith in market efficiency. Active management is still needed alongside passive management to allow the market to function efficiently.
The choice between active and passive management is actually an important one when it comes to implementing a given asset allocation decision and investors regularly ask for our advice on this matter. Our Multi-Asset investment experience leads us to recommend combining active and passive vehicles: active and passive management respond to different investor needs and market environments, as the latter influence the relative performance of different investment approaches. As a result, Multi-Asset portfolios are able to mix dynamically active and passive vehicles, depending on market trends and investors objectives, thus allowing our clients to benefit from the advantages of both types of approach. It should be added that choosing a passive strategy is in itself an active decision, particularly when considering the choice of the benchmark of the selected strategy.
In the current post-Covid-19 context, investors will probably modify their asset allocation as a result of the increased probability of higher inflation scenarios. When integrating new asset classes in this perspective, passive solutions could be appropriate as a first step, before moving into active strategies. Regarding the latter, investors should be aware that active managers that will outperform in the new expected environment will not necessarily be the same as in the past.
As well as providing a refresher of how to define the “activeness” of a portfolio and how to measure it, we will provide a short summary of academic observations about whether active management is rewarded, before describing the relative advantages of active and passive management. We will then share our insights on the indicators institutional investors should look at before deciding which of these styles to favour in their portfolios and outline some investment cases based on our advisory and management experience to illustrate potential approaches.
The authors would like to thank Marie Brière, Alessandro d’Erme, Thierry Roncalli, and Paul Weber for their contributions and references to their work, as well as Claudia Bertino, Laura Fiorot, Karin Franceries, Miriam Oucouc, and Laurent Trottier and for their careful reading and valuable comments.
Is active management rewarded?
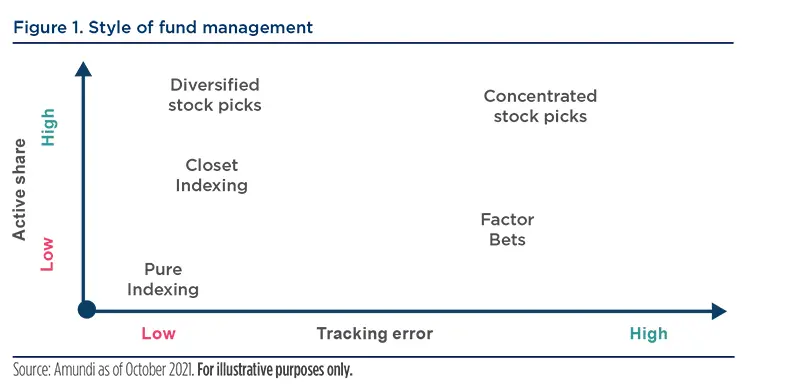
When analysing the performance of a portfolio, one has to distinguish whether the relative performance is due to a systematic exposure to risk factors2 from a component that would be genuinely representative of the manager’s skill. Such analysis of the behaviour of a portfolio should therefore be based on the combination of tracking-error and active share analysis, together with an understanding of the portfolio’s exposure to risk factors and its evolution over time. The following illustration shows that high/low levels of tracking-error and active share ratios correspond to different portfolio management styles and degrees of activeness: in particular, high tracking-error combined with low active share generally reflects a portfolio dominated by factor bets, while a portfolio with low tracking-error and high active share tends to strongly diverge from its index in terms of stock composition, but not at all in terms of exposure to factors.
1- Basing active management evaluations on information ratio
While it is useful to understand what indicators can help distinguish between active and passive management, the next question is whether investors should bother with active management at all. In other words, are we able to identify managers that are able to persistently outperform a reference index?
The law of active management relies on the notion of information ratio, which relates the active return of a portfolio to its active risk (or tracking-error). When setting an excess return target over a benchmark, institutional investors (as well as asset managers) tend to rely on information ratio as a yardstick to evaluate the value add of active management. It measures the excess return that is generated per unit of relative risk, using the following formula:
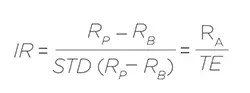
where IR is the portfolio’s Information Ratio, RP its return, RB that of its benchmark, RA the active return and TE the tracking-error of the portfolio.
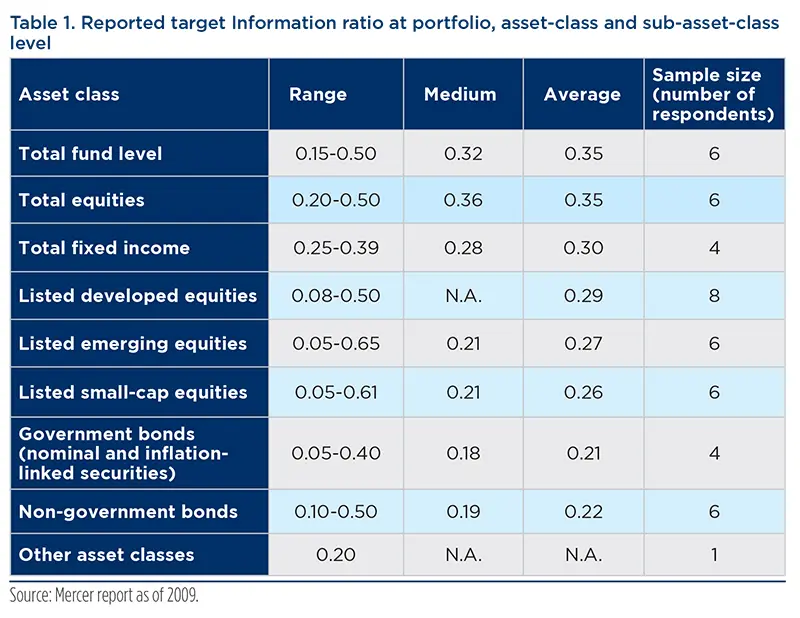
A positive information ratio is representative of an outperforming portfolio, but it needs to be sufficiently high to justify investing in an active portfolio. Most active investors traditionally target information ratios between 0.25 and 0.50 over the long term for the managers in which they invest. Long-term is defined as covering a full market cycle, i.e. at least five years and preferably ten years to ensure that it includes both favourable and unfavourable market conditions. In the case of a lower information ratio, the benefit of choosing an active strategy is not very convincing, while a much higher one, which is sometimes promoted by certain managers particularly in the alternative management world, is very difficult to sustain over a long period of time.
The 0.25-0.50 range is in line with the results of a survey that was conducted by Mercer in 2009 for the Norwegian Government Pension Fund Global3 among 14 government pension funds from the major global regions. The report reviewed the excess return objective set by these institutions for their portfolio in particular and the major asset classes included in it. The average expected information ratio was identified at around 0.35 for equities and slightly lower for fixed income.
Information ratio targets are influenced by a number of parameters4. Starting with suggestions from academics, the key contribution came from Grinold and Kahn5 who formalised the information ratio of any active manager as a function of:
- the manager’s skill, expressed by the information coefficient IC, measured as the correlation between forecast and realised return,
- and the breadth of the investment universe (or the number of independent signals), using the formula: IR= IC*sqrt(N).
Beyond the portfolio manager's skill, the information ratio is a positive function of the breadth of the investment universe.
In other words, beyond the portfolio manager’s skill, the information ratio is a positive function of the breadth of the investment universe, i.e., the number of independent investment decisions available to the investor.
A number of subsequent studies6 have highlighted the limits of the actual application of this seminal work, particularly emphasising that constraints in the portfolio construction (such as country or sector maximum exposures, short-selling restrictions, etc.), led to suboptimal portfolio weights, thus reducing the maximum achievable Information ratio compared with Grinold’s law.
It can also be argued that information ratios are impacted by market conditions. During high volatility periods in financial markets, tracking-error tends to increase along with correlations between assets, thereby reducing potential information ratios.
Skill can also be limited by size or investment constraints, such as the lack of leverage or use of derivatives which are helpful to swiftly modify asset allocation.
Moreover, information ratios should be compared within relatively homogeneous universes of portfolios, and not between low-risk and high-risk portfolios, as in the former case the weakness of the denominator can lead to very high, but also highly variable, information ratios. It is actually passive managers that record the highest information ratios as the first basis points of tracking error are the most profitable ones. Efficient tax management and security lending revenues are sources of value add that particularly help passive managers generate excess return with no tracking-error, hence a potentially unlimited information ratio.
Do active managers outperform?
In a previous article, we reviewed the academic literature concerning the performance of active management7 and this helped us conclude that manager alpha does seem to exist and shows persistence. Such persistence also seems to be stronger for fixed income than for equities. A study has also pointed to a positive link between security selection and market timing skills, and this result seems to be vindicated by NBIM which, in a very comprehensive report published in 2020 on “20 years of external management”, showed that talented portfolio managers are the same ones that are able to pick stocks well during boom times and time the market well during recessions: understanding the market and how it influences stocks is therefore key to outperformance, even for a specialist equity manager who is necessarily more than a pure bottom-up expert.
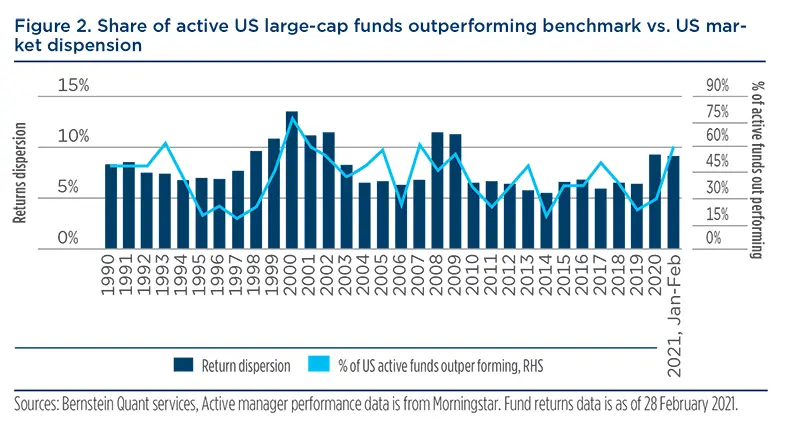
Manager alpha also varies depending on the degree of efficiency of the underlying market. As an illustration, the following graph shows that the majority of active US equity fund managers have underperformed the broad S&P Composite 1500 index over the past decade, underlining the difficulty of beating the US market over that period, even though the situation started to improve in 2020, as shown in the following graph included in a recent Amundi analysis.
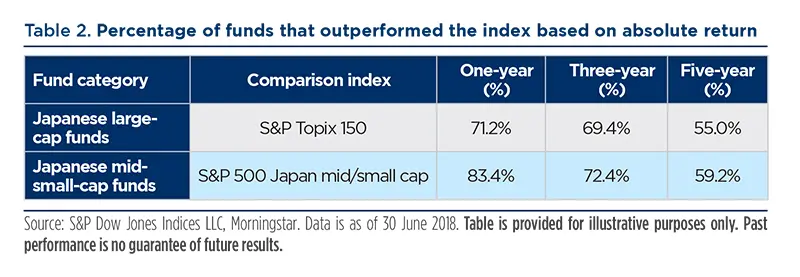
The situation has been somewhat different on the Japanese equity market, where the majority of large cap and mid/small cap funds have outperformed the reference index over the 2013-18 period.
Our own quantitative analysis, as described in the paper referenced in our footnote 4, also showed that during the 2012-17 period, the majority of global equity and global fixed-income managers outperformed the reference index, generating a significantly positive average information ratio. We stressed nevertheless that such performance needed to be closely analysed due to the likely over-exposure of most managers to certain factors, such as size for equity managers and credit for fixed-income managers, which can significantly outperform during a generally positive cyclical environment.
Our experience in managing funds of funds has also confirmed the existence of active managers who are able to outperform their reference index over the long term and that they can be identified through a combination of quantitative and qualitative analysis. Investors must be aware, however, that such outperformance is variable depending on the asset class and market circumstance, and needs to be analysed in depth to understand whether it is linked to factor exposure or to genuine security selection skills.
When and how to choose active or passive management? An institutional approach
The key question investors ask themselves when implementing a given asset allocation decision is whether to use active or passive instruments. Attitudes on this matter vary widely, depending on investors' beliefs. Some institutions believe in full market efficiency and for them active managers able to generate consistent alpha over time do not exist. As a result, they prefer to systematically choose passive vehicles.
A recent study showed that the proportion of equity, as well as bond, assets that are managed passively within European pension plans is slightly above 50% across both asset classes.
Other investors believe that inefficiencies can arise from time to time, potentially leading to excess returns (net of management costs) to be extracted when using appropriate strategies.
It seems that the institutional market is split on this issue. A recent consultant study8 showed that the proportion of equity, as well as bond, assets that are managed passively within European pension plans is slightly above 50% across both asset classes, reflecting the trend to increased exposure to passives that has taken place in recent years.
This split in investors’ attitudes reflects the fact that both active and passive management offer benefits. The advantages of passive management are obvious:
- the cost – particularly low for mainstream asset classes and for very large investors;
- the absence of risk of underperformance relative to the market;
- the efficiency of portfolio rebalancing and tactical allocation that it enables, as investors may then concentrate the risk they are taking on asset allocation decisions and passive vehicles can be used for efficient portfolio rebalancing due to their liquidity;
- the diversification provided (as long as one considers that reference indices are always an appropriate representation of the broader market), and
- the transparency offered by portfolios based on systematic construction rules, as well as the reduced cost of monitoring – and lower complexity – for the investor.
At a time of increasing investor interest in Outsourced CIO and focus on asset allocation rather than security selection, passive investing looks particularly attractive.

We can add that passive management is a quicker way of implementing innovative ideas, that can be customised and co-designed between the investor, the passive manager and the index provider. Moreover, passive investing is not necessarily an easy approach, as it leaves the key focus on asset allocation and on the selection of the appropriate reference index to get exposure to a given market. These are very much active decisions.
On the other hand, active management can not only be considered as a source of excess return, but also as a risk diversification tool, due to the variety of styles adopted by active managers. With the growth of smart beta indices, style diversification can admittedly also be obtained with passive vehicles, but it is probably even broader in the active space where a number of manager styles cannot easily be represented by well-recognised factors. Moreover, investing in active strategies can be a way for investors to move up the learning curve before deciding to develop internal management capabilities. Finally, selecting active strategies looks appropriate for investors with a long-term investment horizon that makes them more able to withstand periods of underperformance from the active strategies they have selected.
Active management can not only be considered as a source of excess return, but also as a risk diversification tool, due to the variety of styles adopted by active managers.
As an illustration, the aforementioned report published by NBIM last year on its 20-year experience with external managers confirmed the potential benefits of going active, at least for some asset classes – the report is focused on equity strategies, and also provides valuable insights on how to best benefit from active management. They reported a remarkably high annual return generated over the 2000-19 period from their selected managers, with the highest contributions coming from emerging, environmental and small-capitalisation mandates. In line with our conclusions from the first section of this paper, they observed that outperforming portfolios tended to be concentrated, with a high proportion of out-of-benchmark companies, implying high active share ratios.
Also illustrating our view that active manager selection should be based on a view on future market trends, they decided to look for active managers in asset classes or regions that they thought would expand over the coming years; as an example, they searched for specialists on Chinese equities as early as at the beginning of the 2000s, reflecting their belief that China would emerge as a leading global power.
Quite interestingly, the high information ratio they generated was not merely due to individual managers’ positive contributions, but was primarily due to portfolio construction. The contribution of diversification to the obtained information ratio was higher than that coming from just manager selection. This was due to the diversification approach followed by the selected managers, but also to the fact that periods of outperformance usually did not coincide between mandates on different asset classes. A positive contribution also came from timing – identifying managers before they started to outperform – and horizon – staying longer with successful managers while pruning others more rapidly. The result was also clearly helped by the strong internal capabilities they built to select and monitor managers.
These observations tend to confirm that manager selection is to a large extent an asset allocation activity, requiring a view on which areas talented managers are more likely to outperform in, how to weight managers, and how to allocate dynamically between them. This is also in line with our Multi-Asset experience in managing portfolios invested in funds or managers.
Manager selection is to a large extent an asset allocation activity, requiring a view on which areas talented managers are more likely to outperform in, how to weight managers, and how to allocate dynamically between them.
Choice of active or passive management: key factors of influence
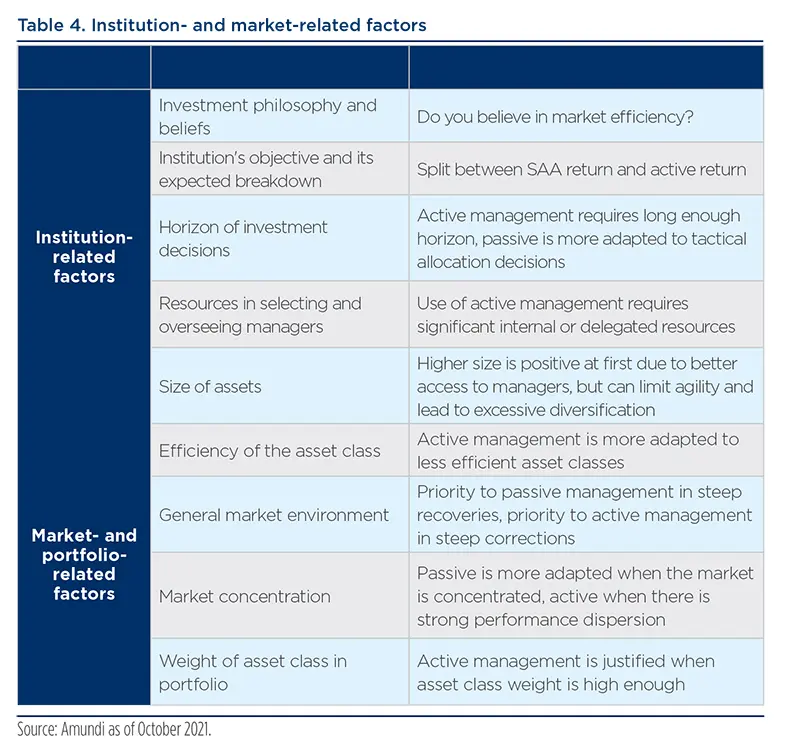
There are a number of factors, some specific to this institution or other market-related, that investors should weigh when choosing between active and passive strategies to implement their asset allocation decisions.
Institutionally-related factors:
- The first one relates to the institution’s beliefs and investment philosophy. If it believes in a strong market efficiency assumption, or if it is highly confident in the capacity of its asset allocation decisions to meet its return objectives, it will essentially invest in passive strategies. This will help avoid unpleasant surprises linked to disappointing performance from active underlying strategies. Likewise, some investors are primarily focused on the costs of asset management, with limited interest in the return-generation that is expected to more than offset the costs of active management. For these strongly cost-aware institutions, passive will tend to be favoured.
- The institution’s overall investment objective and its expected breakdown. Passive investments are favoured if the institution is very confident in the potential of its strategic asset allocation (SAA) to deliver the expected return it targets for the long term and does not want to risk seeing active management negatively impact such a return.
- The horizon of investment decisions. Passive management is preferable for investors implementing an asset allocation decision with a short-term horizon (say less than a year) or those who are highly sensitive to performance gaps over short horizons, while active managers – which tend to have a long pay-off – should only be selected by investors with a long enough investment horizon.
- The institution’s resource for selecting and overseeing active managers. Some large institutional investors have been able to add value by using active management, but the example of the Norwegian fund as described previously, underlines a number of conditions for success:
- A capacity to time managers adequately, whereas some investors tend to invest in external managers based on an outstanding track-record, but at the peak of their relative performance and/or to capitulate just after a period of severe underperformance. For this reason, an in-depth understanding of the factors explaining a manager’s performance cycle is strongly needed.
- A capacity to monitor the exposure and risks of the underlying portfolio. Transparency on the underlying manager’s holdings helps to better understand their decision-making process (what types of stocks do they hold, how often do they turn their portfolio around, what is their buying/selling discipline? …) but also to be able to precisely monitor the exposure and risks of the aggregate portfolio. If, as an investor, you realise that your active managers are all overweight certain stocks at some point in time, you may want to neutralise part of that risk if you believe that it is excessively calibrated.
We can also add that the institution’s size may impact its choice between active and passive management. Some large pension funds whose exposure to their domestic fixed-income market represents a meaningful share of that market’s capitalisation will tend to adopt a passive approach to their domestic fixed-income exposure within a liability-matching approach, as their size limits their agility on that market. Likewise, the information ratio and excess return of large institutional investors may be negatively affected by the need to diversify their portfolio across a significant number of individual managers, as even if they display strong manager selection skills, not all selected managers will do well and the underperforming ones will drag down total portfolio performance. It may also be noted that increased regulatory pressure on institutions to keep tight control of their overall management fees is leading them to favour passive management, as is observed in the case of French retirement schemes.
Our experience is that for core equity asset classes at least (such as US, European and Japanese equities), the marginal advantage of one additional fund to an investor’s portfolio, as the combination of a high number of funds then leads to a near-replication of the market (with higher fees)9, without mentioning the operational complexity linked to investing in many funds. In a previous analysis, we showed that there is a clear inflection point at around five funds in a single-asset-class portfolio. which underlines the limited benefits of extra fund diversification after that level. We should add, however, that the “optimal” number of active funds in a portfolio depends on market conditions, asset class volatility, as well as the characteristics of the underlying funds and the return objectives of the overall portfolio. For instance, “optimal” diversification is reached more rapidly in the case of the US equity market than for the Japanese market, due to the latter’s higher volatility and higher average fund tracking-error.
At least for core equity asset classes, the marginal advantage of one additional fund to an investor's portfolio diminishes rapidly.
Market or portfolio-related factors:
- The efficiency of the underlying asset class: it clearly makes more sense to rely on passive instruments in efficient asset classes, where the probability of outperforming the reference index is generally limited, than for less efficient markets such as small cap stocks or emerging market debt, where an active manager’s security-picking ability can be better rewarded. More generally, active management is best suited to asset classes which are broad enough to offer significant outperformance potential for successful managers.
- General market environment: our observation is that during extremely volatile market circumstances, the majority of managers tend to outperform during the intensive phase of the correction, probably due to the defensive stance they adopt, and underperform during the subsequent market recovery. This was particularly evident during the Great Financial Crisis, when most active equity managers lagged the rally which started in mid-March 2009 as they were generally holding cash and were underweight the most cyclical part of the market. Investors willing to make a contrarian asset allocation call during such market circumstances should favour passive vehicles. More generally, active equity management is more recommended in so-called stock-picking environments, whereas exposure to passive or focused factors should be favoured in markets with strong leadership.
- Market concentration: when market performance is primarily driven by a limited number of stocks, as was the case during the TMT bubble at the end of the 90s, as well as more recently when just five mega-stocks (the so-called GAFAM) were the main contributors to the rise of the S&P500 index, it is difficult for active managers to outperform due to maximum weighting constraints or valuation discipline (as these stocks then tend to look very expensive). Active management should subsequently be favoured when there is more dispersion between stock performance, in other words when correlations between stock returns are lower. This is probably the environment that started in 2021 along with the very significant market rotation that is currently taking place.
- The weight of the asset class in the portfolio: for a tactical position that will represent a small weight in the portfolio, say a maximum of 2%, the expected impact on the performance of the overall portfolio does not seem to be material enough to justify the resources needed to select and oversee an active fund; it is then more appropriate to use a passive instrument.
These considerations can be synthesised in the following table.
We recommend that investors combine active and passive management, depending on the characteristics of the portfolio being managed.
Based on these elements, our practice as Multi-Asset managers leads us to recommend investors combine active and passive management, depending on the characteristics of the portfolio being managed (and thus the investor’s goals), market conditions, and the type of strategy being pursued for the underlying asset class.
As an illustration, looking towards future trends, investors' choice between active and passive investing will very much depend on their market outlook. If they believe in a higher inflation scenario in the long term, they will in particular choose to invest in such asset classes as inflation-linked bonds or commodities. In case these are new asset classes in their allocation, a natural first step will be to select passive instruments, given that the choice of the precise strategy (for instance, which commodities to focus on?) will be the key determinant on performance. Moreover, investors in active strategies should be aware that the active funds or managers that did well on the past will not necessarily continue to outperform in a structurally different market environment. In other words, anticipating a change in scenario should have an impact on the selection of active strategies.
Investor cases
1- Proposed core-satellite approach for the construction of a global equity portfolio
A number of investors implement a core/satellite approach to construct their portfolio and this framework allows them to use both active and passive strategies. As an illustration, using the example of a global equity portfolio, the core bucket, which typically represents about two thirds of the portfolio, should be a good representation of the risk and return target of the portfolio and focuses on generating capital appreciation over the medium to long term through equity beta exposure. It can then be invested in passive global equity funds. In addition, an allocation can be considered to regional equity indices, either replicating the composition of a global equity benchmark or potentially tilted to certain regions in order to benefit from different long-term trends in market returns expected for the different regions. It can be completed by a portfolio of factor ETFs aimed at limiting market cap biases, as well as harvesting risk premia which have been shown to be rewarded over the long term.
The satellite bucket can then be constructed around the objective of adding value without excessively disrupting the risk calibration of the overall portfolio. It can be composed of high alpha strategies aiming to benefit from specialised active management skills, which can be particularly rewarding, especially in emerging and small/mid cap markets, but also for more efficient markets through high-conviction stock-picking managers. This bucket can also include thematic strategies designed to benefit from sources of growth that are anticipated for the long term, while not fully anticipated by investors, within key economic, technological, environmental, or socio-demographic megatrends. This strategy may be implemented through open-ended mutual funds or segregated accounts depending on the size of the various buckets considered by investors, as well as their requirements in terms of governance, customisation and reporting.
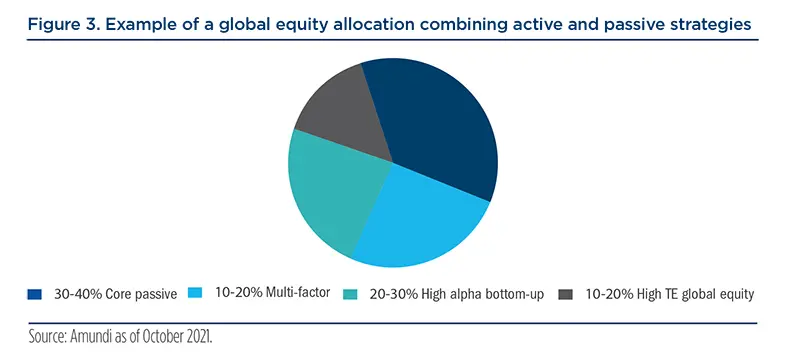
This portfolio structure is represented in figure 3.
2- Proposed approach for the construction of a Multi-Asset portfolio
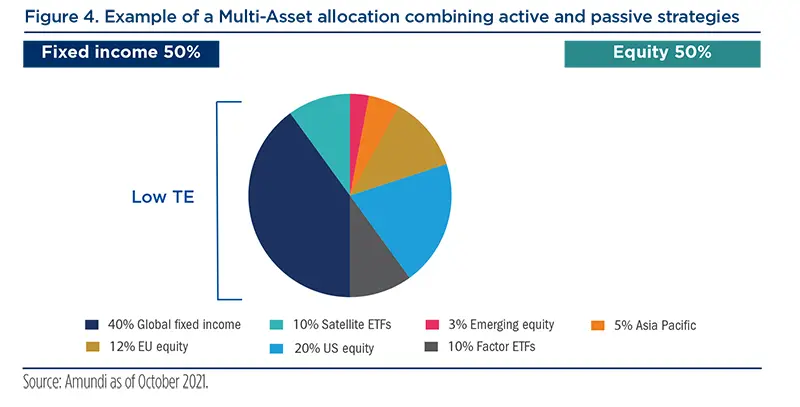
Taking another example of a Multi-Asset portfolio managed for an international institution, we proposed applying the following process:
- Global equity implementation based on a combination of regional sleeves (US Equity, European Equity, Asian Equity…) with beta and factor deviations kept within tight ranges around the benchmark, alongside the possibility of allocating to factors, using passive instruments. These can either be ETFs or customised factor portfolios.
- Global fixed income implementation with:
- an actively managed portfolio, but with a limited tracking-error, designed to capture the potential value add of credit selection and to integrate the investor’s specific constraints in terms of universe;
- complemented by an exposure to Fixed-income ETFs for specific asset classes, such as US MBS;
- active management of the portfolio’s overall duration via futures.
This example illustrates that:
- the efficient management of a Multi-Asset portfolio supposes using a variety of instruments, particularly the combination of active and passive vehicles.
- It is best to separate sources of value add. For instance, ensuring that the risk of an active stock-picking bucket does come from security selection, whereas exposure to factors can be better controlled and managed though specific instruments. This allows for a better control of potentially unwanted biases, particularly those generated by the active management of the equity bucket.
- Portfolio monitoring tools must be able to integrate all types of instruments for adequate control of the allocation of the portfolio.
The efficient management of a Multi-Asset portfolio supposes using a variety of instruments, particularly the combination of active and passive vehicles.
Key messages
In summary, both active and passive investments are useful in the construction of a diversified portfolio. Investors’ preference between active and passive management should be supported by their answers to the following parameters:
- Their investment philosophy, particularly their belief in the capacity of active management to add value;
- Portfolio return and risk objectives;
- Sources of expected return and resources allocated to each of these sources, particularly between asset allocation and security/fund selection;
- Segmentation of asset allocation along different asset classes and availability of skilled active managers in these asset classes.
More precisely, the capacity to identify such managers with a potential to outperform is influenced by the specifics and breadth of investment opportunities of the asset class, as well as the objective and horizon pursued in implementing a given strategy, as well as market conditions, as excess return is often cyclical. The choice of passive vehicles is particularly well adapted to the implementation of short-term tactical asset allocation decisions, whereas active strategies are favoured only when the investment horizon is long enough and for investors with the appropriate resources to identify and monitor highly skilled managers. Amundi Multi-Asset’s strong resources in manager selection and its long experience in managing portfolios that combine active and passive vehicles make us particularly well positioned to advise our institutional clients in their portfolio construction process.
Appendix: Active management: what does it mean and how to measure it?
There are two main indicators that can be used to measure the degree of 'activeness' in a portfolio: tracking error and active share.
Tracking error
Tracking-error is the most widely used indicator of a portfolio’s activeness. It is defined as the standard deviation of the difference in returns between the portfolio and its benchmark.
Interpreting tracking-error depends on a number of factors, particularly the asset class and market conditions.
- The example of a single-country fixed-income portfolio. In this case, the scope for active decisions (in duration, curve allocation, issuer selection) is generally much more limited than in a global equity portfolio. As a result, the threshold for considering a portfolio as being active is lower than for global equity portfolios (where a tracking error below 3% can be seen as being representative of a moderately active portfolio). This example also underlines the relationship between tracking-error and the volatility of the underlying market.
- The example of an equity portfolio in a low volatility environment. In a context of extremely low market volatility, it can be hard to generate a high enough tracking error with long-only positions. This was the case during the years preceding the Great Financial crisis which saw a rapid development of so-called “130/30 funds” that were designed to make portfolios more active by taking some degree of leverage with short positions reaching about 30% of the portfolio. When volatility started to jump in 2008, things quickly turned negative for these funds, which sometimes faced an uncontrolled increase in risk and challenges in meeting liquidity, and they did not survive the crisis.
Active share
Active share has emerged over the past decade as another meaningful indicator of 'activeness' in equity investing. This metric helps understand how different a portfolio is from its reference benchmark. Its mathematical definition is the following:
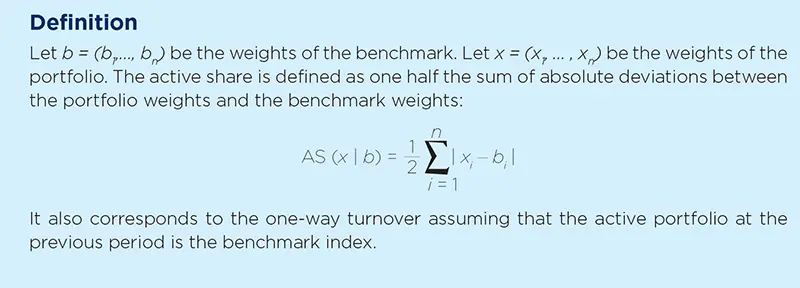
For long-only portfolios, we have:

For long-only portfolios, the active share ratio is comprised between 0 – for a pure replication of the index – and 1, representing a portfolio that only contains securities outside of the reference index. Funds with an active share ratio above 70% are generally considered to be active, while those with an active share ratio below 60% are less so. Funds with low active share have a higher hurdle to overcome in terms of performance generation, as the overlapping positions between the portfolio and the index will not contribute to outperformance. Academic studies10 have actually shown that funds with high active share ratios were more likely to outperform their benchmark even after fees.
Combining tracking-error and active share allows a more robust assessment of an active manager’s approach, helping to distinguish between systematic exposure to factors and security selection as the two main sources of active risk. A portfolio with low tracking error and high active share is generally indicative of strong security selection choices, while a portfolio with high tracking-error and low active share is indicative of strong deviations from the index in terms of factor exposure.
Risk factors
Risk factors are common drivers that explain the cross-sectional variance of expected returns, and the most widely used, following academic studies that have underlined their explanatory power, are size, value, low volatility, momentum and quality11. They represent a significant extension of the Capital Asset Pricing Model (CAPM), which has emphasised the market as being the main driver of a security’s returns, with the beta factor measuring the capacity of a security to amplify or attenuate market return.
The advantage of such factors is that contrary to alpha, which measures a portfolio manager’s specific security selection skill, they are scalable: it means that exposure to these factors can be adjusted with no size constraints to the risk that investors are ready to take. As investment products allowing investors to be exposed to these factors have rapidly expanded, they have become a form of asset allocation tool, all the more so as their combination provides an efficient diversification to a portfolio.
______________
1. Pwc and ALFI: “Beyond their Borders”: Evolution of foreign investment by pension funds, 2020 Edition
2. A definition of tracking-error, active share, risk factors and a discussion on how to interpret them are presented in appendix at the end of this document.
3. Mercer, “Norwegian Ministry of Finance, Survey on Active Management – Final Report”, December 2009. All data from this section has been taken from this report.
4. We have already addressed the following considerations in our Asset allocation advisory paper “Setting objectives for your asset allocation”, Amundi Discussion Paper, DP-32-2018, March 2018.
5. Richard C. Grinold and Ronald N. Kahn, “Breadth, Skill, and Time”, The Journal of Portfolio Management, Fall 2011.
6. See for instance Clarke, R., H. de Silva, and S. Thorley (2002), “Portfolio Constraints and the Fundamental Law of Active Management”, Journal of Investment Management, 4(3), p. 54-72 and their introduction of the “transfer co.
7. See reference above.
8. Mercer, Investing in the future, European Asset Allocation Insights 2020.
9. See Amundi Allocation Solutions, Monthly newsletter n°39, May 2015.
10. Cremers, M., and Petajisto, A. (2009), How active is Your Fund Manager? A New Measure that Predicts Performance, Review of Financial Studies, 22(9), pp. 3329-3365.
11. As an illustration, see for instance “Portfolio construction: how approaching factor investing” by Bruno Taillardat in Amundi Pension Fund Letter number 1, January 2017.
Authors